EMA Distance Indicator [Eddie_Bitcoin]🧠 EMA Distance Indicator
This indicator is a powerful statistical tool designed to provide enhanced context and signal confirmation for traders who want to go beyond price action alone.
🔍 What It Does
It calculates and visualizes the distance (%) between two EMAs (Fast & Slow) on either the current chart symbol or a selected macro/index reference (e.g., BTC Dominance, TOTAL2, SPX). But it doesn't stop there:
Core Features:
✅ Real-time percentage distance between Fast and Slow EMAs
📈 Slope (acceleration) of the distance to capture trend momentum
🎯 Gaussian-based percentile rank of the current distance over a configurable historical sample
📊 Dynamic table display with intuitive emoji-based cues
🟢 Highlights extreme conditions (e.g., TOP 5% or LOW 5% percentile zones)
🔀 Compare both current asset and a macro/index asset side by side
💡 Display Modes:
Show only current symbol
Show only index/macro symbol
Show both with independently positioned tables
🎯 Ideal Use Case
This is not a standalone strategy, but rather a statistical enhancement module designed to pair with tools like my 👉 “AltCoin Index Correlation” indicator. It gives traders a quick-glance view of strength, divergence, and macro alignment for better timing and confidence.
Whether you’re trading altcoins, tracking dominance charts, or watching indices, this tool offers deep visual insight into EMA-based dynamics — wrapped in a clean, emoji-driven UI.
🛠 Created with ❤️ by @Eddie_Bitcoin
🚀 ### Check my profile for other juicy hints and original strategies. ### 🚀
Altcoin

AltCoin Index Correlation🧠 AltCoin Index Correlation — Strategy Overview
AltCoin Index Correlation is a dynamic EMA-based trading strategy designed primarily for altcoins, but also adaptable to stocks and indices, thanks to its flexible reference index system.
🧭 Strategy Philosophy
The core idea behind this strategy is simple yet powerful:
Price action becomes more meaningful when it aligns with broader market context.
This script analyzes the correlation between the asset’s trend and a reference index trend, using dual EMA (Exponential Moving Average) crossovers for both.
When both the altcoin and the reference index (e.g. Altcoin Dominance, BTC Dominance, Total Market Cap, or even indices like the NASDAQ 100 or S&P 500) are aligned in trend direction, the script considers it a high-confidence setup.
It also includes:
Optional inverse correlation logic (for contrarian setups)
Custom leverage settings (e.g., 1x, 1.8x, etc.)
A dynamic scale-out mechanism during weakening trends
Date filtering for controlled backtests
A live performance dashboard with equity, PnL, win rate, drawdown, APR, and more
⚙️ Default Settings & Backtest Results
Timeframe tested: 1H
Test date: May 20, 2025
Sample: 100 high-cap altcoins
Reference index: CRYPTOCAP:OTHERS.D (Altcoin Dominance)
Leverage: 1.8x (180% of capital used)
📊 With default settings:
Win rate: ~80%
Higher profits, due to increased exposure
Best suited for confident trend followers with higher risk tolerance
📉 With fixed capital or 1x leverage:
Win rate improves to ~90%
Lower returns, but greater capital preservation
Ideal for conservative or risk-managed trading styles
🔄 Versatility
While tailored for altcoins, this strategy supports traditional markets as well:
Easily switch the reference index to OANDA:NAS100USD or S&P 500 for stock correlation trading
Adjust EMA lengths and leverage to match the asset class and volatility profile
🧩 Suggested Use
Best used on trending markets (not sideways)
Ideal for 1H timeframes, but adjustable
Suitable for traders who want a rules-based, macro-aware entry/exit system
Try it out, customize it to your style, try different settings and share your results with the community!
Feedback is welcome — and improvements are always in progress.
🚀 ### Check my profile for other juicy hints and original strategies. ### 🚀

SASDv2rSensitive Altcoin Season Detector V2
This Pine Script™ code, titled "SASDv2r" (Sensitive Altcoin Season Detector version 2 revised), is designed for cryptocurrency trading analysis on the TradingView platform and tailored for those interested in tracking when altcoins might be outperforming Bitcoin, potentially indicating a market shift towards altcoins.
Feel free to use and modify. If you made it better, please let me know. Intention was to help the community with a tool for retail traders have no access to advanced, MV indicators. Solution uses classic TA only.
Use it witl TOTAL3/BTC indicator.
Please check: it gave signal just before last alt season % rose more than 250%.
Market Cap Data Fetching: The script fetches market capitalization data for Bitcoin, Ethereum, and all other altcoins (excluding Bitcoin and Ethereum) using request.security function.
Altcoin to Bitcoin Ratio: It calculates the ratio of total market cap of altcoins to Bitcoin's market cap (altToBtcRatio), which is central to identifying an "altcoin season."
Moving Averages: Several moving averages are computed for different time frames (50-day SMA, 200-day SMA, 20-day SMA, and 10-day EMA) to analyze trends in the altcoin to Bitcoin ratio.
Momentum Indicators: The script uses RSI (Relative Strength Index) and MACD (Moving Average Convergence Divergence) to gauge momentum and potential reversal points in the market.
Custom Indicators: It includes Volume Weighted Moving Average (VWMA) and a custom momentum indicator (altMomentum and altMomentumAvg) to provide additional insights into market movements.
Volatility Measurement: Bollinger Bands are calculated to assess volatility in the altcoin to Bitcoin ratio, which helps identify periods of high or low market activity.
Visual Analysis: Various plots are added to the chart for visual interpretation, including the altcoin to Bitcoin ratio, different moving averages, and Bollinger Bands.
Alt Season Detection: The script defines conditions for detecting when an "altcoin season" might be starting, based on crossovers of moving averages, RSI levels, MACD signals, and other custom criteria.
Performance Tracking: After signaling an alt season, the script evaluates the performance over the next 30 days by checking if there's been an increase in the altcoin to Bitcoin ratio, adding labels for positive or negative trends.(this one is in progress). Logic still gives false signals and aim is to identify failed signals.
Visual Signals: Labels are placed on the chart to visually indicate the beginning of a potential alt season or the performance outcome after a signal, aiding traders in making informed decisions.

Altcoin Total Average Divergence (YavuzAkbay)The "Average Price and Divergence" indicator is a strong tool built exclusively for cryptocurrency traders who understand the significance of comparing altcoins to Bitcoin (BTC). While traditional research frequently focusses on the value of cryptocurrencies against fiat currencies such as the US dollar, this indicator switches the focus to the value of altcoins against Bitcoin itself, allowing you to detect potential market opportunities and divergences.
The indicator allows you to compare the price of an altcoin to Bitcoin (e.g., ETHBTC, SOLBTC), which is critical for determining how well an altcoin performs against the main cryptocurrency. This is especially important for investors who expect Bitcoin's price will continue to rise logarithmically and want to ensure that their altcoin holdings retain or expand in market capitalisation compared to Bitcoin.
The indicator computes the average price of the chosen cryptocurrency relative to Bitcoin over the viewable portion of the chart. This average acts as a benchmark, indicating the normal value around which the altcoin's price moves.
The primary objective of this indicator is to calculate and plot the divergence, which is the difference between the altcoin's current price relative to Bitcoin and its average value. This divergence can reveal probable overbought or oversold conditions, allowing traders to make better decisions about entry and exit points.
The divergence is represented as a histogram, with bars representing the magnitude of the difference between the current and average prices. Positive values indicate that the altcoin is trading above its average value in comparison to Bitcoin, whereas negative values indicate that it is trading below its average.
The indicator automatically adjusts to the chart's visible range, ensuring that the average price and divergence are always calculated using the most relevant data. This makes the indicator extremely sensitive to changes in the chart view and market conditions.
How to Use:
A significant positive divergence may imply that the cryptocurrency is overbought in comparison to Bitcoin and is headed for a correction. A significant negative divergence, on the other hand, may indicate that the cryptocurrency has been oversold and is cheap in comparison to Bitcoin.
Tracking how an altcoin's price deviates from its average relative to Bitcoin can provide insights about the market's opinion towards that altcoin. Persistent positive divergence may suggest high market confidence, whilst constant negative divergence may imply a lack of interest or eroding fundamentals.
Use divergence data to better time your trades, either by entering when a cryptocurrency is discounted in comparison to its average (negative divergence) or departing when it is overpriced (positive divergence). This allows you to capture value as the price returns to its mean.
Ideal For:
Cryptocurrency Traders who want to understand how altcoins are performing relative to Bitcoin rather than just against fiat currencies.
Long-term Investors looking to ensure their altcoin investments are maintaining or growing their value relative to Bitcoin.
Market Analysts interested in identifying potential reversals or continuations in altcoin prices based on divergence from their average value relative to Bitcoin.

Entry FraggerEntry Fragger is a simple buy signal indicator.
It is most suitable for cryptocurrency, especially for altcoins on the 5 minute to daily timeframe and is based on simple volume calculations, in combination with EMA's.
Main Signal Logic explained:
A buy signal is generated by counting candles with an above average sell volume of 130% to 170%, taking into account the candles position below and above the 50 and 200 EMA.
If criteria meet, the first green candle above the 50 EMA's suggests upcoming higher prices.
The indicator has 2 input variables.
"Signal Confirmations (0 - 7):" Changes signal accuracy by a defining an ammount of high sell volume candles necessary below the 50 EMA.
"Volume Calculation Base (9 - 200):" Sets the exponential volume multiplier, this affects candle coloring and the volume calculation inside the candle.
"Style Settings": Turn ON/OFF Signals, Cloud, Bar Coloring, EMA's, etc...
There are no generally suitable default numbers for those 2 inputs, those have to be tested out, depending on cryptocurrency and timeframe.
The calculation is very basic, the underlying idea being, market maker initiating range breakouts through rapid increase of volume above or below the EMA's .
Example settings:
SOLUSDT: Signal Confirmations: 2, Volume Calculation Base 13.
SOLUSDT: Signal Confirmations: 0, Volume Calculation Base 20.
As you can see it affects signals quite a lot, but staying accurate.
Finetune the inputs to your preference.
Risk to Reward, Stoploss, Take Profit, position sizing, etc... is up to the user.
Recommended entry is to wait for following candle closes, entering half of the candle size and setting Stoploss outside the structure, like this:
Or right below the candles open, for safety.

Qu_Trend+
composition
- Consists of a thick trend line and a thin yellow line.
- The largest (green/red) lines indicate rising and falling markets.
- This line represents the 13-candle moving average of Tilson T3.
- The reason for 13 candles is because it best matches the recent market price based on Bitcoin.
- This value cannot be changed, so if you need it, please modify the public code and use it.
- The yellow line is the MA20 line, the ‘Bollinger Band center line’
(UI will show whether this line has been breakout)
- The same algorithm as 20 of the basic moving average (close standard) is applied.
- The algorithm for breakthrough is calculated based on real-time prices, not based on closing prices.
An additional short-term SMA is created, and whether it crosses the SMA is classified as a breakout/resistance.
How to use it
- If the trend line becomes gentle, it may indicate a change in trend when + MA20 is broken.
- While the slope of the trend line is steep, it indicates that the trend is difficult to change.
(If the trend changes at this time, it is likely to move sideways)
- If the trend changes continuously, it is a sideways market.
At this time, watch out for the movement of the end point where the sideways trend ends.

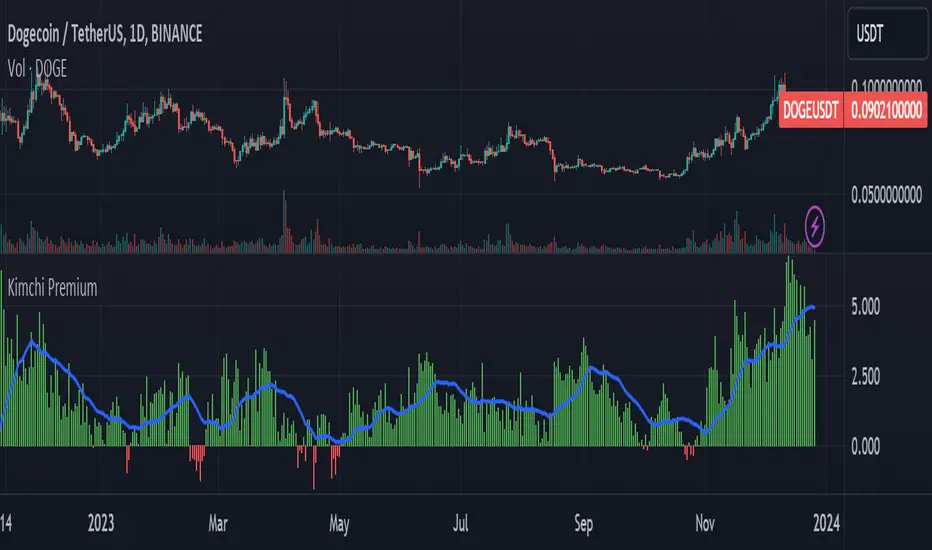
Kimchi Premium / Korean Premium ALL TICKERSKimchi Premium
Due to the isolated nature of Korean crypto markets, Koreans pay a hefty premium on most cryptos. (Usually ranging from 3% to 5%). This is colloquially known as the " Kimchi Premium ".
Uses
The extend of this premium can be used to gauge Korean sentiment towards certain tickers. Most of the insane alt coin rallies that are started by Korean degens are missed by foreign traders entirely. This script seeks to fix that.
Notes
This script automatically detects your current ticker and compares the USDT pair to the KRW pair after adjusting for exchange rate.
Works on all USDT, USDC, BUSD, FDUSD, USD, USDT.P, USDC.P or KRW pairs. Will obviously throw an error if your ticker has no KRW pairing.
Altcoin Dominance (without ETH) Excluding Stablecoins UnsymetricAltcoin Dominance (without ETH) Excluding Stablecoins Unsymetric
The purpose of the script is to show Altcoin's strength without Ethereum once we exclude stablecoins.
So we look into all altcoins besides eth and besides stablecoins divided by a value of eth+btc

Altcoin Dominance Excluding EthereumAltcoin Dominance Excluding Ethereum
The purpose of the script is to show Altcoin's strength without Ethereum.
Pretty much shows Altcoin's Dominance in comparison to Market Cap once we exclude Ethereum.

Altcoin Analyzer [Lysergik]Quickly view any USD-based asset's value relative to Bitcoin without needing to have a separate chart with all its bells and whistles.

Dominion - Bitcoin Altcoin Dominance [mutantdog]A simple and easy reference tool displaying a plot of the market cap dominance values for several significant cryptocurrencies.
The most widely used of these is bitcoin dominance (the top indicator shown above) which calculates the total market cap of bitcoin in relation to the total cryptocurrency market cap, displayed as a percentage. This is commonly used by traders to assess the strength of bitcoin in relation to the broader crypto market; increasing values being indicative of larger bitcoin moves and decreasing values often indicative of potential altcoin cycles. Likewise, ethereum dominance (the bottom indicator shown above) is frequently used as a means to indicate the strength of ethereum in relation to the broader crypto market.
Included options for marketcap dominance values are:
Bitcoin : CRYPTOCAP:BTC.D
Ethereum : CRYPTOCAP:ETH.D
Total DeFi (a composite of multiple top defi tokens): CRYPTOCAP:TOTALDEFI.D
Stablecoins (shows the combined dominance values for usdt and usdc): CRYPTOCAP:USDT.D + CRYPTOCAP:USDC.D
Flippening (shows the difference between bitcoin and ethereum dominance values): CRYPTOCAP:BTC.D - CRYPTOCAP:ETH.D
When used in combination with each other, these can provide a good overview of the general flow of capital within the crypto market.
Additional functionality:
up to three optional moving averages with a choice of SMA, EMA, WMA and RMA for each.
multi timeframe selector
alert condition presets for various moving average crosses.
Please be aware that, while useful as reference, dominance calculations are known to repaint frequently. As such the use of this indicator and its alerts should require caution.

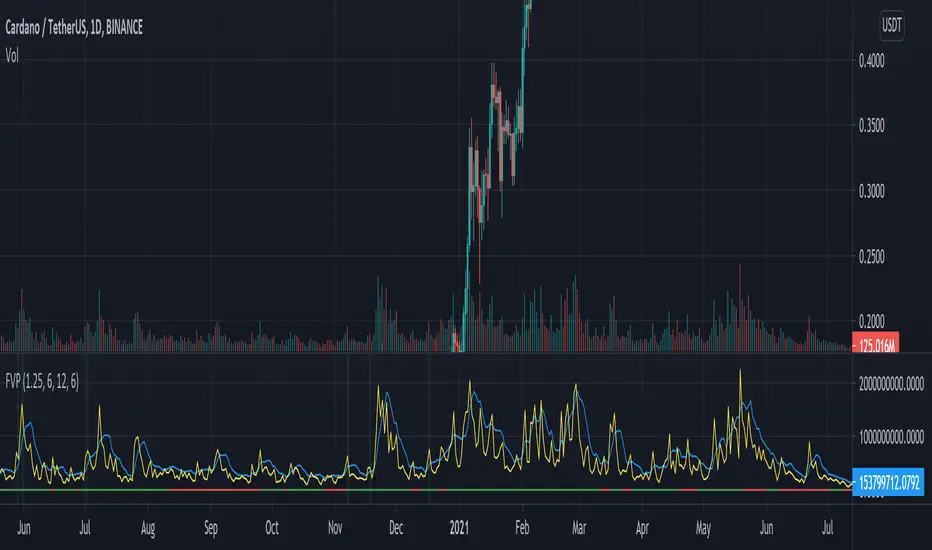
Kifier's ALT-COIN Failed Volume PressureGeneral Idea:
The basic idea is really simple - to detect during a bull-run, good mid-run entries or even predicting the start of a run, and the overcoming of the sell pressure, and I got this idea very naturally while looking back at my entries with ADA 6 months back. The indicator simply detects for you and alerts where volume reaches high reds but the actual price of the asset does not close lower than the previous open. This essentially shows a rejection of the selling pressure, and usually if either in a stagnant or bullish trend will just result in a bullish trend. It’s also great to detect entries into a bull-run mid way, which can happen quite often with cryptos. Due to the reliance of volume in this one, it’s probably best to stick with mid to low cap alt-coins, as BTC and even ETH at this point have a more complicated price action trends.
Usage:
It’s built ideally for long-term timeframes, so 1D is the minimum in my opinion, and it should be used in combination with other indicators to confirm entries and market conditions, plus fundamental analysis is VERY important when it comes to trading with volume as a leading indicator in lower cap alt-coins.
Structure:
The blue line is an average of the volume over a period while the yellow is the current volume, this makes it easy when a volume anomaly occurs and essentially a massive sell-off.
The green/red lines at the bottom unimaginatively is just a simple trend indicator based of two EMAs.
I also want to attempt to make a version for smaller time-frames as well, which needs to also account for market noise and a better trend detection but that’s for a future time.
It’d be great to hear feedback and even ideas on beneficial changes!
Arbitrage Sniper (POC)Good Morning Traders!
Today I want to share with you the proof-of-concept of how you would be able to do arbitrage with crypto pairs.
THE INDICATOR MUST BE PLACED ON THE TRADING PAIR OF THE TWO CURRENCIES (i.e. ETH/BTC, EOS/ETH etc.)
This arbitrage method is based on the transitional decorrelation between the crypto treding pair and the price ratio of the involved currencies, of course computing commissions as well.
Whenever the non-arbitrage condition is not respected, there is an arbitrage oportunity.
This indicator won't consider the chance of shorting, so if the arbitrage oportunity occurs the indicator will suggest you just the chance of buying the relative-undervalued currency (but inside the code you will know how to do the alternative method as well, by shorting the relative-overvalued currency)
Let's take the trading pair ETH/BTC (as in the graph) → if we assume commissions for the 0.075% of the order, the non-arbitrage condition will be presented like this
This arbitrage method will need three orders, so n=3
So let's assume that P(ETH)/(P(BTC)*P(ETH/BTC))>(1-0.075)^(-3) → it means that the price of Ethereum is currently overreated enough (relatively to the trading pair) for doing arbitrage.
We have two alternatives:
• Buy BTC, change it into ETH (by "buying" ETH in the trading pair ETH/BTC) and then sell ETH
• Sell ETH, buy BTC, change it into ETH (by "buying" ETH in the trading pair ETH/BTC)
On the other hand, if P(ETH)/(P(BTC)*P(ETH/BTC))<(1-0.075)^(-3) → it means that the price of Ethereum is currently underrared enough (relatively to the trading pair) for doing arbitrage.
We have two alternatives:
• Buy ETH, change it into BTC (by "selling" ETH in the trading pair ETH/BTC) and then sell BTC
• Sell BTC, buy ETH, change it into BTC (by "selling" ETH in the trading pair ETH/BTC)
I'm saying that is nothing more than a proof-of-concept since:
- Arbitrage Oportunities will emerge frequently just nearly zero commissions
- Data of prices are retrieved using security() function and there can be some delay (so the arbitrage oportunity will be already extinguished by the time the signal is retrieved)
- In order to have the freshest data, repiainting will occurr

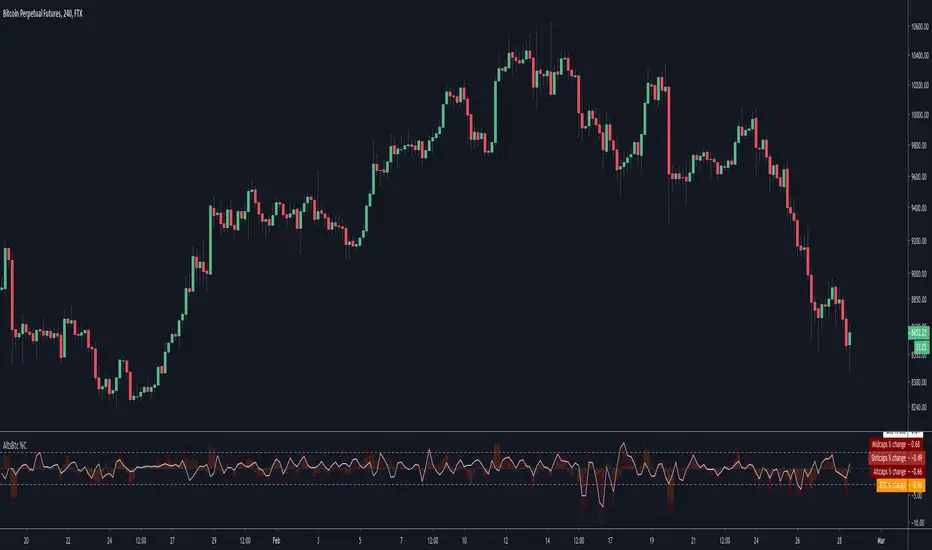
Alts vs Btc percentage changesCatch differences and over-corrections between Alts and Bitcoin via Ftx's indexes
A more visual description : i.imgur.com
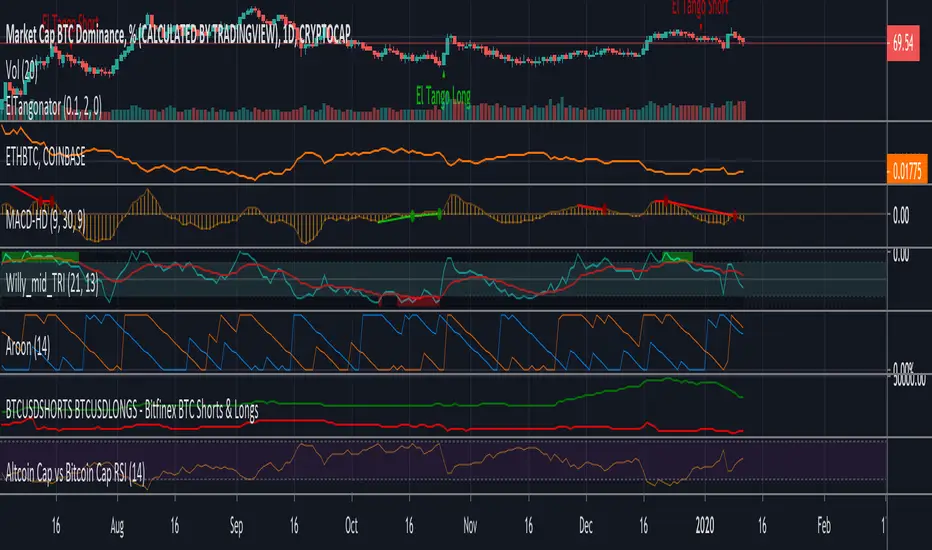
Price Streak Is Another Way to Spot TrendsPrice is never wrong, but sometimes reading it can be tricky.
Movements in the broader market or a sector can distract from a symbol that's been steadily trending in one direction or another. Sometimes the beginning of a move can also be so subtle that it flies under most people's radar.
Price Streak can help overcome these limitations by tracking consecutive up/down periods. It plots an easy-to-read color-coded histogram.
Because it simply counts the candles in a trend, Price Streak can give a clearer picture than magnitude-biased indicators like relative strength or MACD.
Applying Price Streak to the daily chart of Bitcoin Dominance , we find something very interesting right now: the longest drop since March 2017.
That moment in history, almost three years ago, marked the beginning of the last Altcoin bull market. Ethereum , for example, went from roughly $60 to over $1,300 in the following nine months.
While past performance isn't a guarantee of future results, this illustrates how sustained price moves can reveal changes in character.
Based on Price Streak's current reading, it may support the idea of another Altcoin cycle beginning now.

Altcoin Cap vs Bitcoin Cap RSIFollowing Willy Woo study of Altcoin Cap vs Bitcoin Cap RSI
charts.woobull.com
BullShrimp's 10EMAsA simple bundle of EMAs with some odd numbers that I found good confluence on 15min, 1h, 4h, 12h, 1d, 1w on BTC and on ALTS.
Works good for dynamic S/R on LTF and high probability target on MTF and HTF.
Try it out during your scans.
Lemme know what you think.
Coinbase ALT/USD IndexA simple ALT/USD pair index of all the altcoins currently trading on Coinbase.

What is ProfitableBTC, BNB or your favorite Alt Coin? This indicator shows what is profitable at the moment. Red bars are alt days, green bars are BTC days. Otherwise, it is a BNB day.
Hmm, most of the time it is a BNB day!

Altcoin Profitability Tracker 2Ever wonder which altcoins are performing better than Bitcoin? This script plots the profitability of 15 altcoins and BTCUSD so you can quickly determine where to invest your money.

Crypto Correlation Matrix Series [SHK]Hi everyone, Although everything's clear from the title but I should describe some basic points.
Currency Correlation is a statistical measure of how two securities move in relation to each other.
So this script is used to show if current pair (alt-coins) is moving in the same direction of bitcoin (or ethereum) or not. Consider that in crypto market most of alt-coins have correlation of +0.7 with bitcoin, So temporary changes in correlation may signal a reversal or sharp continuation for the alt-coin.
"1" : The alt coin is moving in same direction of Bitcoin (Or Ethereum).
"0" : The alt coin is moving in random direction compared to Bitcoin. (No movement relation)
"-1" : The alt coin is moving in opposite direction of Bitcoin.
Important Note: By default average of 15 bars back is measured to calculate the correlation by this script. Please test other periods and share the best options with us.
Comments are welcomed :)

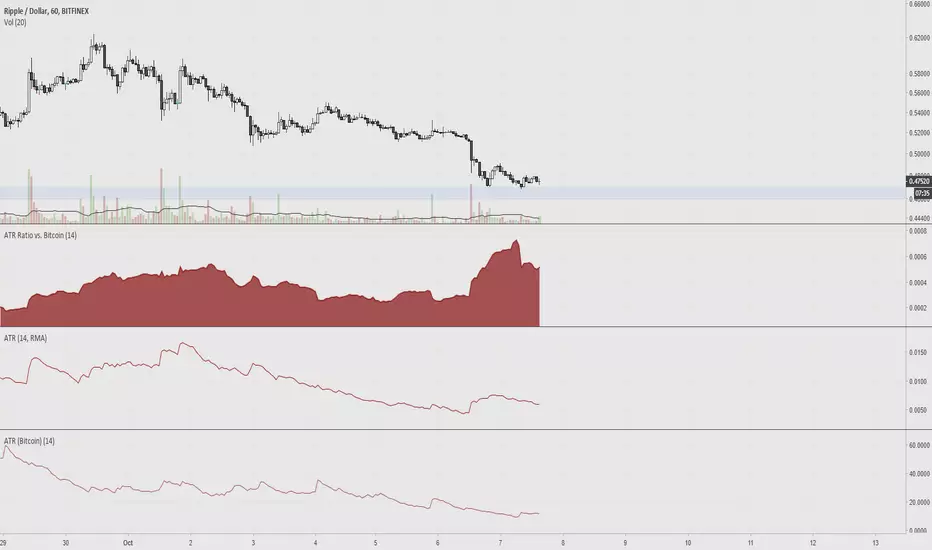
ATR Ratio vs. BitcoinAverage True Range is used to determine if a ticker's trading range is widening or narrowing, which is helpful for finding the trend or to use as a stop loss. The idea of this indicator is to compare the ATR of altcoins versus bitcoin, since volatility is low.
DPD INDICATOR (DEMA PRICE DİFFERENCE PERCENTAGE )I use DEMA and Price difference in many strategies and and trade.
Finally , ı wanted to build an indicator for relation between them.
It calculates the percentage of difference between price and dema and estimates deviation from the main trend.
Formula = (price-dema)/price*100
There is some parameters;
DEMA Length is length of dema , ı think 50 is good enough,
there is upper and lower band for DPD Score .
You can change it based on volatilities of your pairs to find an optima.
and use it to be sure about your entry point.
I will developed and combine DPD with some other indicators and build strategies with it.
You can be part of that , I am waiting for your feedback.
Stay in Touch :)
