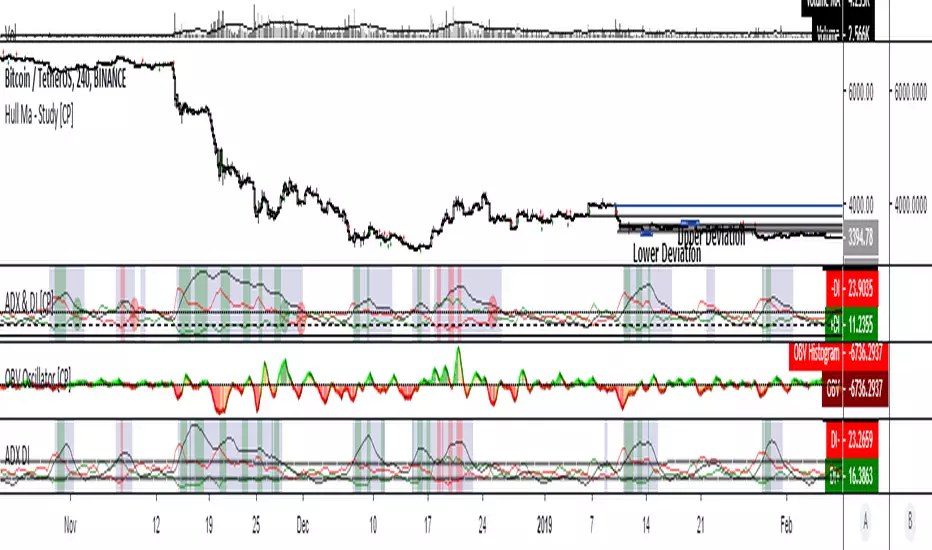
ADX & DI with Long + Short ConditionsMy version of the ADX & DI Indicator with an extra theshold and adjustable long and short conditions.
A green background (long) will appear when the ADX is rising, the DI+ is falling and the DI+ is below the (new) lower threshold.
A red background (short) will appear when the ADX is rising, the DI- is falling and the DI- is below the (new) lower treshold.
You can adjust the tolerance for the lower threshold in the settings of the indicator.
Ashi
[AN] HAStudy that signals buy and sell zones based on HeikinAshi chart.
Also includes exit signals.
Strategy that tests the signals is available here:


HAMA alertHeikin Ashi + EMA alert
- all time frame
---------------------------------
BTCUSDT
Dump protect

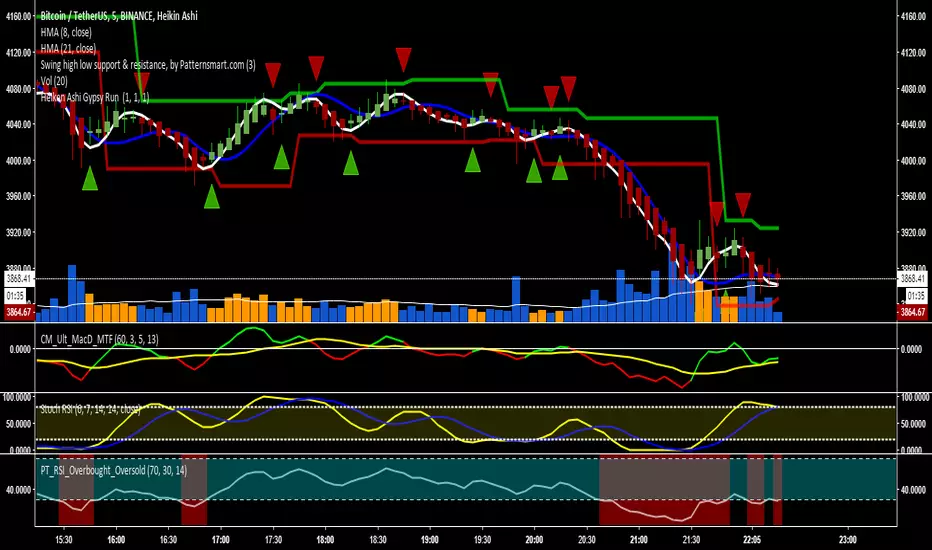
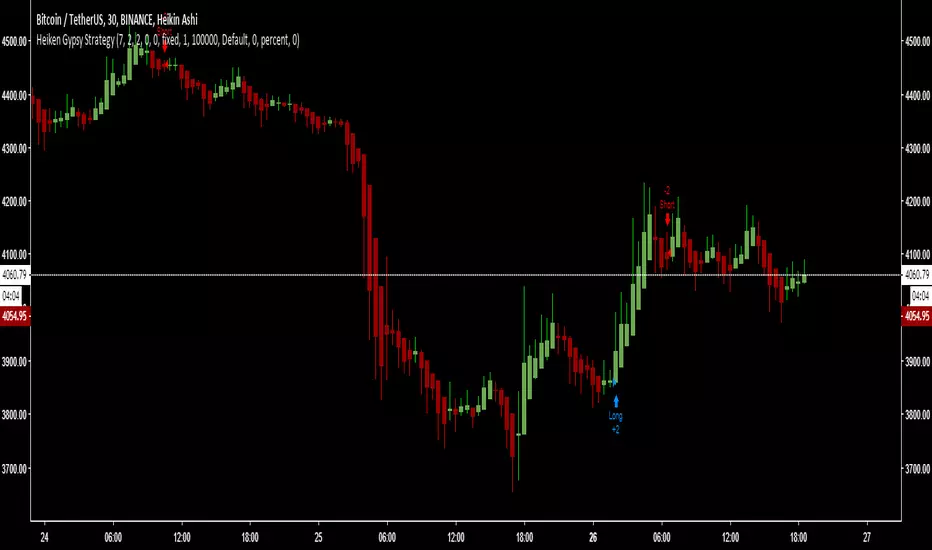
Heiken Ashi Gypsy Run Alerts & triggers based on heiken ashi changes in the colour of the candle, default settings are at 1, 1, 1 meaning it will trigger every time there is a change in the colour of the candle. You can change so it isn't as sensitive. It also has alert settings.

Up Down Strategy with MA Controla simple up down candle strategy with a built in MA control
alerts script:

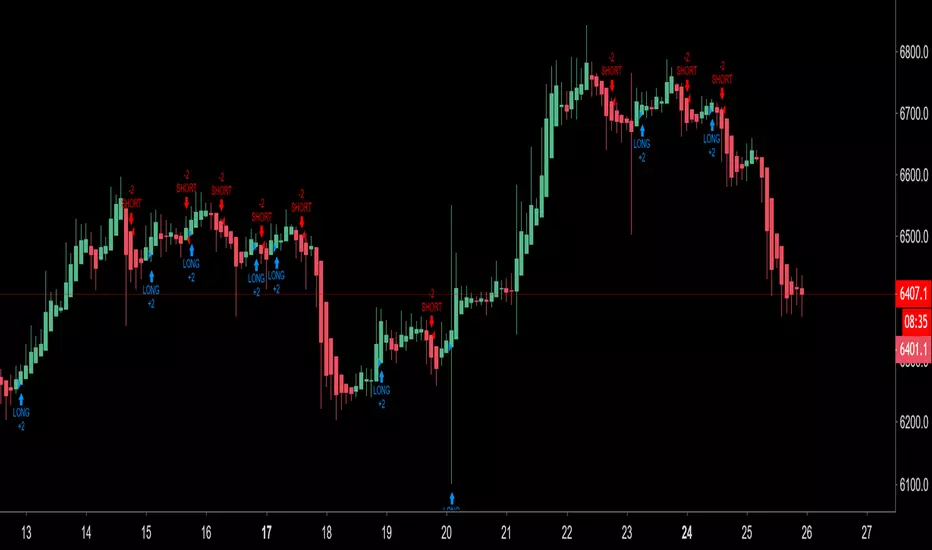
Mr Anderson Simple Moving Average Strategy with Bend10This script is based on Mr. Anderson's (also known as TrueCrypto28 on twitter) 10/20 Day SMA trading strategy.
This is the extended strategy which includes the Heikin Ashi candle addition, and also the Bend10 strategy.
Full explanation of strategy can be found on this thread: twitter.com
I believe there is a paid version of this indicator, but I believe it looks a bit messy, and does not include the Bend10 addition.
This version is free, less cluttered (my opinion), includes the Bend10 indicator flags, and also changes the background to show where the MAs cross.
Default indicator values align with Mr. Anderson's strategy. You can switch timeframes and it will remain based on the 1D unless you change it in the settings.
Indicator is based on the Heikin-Ashi candles, but you do not need to have these candles active for the indicator to work. It will work regardless of what candles you use.
EXPLANATION OF INDICATOR:
- "long" + green up arrow is printed when all of the long conditions are met
---> this is where you would enter a long trade
- green 'X' is printed when the long cover condition is met (HA candle flips red/price drops below 10d SMA/bearish SMA cross)
---> this is where you would exit your long trade
- "short" + red down arrow is printed when all of the short conditions are met
---> this is where you would enter a short trade
- red 'X' is printed when one of the short cover conditions are triggered (HA candle flips green/price goes above 10d SMA/bullish SMA cross)
---> this is where you would exit your short trade
- green 'B' is printed when the BEND10 long condition is met (bearish trending 10d SMA starts bending, price breaks above 10d SMA, and HA candle flips from red to green)
---> this is where you CAREFULLY consider going long. This flag is to catch big pumps earlier than the long signals. If you do make an entry here, it is advised that you keep a tight stop loss, and take profits when the price reaches the 20d SMA
- The background color for a candle is red when there is a bearish MA cross (fast beneath slow)
- The background color for a candle is green when there is a bullish MA cross (fast above slow)

3 TimeframesThis script allows you to overlay 2 other timeframes' open and close over your chart. It also has the option to overlay Heikin Ashi candles open and close over regular candles and vice versa, simply change the values in the settings. You can also set alerts for specific open/close.
🥢Crypto-Sticks: Ehler's Universal Oscillator by Cryptorthyhms🥢Crypto-Sticks™: Ehler's Ultimate Oscillator
A new series of indicators brought to you by Cryptorthyhms...giving you an alternate look at your trusted favorites! Follow me, there are still 2 dozen Crypto-Sticks indicators planned - all will be released in public library.
🚀Indicator Specific Info
New Crypto-Sticks option is an EMA of the average signal line output. Eventually I will go back and update the previous indicators with this feature as well!
Heiken Ashi candles (default) adds some more clear trend changing points. HA example here:
Volume weighting the HA candles adds a different dimension to the indicator which I have to explore more fully. VW does work somewhat on this indicator, skewing output but also adding (too much in my opinion) noise. An example of VW+HA:
💭Please leave me any ideas or feedback you have!
🚫If you use volume weighting you should be on heiken candles.
🚀Crypto-Sticks General Info
🚧This series isnt polished 100%, and I have some more options I will add in the future. But for now, I want to just release them, as I am not sure when I will have the time to put more work into them (many other big projects I am working on).
📊Its basically reinterpretations of all your favorite indicators. I calculate the values a little bit differently than normal, but the end result is creating a candlestick chart (for the indicator!). Then I added the option to plot them as Heiken Ashi candles to smooth out noise and make signaling easier. I recommend using the indicator on this setting.
🔊Lastly I implemented a Volume Weighting system for them all which simply integrates volume into the formulas for these indicators. For the most part this feature is experimental and doesn't provide huge utility (yet - I have other ways I want to try it as well - just no time). Though on some of the indicators it already shows great promise.
👍Enjoying this indicator or find it useful? Please give me a like and follow! There are many more indicators to be released in this series, not to mention I post crypto analysis and other free indicators regularly.
💬Questions? Comments? Want to get access to an entire suite of proven trading indicators? Come visit us on telegram and chat, or just soak up some knowledge. We make timely posts about the market, news, and strategy everyday. Our community isnt open only to subscribers - everyone is welcome to join.

🥢 Crypto-Sticks: Rate of Change v1.0 by Cryptorthyhms🥢 Crypto-Sticks™ Rate of Change
A new series of indicators brought to you by Cryptorthyhms...giving you an alternate look at your trusted favorites!
🚀 Indicator Specific Info
⛔Please remember that you will have to adjust the ROC overbought and oversold levels to suit the volatility of the instrument you are working with. In the future I will implement a feature that does this automatically, but for now its manual.
The OB/OS zones are given in two levels, because often you can find a line of best fit that will hit "small movements" and one that will hit "big movements." In this case I chose 2 and -2 for the small zones. For the bigger zones i chose 5 and -5.
Heiken Ashi candles adds some more clear trend changing points which can be executed at the second candle going in either direction. Other coins/charts will require their own strategy - you could potentially have to tweak that parameter. In this example you would enter on 2nd green, exit on 2nd red.
Volume weighting the HA candles adds a different dimension to the indicator which I have to explore more fully.
Since WTI doesnt have volume, this feature is irrelevant for this chart.
💭Please leave me any ideas or feedback you have!
🚫If you use volume weighting you should be on heiken candles.
🚀 Crypto-Sticks General Info
🚧This series isnt polished 100%, and I have some more options I will add in the future. But for now, I want to just release them, as I am not sure when I will have the time to put more work into them (many other big projects I am working on).
📊Its basically reinterpretations of all your favorite indicators. I calculate the values a little bit differently than normal, but the end result is creating a candlestick chart (for the indicator!). Then I added the option to plot them as Heiken Ashi candles to smooth out noise and make signaling easier. Here's how it looks as Heiken Ashi:
🔊Lastly I implemented a Volume Weighting system for them all which simply integrates volume into the formulas for these indicators. For the most part this feature is experimental and doesn't provide huge utility (yet - I have other ways I want to try it as well - just no time). Though on some of the indicators it already shows great promise.
👍Enjoying this indicator or find it useful? Please give me a like and follow! There are many more indicators to be released in this series, not to mention I post crypto analysis and other free indicators regularly.
💬Questions? Comments? Want to get access to an entire suite of proven trading indicators? Come visit us on telegram and chat, or just soak up some knowledge. We make timely posts about the market, news, and strategy everyday. Our community isnt open only to subscribers - everyone is welcome to join.

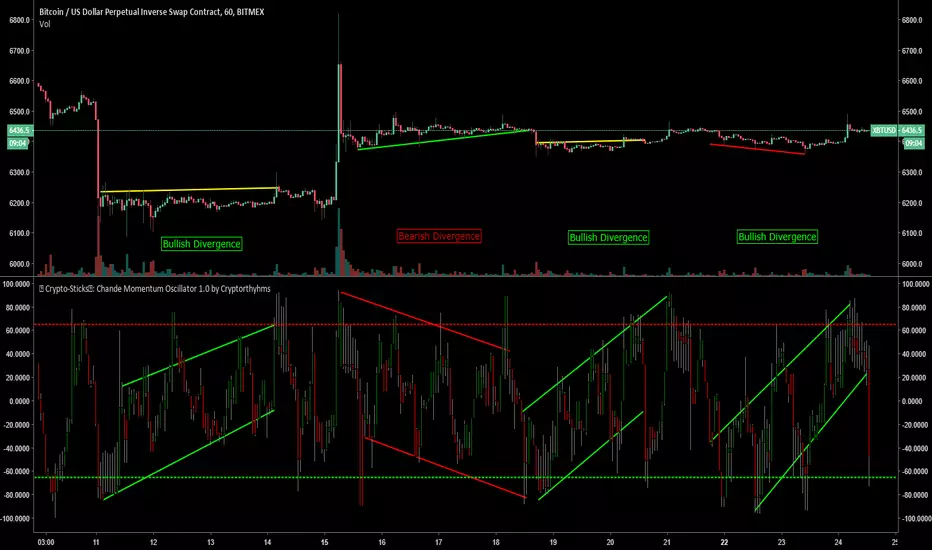
🥢 Crypto-Sticks™: Chande Momentum Osc by Cryptorthyhms🥢 Crypto-Sticks™
A new series of indicators brought to you by Cryptorthyhms...giving you an alternate look at your trusted favorites!
🚀 Indicator Specific Info
I have found this indicator to show nice divergences as shown on the main chart. Even in this nightmarish sideways bitcoin movement, it still is giving decent divergence signals! It also gives a signaling system to CMO implementing overbought and oversold zones. This indicator is freely available for anyone from the public library.
🚀 Crypto-Sticks General Info
💭This series isnt polished 100%, and I have some more options I will add in the future. But for now, I want to just release them, as I am not sure when I will have the time to put more work into them (many other big projects I am working on).
📊Its basically reinterpretations of all your favorite indicators. I calculate the values a little bit differently than normal, but the end result is creating a candlestick chart (for the indicator!). Then I added the option to plot them as Heiken Ashi candles to smooth out noise and make signaling easier. Here's how it looks as Heiken Ashi:
🔊Lastly I implemented a Volume Weighting system for them all which simply integrates volume into the formulas for these indicators. For the most part this feature is experimental and doesn't provide huge utility ( yet - I have other ways I want to try it as well - just no time). Though on some of the indicators it already shows great promise. Here is Volume Weighted + Heiken Ashi:
👍Enjoying this indicator or find it useful? Please give me a like and follow! There are many more indicators to be released in this series, not to mention I post crypto analysis and other free indicators regularly.
💬Questions? Comments? Want to get access to an entire suite of proven trading indicators? Come visit us on telegram and chat, or just soak up some knowledge. We make timely posts about the market, news, and strategy everyday. Our community isnt open only to subscribers - everyone is welcome to join.
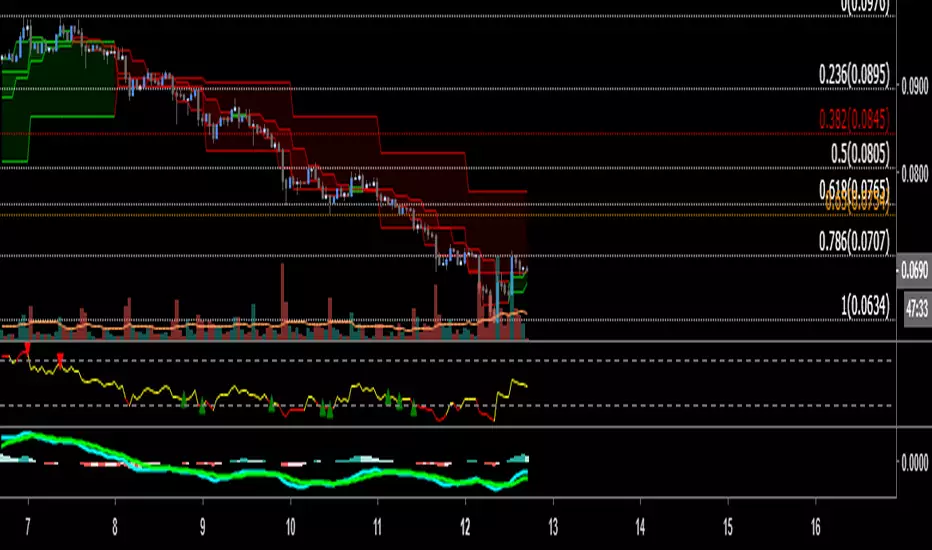
📊 Crypto-Sticks: Chande Momentum Oacillator 1.0 by CryptorthyhmsFirst release from the Crypto-Sticks series of indicators... brought to you by Cryptorthyhms!
🚀 Indicator specific Info
I find this implementation of CMO useful for spotting divergences and for creating signals based on the indicator. Some divergences were highlighted on the chart/indicator showing you potential use cases.
🚀 Crypto-Sticks General Info
💭The idea behind this series isnt polished 100%, and I have some more options I will add in the future. But for now, I want to just release them, as I am not sure when I will have the time to put more work into them (many other big projects I am working on).
📊Its basically reinterpretations/remixes of all your favorite indicators. I calculate the values a little bit differently than normal, but the end result is creating a candlestick chart (for the indicator!). Then I added the option to plot them as Heiken Ashi candles to smooth out noise and make signaling easier.
🔊Lastly I implemented a Volume Weighting system for them all which simply normalizes volume and integrates it into the formulas for these indicators. For the most part this feature is experimental and doesnt provude huge utility (yet - I have other ways I want to try it as well - just no time).
💠I have found the candlestick implementation offers some unique perspectives and I hope you find it useful!
👍If you enjoy the indicators, feel free to give it a like and follow me! Many more free indicators to come in this series.
💬Questions? Comments? Want to become a subscriber and gain access to tons of powerful custom indicators? Join us on our telegram which is linked in my signature below!

Librehash Heikin ScalpsThe ZN Heikin Candle Signals is a special indicator that is designed to do two things:
1. Provide all 'new' candles for you.
2. Provide entries and exits.
The purpose of this indicator is to provide a different set of candles that will allow you to see trends in the price data easier by smoothing it over and providing a slightly modified Heikin Ashi candle formula (no, it is not equivalent to the Heikin Ashi formula; i.e., the OHLC/4 for the opening that it commonly uses)
The indicator is fairly straightforward in its design as well, so this description will remain brief for the time being.
Essentially, what we did is create our own candle system. Then we installed buy and sell signals on those candles in order to give users super tight entries and exits.
Simple put, this is a must-have in any trading suite. These candles are not exact replicas of the Heikin Ashi, but rather a clever modification that allows for easier trend reading whilst still allowing you to exit at the tippy top or enter at the very bottom of a trend per the actual prices on the chart.
Here’s one major example:
Here we can see the indicator calling a sell before a major fall and not re-calling it until the precipitous negative price action completely exhausts itself.
Additional Notes
For some charts and time frames, you may need to tinker with the metrics in the control panel slightly (i.e., change the period and also the 'fastener' settings ever so slightly). Make sure to backtest after any and all changes that you make in the control panel and understand that different settings work better in different situations for different coins if you're looking to absolutely optimize this indicator for it to perform its best.
This is not necessary, but something that you all may find helpful as you're trading.
If you have purchased this indicator and you have any additional questions/concerns, please do not hesitate to reach out to me through here or via my other channels I have specified (TradingView does not allow me to post links; you know how to reach me).
Also, if you are interested in purchasing and have not done so yet, please reach out at your earliest convenience.
Thank you.

Real Price for Heikin Ashi ChartsThe indicator is in the top left of the screen! That's all there is, by design.
This is a super simple indicator that allows you to see what the real price of a candle was when using Heikin Ashi charts, while not cluttering up your screen.
HA charts are a great way to help those who can be spooked by the chaos of the markets (I'm one!), but they have a big drawback in that the price you see on a HA candle is often significantly different from the real price that you would trade on. This brings issues of unrealistic expectations of profits/losses, and also makes back testing a strategy very difficult. I still wouldn't recommend ever using TradingView's "strategy" tool when using HA charts, but using this indicator you can do accurate manual back tests.
There's nothing plotted on the screen given that there's no real point in it, but you can make the lines appear if you wish - just go into settings and change the transparency.
The order of the numbers on the indicator match the OHLC (Open, High, Low, Close) format.
There's also settings to turn off one or more of the OHLC values, simply open the settings and go to Inputs. This could be useful for some people, as the High and Low values of HA candles are the same as regular candles. Only the Open and Close are different.
Any queries let me know.
DreamsDefined

兔子希双均线策略 EMA CROSSA single Indicator that has two EMA inputs (currently using 5, 13 for my crypto trading)

Dane - MA StudyThis strategy has been developed as a development service. It is published for customer acceptance and verification. As such, I am unable to provide access to anyone other than the paying customer. Sorry about that.
For those interested in development services, please check out the backtest-rookies (.com) website.
MA Study
This is a study version of the Dane - MA Strategy with few extra features:
Position Simulation - So we can synchronise with the strategy.
Alerts for Going Long, Short and exiting positions
Plotting entry/exit and close markers
Plotting dots at the bottom of the chart to show whether we are in a simulated long, short or flat state.

Dane - MA StrategyThis strategy has been developed as a development service. It is published for customer acceptance and verification. As such, I am unable to provide access to anyone other than the paying customer. Sorry about that.
For those interested in development services, please check out the backtest-rookies (.com) website.
MA Strategy
A Moving average crossover strategy using Heikin-ashi candles for confirmation. The strategy makes trading decisions based on Heikin-ashi data but trades on real candlestick charts to avoid incorrect backtest results.
The strategy includes optional plotting of HK candles on an overlay to help with strategy verification.

兔子希均线策略 ema strategy 2.0本策略是基于EMA10
用于平均K线图上(Heikin Ashi )
K线在ema10之上提示做多
K线在ema10之下提示做空
如果是看信号
日内交易者建议:
看1小时周期或者2小时周期多空信号出现之后
再到5分钟或者15分钟图小周期里找同向波段做单向单
用周期共振交易法提高胜算
本策略仅适用于抓取单边大波段行情
横盘震荡行情容易频繁止损
自行添加其他指标以过滤部分横盘震荡行情
This strategy is based on EMA10.
Use it on the Heikin Ashi
Crossing up ema10 prompt LONG
Crosing down prompt SHORT
If you look at the signal
Day traders suggest:
Look at the 1 hour cycle or the 2 hour cycle.
Then in 5 minutes or 15 minutes, find the same direction in the small cycle.
Using periodic resonance trading to improve odds
This strategy applies only to the single band market.
Sideways market is prone to frequent stops.
Add other indicators to filter partial market volatility.
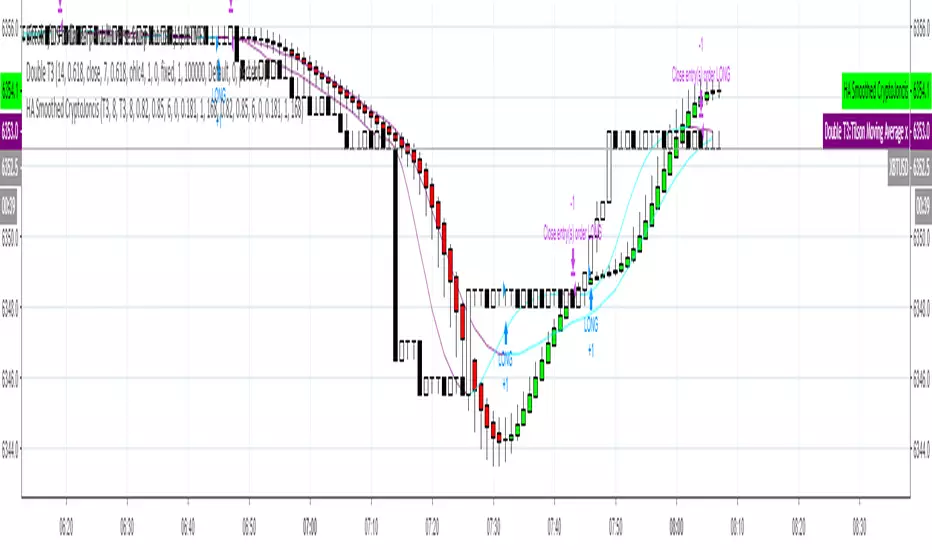
Heikin-Ashi Smoothed with option to change MA types CryptoJoncisPine Script version=3
Author CryptoJoncis
Heikin-Ashi Smoothed
The Heikin-Ashi Smoothed study is based upon the standard Heikin-Ashi study with additional moving average calculations. The following is the calculation formula for the bars:
1. The current bar Open, High, Low, Close values are smoothed individually by using the moving average type specified by the Moving Average Type 1 Input with a length/period specified by the Moving Average Period 1 Input.
2. The Heikin-Ashi bar Open, High, Low, Close values are set using the smoothed values from step 1. This is performed using the standard Heikin-Ashi formula.
3. The final Heikin-Ashi Open, High, Low, Close values are calculated by doing a second smoothing of the bar values from step 2 by using the moving average type specified by the Moving Average Type 2 Input with a length/period specified by the Moving Average Period 2 Input.
If you choose to tick the box where it offers to use only one smoothed HA then it skips the third/final step and you do not need to choose the second MA type for it to work.
Remember, using FRAMA, always make sure you use even number for length.
For simple Heikin-Ashi, please tick single smoothed and DEFAULT (Not smoothed as there are no MA used)
Heikin-Ashi bars are calculated:
1. Close = (Open + High + Low + Close) / 4
This is the average price of the current bar.
2. Open = (Open of Previous Bar + Close of Previous Bar) / 2
This is the midpoint of the previous bar.
3. High = Max of (High, Open, Close)
Highest value of the three.
4. Low = Min of (Low, Open, Close)
Lowest value of the three.
Any questions/suggestions/errors or spelling mistakes? Please leave a comment and let me know. I will try to fix it.
This took me few days to finish, so I hope you will find it useful.
Would you like to have more MA type choices? Please comment down with any other which aren't included in this indicator and I will research them and add.
MA included in this script:
Tillson Moving Average (T3)
Double Exponential Moving Average (DEMA)
Arnaud Legoux Moving Average (ALMA)
Least Squares Moving Average (LSMA)
Simple Moving Average (SMA)
Exponential Moving Average (EMA)
Weighted Moving Average (WMA)
Smoothed Moving Average (SMMA)
Triple Exponential Moving Average (TEMA)
Hull Moving Average (HMA)
Adaptive moving average (AMA)
Fractal Adaptive Moving Average (FAMA)
Variable Index Dynamic Average (VIDYA)
Triangular Moving Average (TRIMA)
You can use,publish,modify this code in any way as you wish, but only if you reference me after.
You are not allowed to sell it as it is.
If this code is useful to you, then consider to buy me a coffee (or better a pint of beer) by donating Bitcoin or Etherium to:
BTC: 3FiBnveHo3YW6DSiPEmoCFCyCnsrWS3JBR
ETH: 0xac290B4A721f5ef75b0971F1102e01E1942A4578
References:
www.sierrachart.com
www.investopedia.com
www.binarytribune.com
www.investopedia.com
www.stockfetcher.com
www.mql5.com
www.incrediblecharts.com
help.cqg.com
www.blastchart.com
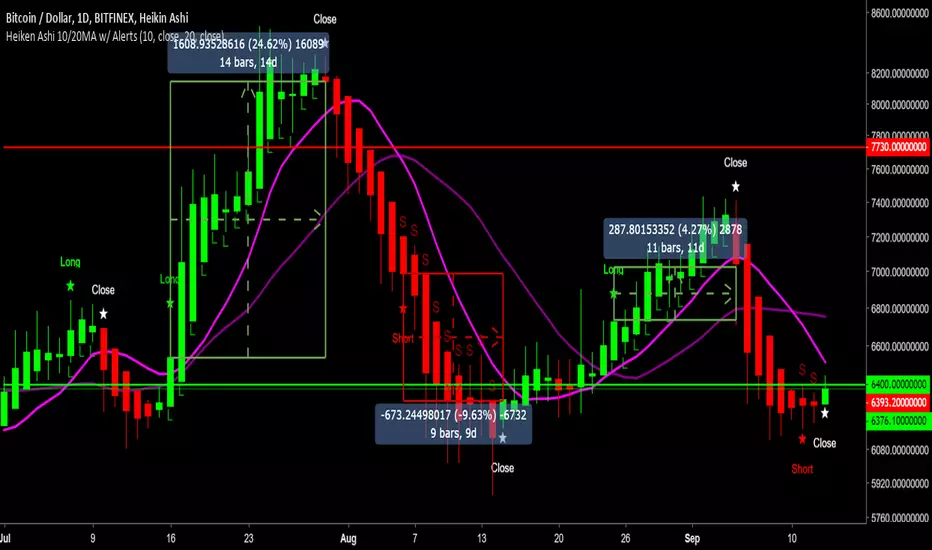
Heiken Ashi 10/20MA w/ Alerts v2.0Summary:
Using Heiken Ashi candles and default 10 and 20 Moving Averages for crossover signals to determine signals to go long, short and close trades.
How it works:
- Is the 10MA above the 20MA and a bullish candle? If yes, open a long.
- Will close the trade at the first bearish candle.
- Reverse this for going short.
- If you can't short, just close your long and hold till the next long signal.
Quite a conservative strategy, not for day trading. Comes into it's own in trending markets as long as you stick to the signals.
Alert messages:
- Long
- Short
- Close
Backtesting results:
XBTUSD = 85.9% (Bitmex)
LTCUSD = 75.6% (Bitfinex)
ETHUSD = 73.8% (Bitfinex)
NEOBTC = 83.9% (Binance)
TRXBTC = 79.4% (Binance)
EOSBTC = 88.1% (Binance)
Will need to be able to short altcoins to make the most of it, or at least will at least keep you out of sustained downtrends (=/= holding).
Backtest it on bitcoin and other large cap alts on high time frames to see for yourself. For lazy trading, can set up alerts with AutoView.
0.1ETH for lifetime access. Message for details and support.
Check out my other scripts.
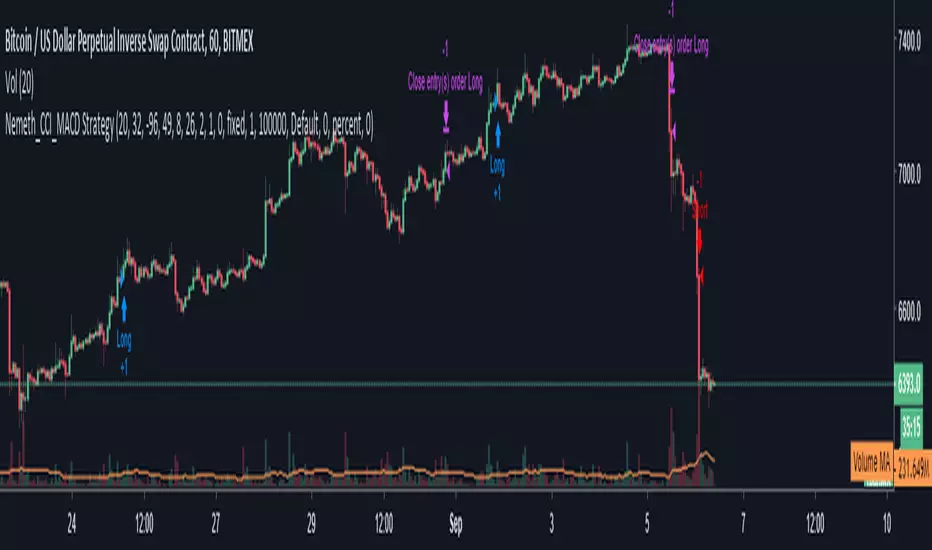
Nemeth CCI MACD StrategyBased on Joseph Nemeth trade system, applying Heikin Ashi and Renko charts. This strategy does not include the zone recovery approach