Ashi

Achmed: Heikinashi Open/CloseHeikinashi strategy that looks for large % changes between the open and close of a bar or the previous open and current close.
This strategy is published for customer verification and acceptance. As such, only the customer shall be granted access.
Features
Heikinashi based strategy that is run on a normal candle chart. This ensures accurate backtest results.
Heikinashi chart is plotted on a subplot
Inputs for defining different entry conditions
Switches to turn different entry criteria on / off
Trailing stop which trails the Heikinashi prices.
Trailing stop plotting on the subplot

mcbw_RSI_candlesAn RSI can have any input, but most commonly used is the closing price. I thought it would be interesting to see if feeding the open high low and close information into the RSI to make RSI candles, if there are candlestick formations that can be recognized or possible patters in wicks.
To make it smoother there also is the option to turn the RSI candles into Heiken Ashi form, just check the box labeled HA. The result is an RSI that is easier on the eyes.
Happy trading!
Remember to not take everything too seriously

Whales of bitmexThis script use :
ema
macd
heiken ashi candle
4 alert
Enter long
Enter short
Close Long
Close short
Msg me for test !

CB SDB HK VOL IndicatorIndicator version of designed for use with independent automation solution.
Custom development published for customer verification and acceptance.
If you are interested in development services, please visit the backtest-rookies website or message me to find out more.

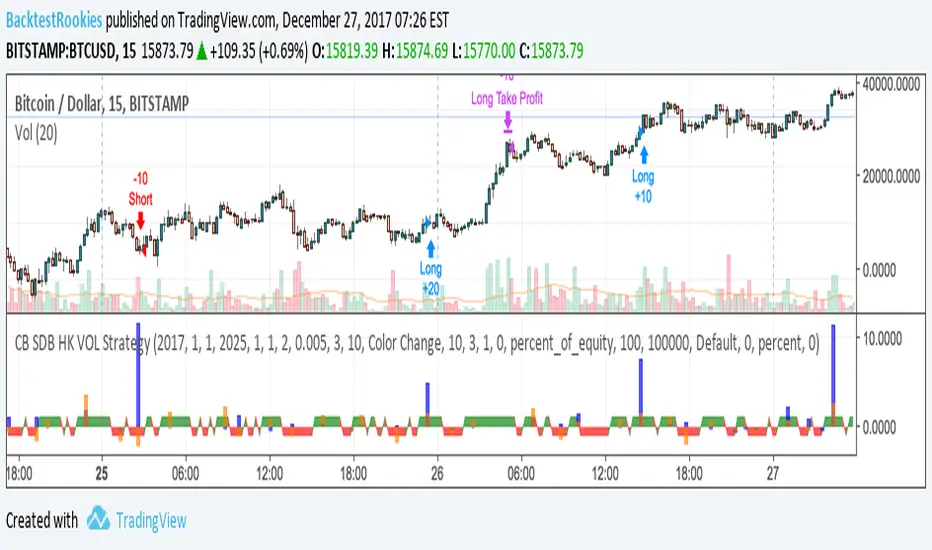
CB SDB HK VOL Strategy Heikin-Ashi / Volume Filter Strategy
Custom development published for customer verification.
If you are interested in development services, please visit the backtest-rookies website to find out more.
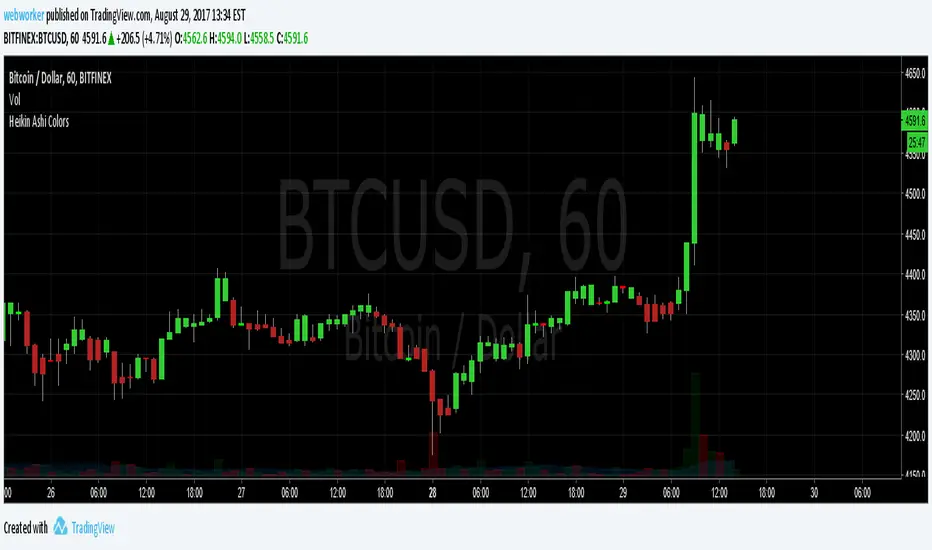
Heikin Ashi ColorsThis script simply changes the colors on your candle and hollow candle charts to Heikin Ashi style colors without changing the values of the bars.
Great for visualizing trends, but getting an accurate picture of prices!
Heiken Ashi Pivot Blue Candle over Regular CandlesThis mixes Heiken-Ashi with regular candles by adding blue candle to regular candles. A blue candle appears anywhere that you are going from red Heiken-Ashi to green Heiken-Ashi. Also, black candles appear anywhere that you are going from green Heiken-Ashi to red Heiken-Ashi.

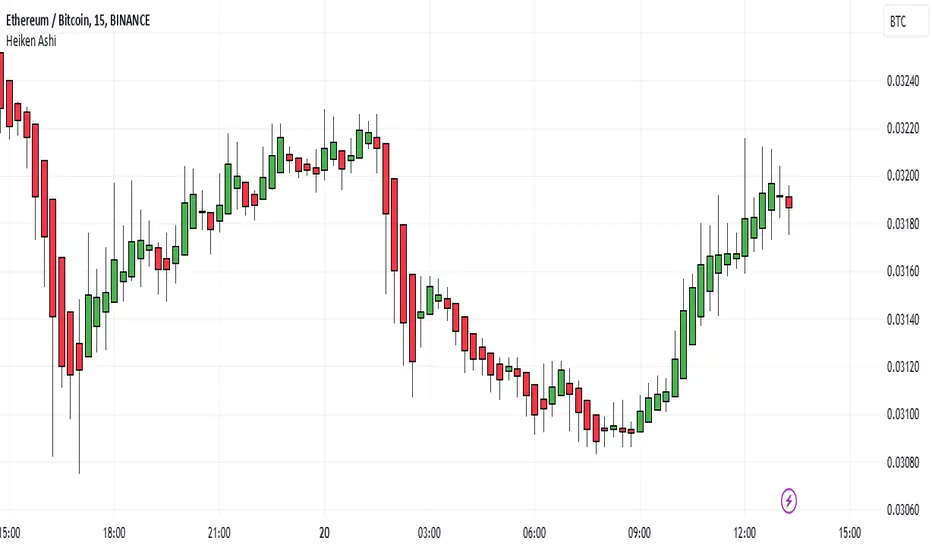
Heiken Ashi Candles
This is a script to place Heiken Ashi candles on your chart alongside another candle type or more importantly, using the variables from this script, you can build a strategy using Heiken Ashi candles that will depict true/proper entries and exits in a strategy when using the backtest feature.
We hope this helps!
Heiken Ashi zero lag EMA v1.1 by JustUncleLI originally wrote this script earlier this year for my own use. This released version is an updated version of my original idea based on more recent script ideas. As always with my Alert scripts please do not trade the CALL/PUT indicators blindly, always analyse each position carefully. Always test indicator in DEMO mode first to see if it profitable for your trading style.
DESCRIPTION:
This Alert indicator utilizes the Heiken Ashi with non lag EMA was a scalping and intraday trading system
that has been adapted also for trading with binary options high/low. There is also included
filtering on MACD direction and trend direction as indicated by two MA: smoothed MA(11) and EMA(89).
The the Heiken Ashi candles are great as price action trending indicator, they shows smooth strong
and clear price fluctuations.
Financial Markets: any.
Optimsed settings for 1 min, 5 min and 15 min Time Frame;
Expiry time for Binary options High/Low 3-6 candles.
Indicators used in calculations:
- Exponential moving average, period 89
- Smoothed moving average, period 11
- Non lag EMA, period 20
- MACD 2 colour (13,26,9)
Generate Alerts use the following Trading Rules
Heiken Ashi with non lag dot
Trade only in direction of the trend.
UP trend moving average 11 period is above Exponential moving average 89 period,
Doun trend moving average 11 period is below Exponential moving average 89 period,
CALL Arrow appears when:
Trend UP SMA11>EMA89 (optionally disabled),
Non lag MA blue dot and blue background.
Heike ashi green color.
MACD 2 Colour histogram green bars (optional disabled).
PUT Arrow appears when:
Trend UP SMA11

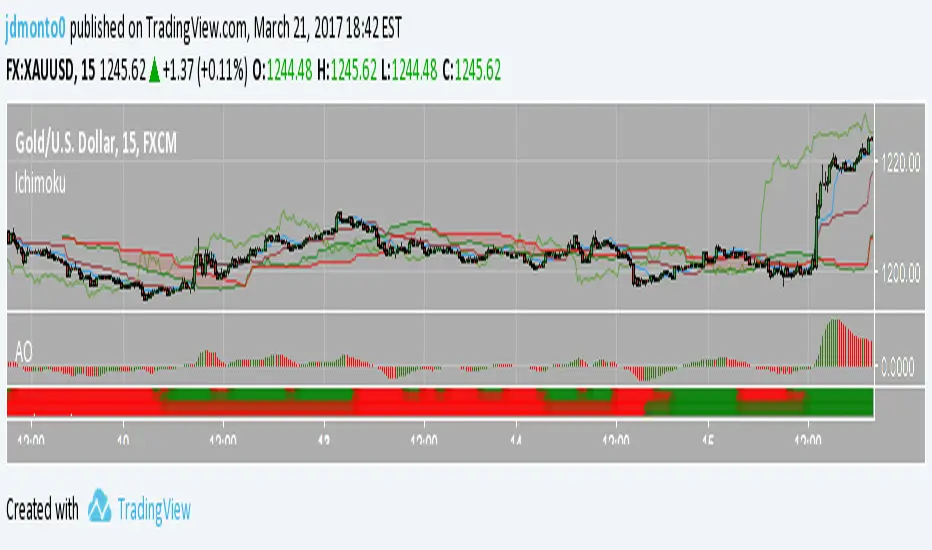
Price Action Doji Harami v0.2 by JustUncleLThis is an updated and final version of this indicator. This version distinguishes between the true Harami and the other Doji candlestick patterns as used with the Heikin Ashi candle charts. These candle patterns indicate a potential trend reversal or pullback.
The patterns identified are:
- Bearish Harami (Red Highlight above Bar):
One to three (default 3) large body Bull (green) candles followed by a small (red)
or no body candle (less than 0.5pip) with wicks top and bottom that are at least 60% of candle.
- Bullish Harami (Green Highlight below Bar):
One to three (default 3) large body Bear (red) candles followed by a small (green)
or no body candle (less than 0.5pip) with wicks top and bottom that are at least 60% of candle.
- Bearish Doji (Fuchsia Highlight above Bar):
One to three (default 3) large body Bull (green) candles followed by a small (green)
with wicks top and bottom that are at least 60% of candle.
- Bullish Doji (Aqua Highlight below Bar):
One to three (default 3) large body Bear (red) candles followed by a small (red)
with wicks top and bottom that are at least 60% of candle.
You can optionally specify how large the candles prior to Harami/Doji are in pips, default is 0 pip.
If you set this to zero then it will have no candle size consideration. You can also specify how many look back candles (1-3) are used in Harami/Doji calculations (default 3).
Included option to perform Calculations purely on Heikin Ashi candles, this helps when you want to see the HA Doji/Harami bars with the normal candle stick chart.
Also can optionally set an alert condition for when Harami/Doji found, this also displays a circle on the bottom of the screen when alert is triggered.

HEIKIN ASHI COLOUR CHANGE ALERTThis can be used to trigger an alert if Heikin Ashi bar changes color :)

I_Heikin Ashi CandleWhen apply a strategy to Heikin Ashi Candle chart (HA candle), the strategy will use the open/close/high/low values of the Heikin Ashi candle to calculate the Profit and Loss, hence also affecting the Percent Profitable, Profit Factor, etc., often resulting a unrealistic high Percent Profitable and Profit Factor, which is misleading. But if you want to use the HA candle's values to calculate your indicator / strategy, but pass the normal candle's open/close/high/low values to the strategy to calculate the Profit / Loss, you can do this:
1) set up the main chart to be a normal candle chart
2) use this indicator script to plot a secondary window with indicator looks exactly like a HA-chart
3) to use the HA-candle's open/close/high/low value to calculate whatever indicator you want (you may need to create a separate script if you want to plot this indicator in a separate indicator window)

Volume Price Spread Analysis 2With the same idea of the VPSA i make the VPSA2 to make Heiken Ashi style synthetic graph of the price and the volume effect, its easy to see the volume trends. Each instrument have a more clear time frame to see the volume patterns.
I see very useful like a secondary analysis layer. in the graph show the same RSI with price and VPSA2 like source.
Can use others indicators over the VPSA, only write in CAPITAL letters open, high, low, close or hl2 at inputs section.
Ideas, corrections & comments.
They are always welcome.

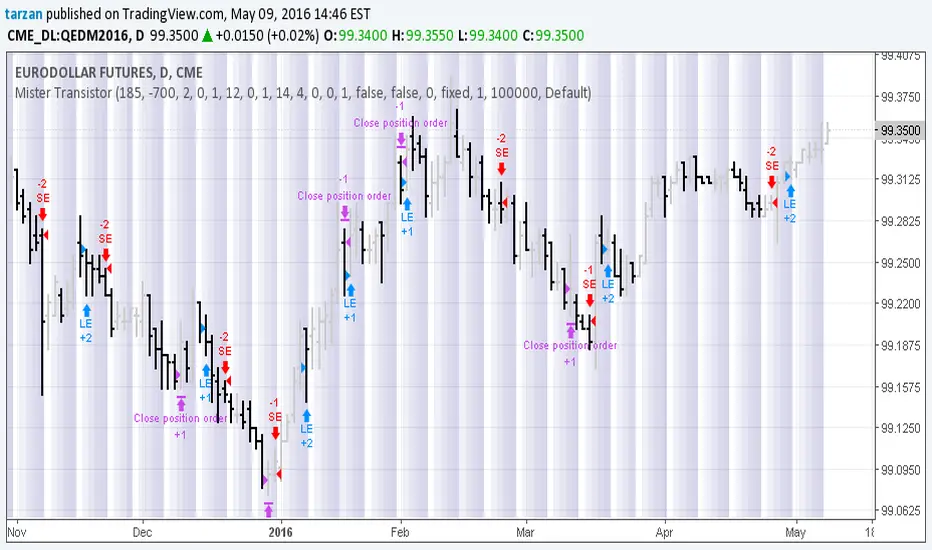
Mister Transistor 3.0This is a general purpose very flexible program to test the effectiveness of HA bars.
Please note that if you are charting at tradingview using Heikin-Ashi charting, your system will be trading fictitious prices even if you check the "use real prices" box. Thought you might like to know that before you lose all your money.
This program performs the HA calcs internally thus allowing you to use HA bars on a standard bar chart and obtaining real prices for your trades.
Courtesy of Boffin Hollow Lab
Author: Tarzan the Ape Man
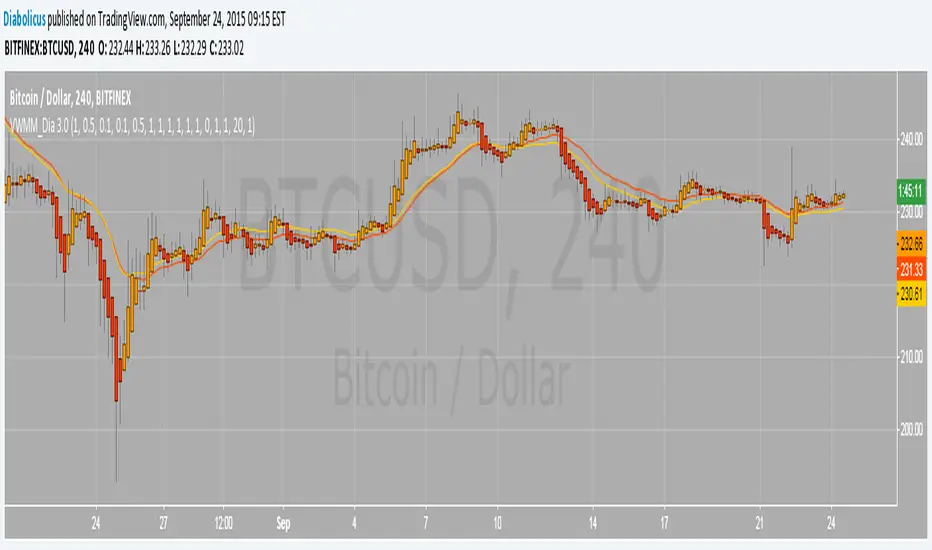
Volume Weighted Market Mean 3.0 [Dia]150924 - v3.0
This script is a complete rewrite of the previous version here .
It gathers market data from up to 8 different Bitcoin exchange pairs (8 is maximum due to script limitations).The influence of each single exchange can be customized individually, default is 50% for 0-fee exchanges, 10% for futures and 100% for all others. For each single exchange a standard deviation from the composite mean price and a average price range are determined. To make data from exchanges with different liquidity comparable, all single exchange price ranges are normalized to the range of the composite mean price. To make data from exchanges with different fee structure (= exchanges that constantly trade at a premium / discount) comparable, all single exchange prices are corrected by their respective standard deviations. To account for trade volume, all price data is weighted by the current candles volume.
- optional Heikin Ashi candle display
- optional EMAs
- lots of switches to play around with ;-)
CM Heikin-Ashi Candlesticks_V1Heikin-Ashi Paint Bars.
Paints Candlesticks or OHLC Bars The Exact Same as Traditional Heikin-Ashi Bars

CM_Modified_Heikin-Ashi_TrendBarsCreated By Request for lucalucious
Allows for EMA Smoothing with different values for Up and Down Trend.
Ability to Plot EMA to see Trend Filter
