Crypto Tipster Pro+ (Optimized for ETCUSD)===========
Crypto Tipster Pro+ Optimized for ETCUSD
===========
This script is a carbon-copy of our Crypto Tipster Pro Strategy , but also includes our Custom & Fully Optimized Settings for turbo-charging your Ethereum Classic (ETCUSD) trading.
-----------
We keep all our Crypto Tipster Pro+ (Optimized) strategies regularly updated and maintained. The purpose of these Add-On's to our Crypto Tipster Pro Strategy is to keep each trading plan relevant, up-to-date and most of all profitable within ever-changing markets.
We will always keep our main Crypto Tipster Strategy active, as we find the default settings are the best "all-rounder" set-up and work with many crypto pairs over many different time frames, try it for yourself! This Set-Up for Ethereum Classic enables you to hone in on one certain trading pair on the 'D' chart and maximize your overall trading experience.
-----------
Visit the link below for Full & Immediate Access!
Good Luck and Happy Trading!
Auto

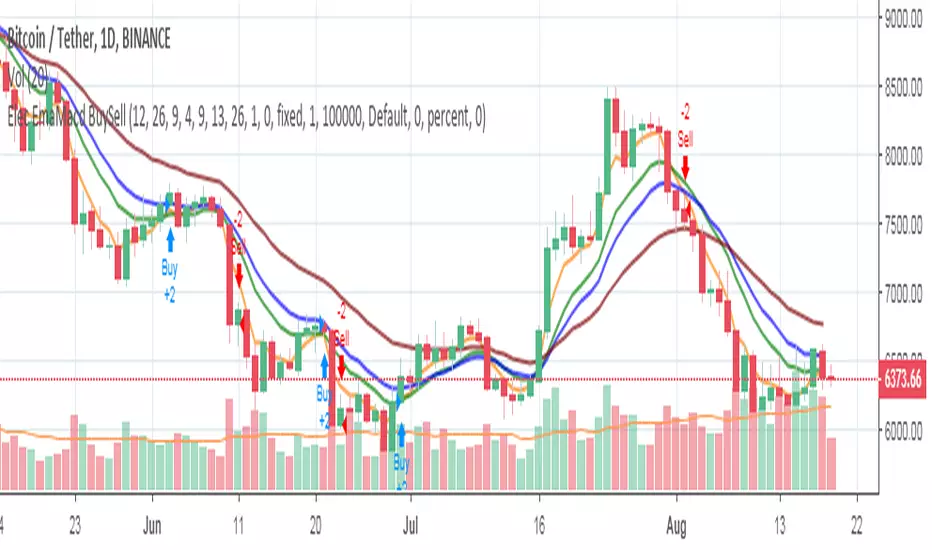
Crypto Tipster Pro+ (Optimized for BTCUSD)===========
Crypto Tipster Pro+ Optimized for BTCUSD
===========
This script is a carbon-copy of our Crypto Tipster Pro Strategy , but also includes our Custom & Fully Optimized Settings for turbo-charging your Bitcoin (BTCUSD) trading over the last 12 months.
-----------
We keep all our Crypto Tipster Pro+ (Optimized) strategies regularly updated and maintained. The purpose of these Add-On's to our Crypto Tipster Pro Strategy is to keep each trading plan relevant, up-to-date and most of all profitable within ever-changing markets.
We will always keep our main Crypto Tipster Strategy active, as the default settings are the best "all-rounder" set-up and work with many crypto pairs over many different time frames. This Set-Up for Bitcoin enables you to hone in on one certain trading pair on the D chart and maximize your overall net profit.
-----------
Visit the link below for Full & Immediate Access!
Good Luck and Happy Trading!

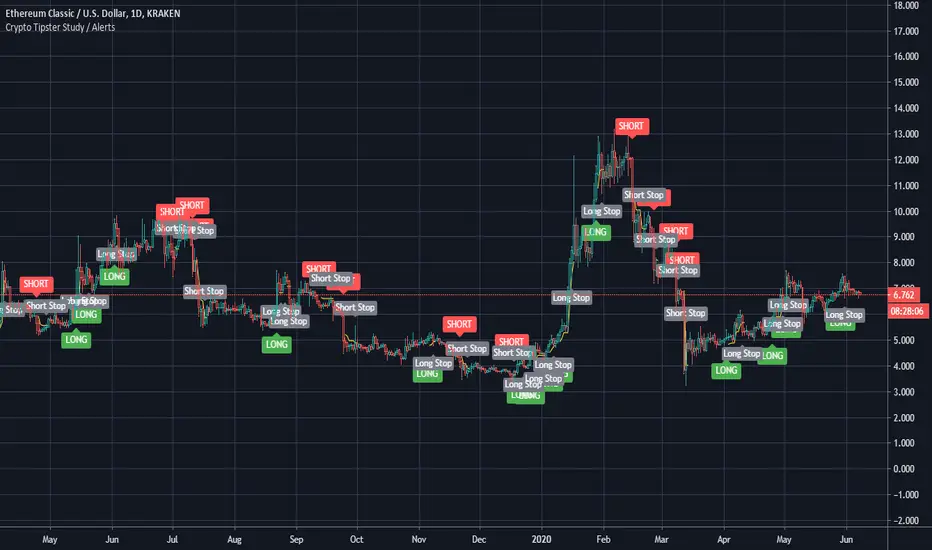
Crypto Tipster Study / Alerts -theCrypster===========
Crypto Tipster Study with Alerts
===========
Our Crypto Tipster Study with Alerts Script is a carbon copy of our tried and tested Crypto Tipster Pro Strategy , but now with the option of setting TradingView Alerts for your chosen trading plan. Making missing trades a thing of the past, and helping you to automate your own trading strategy.
-----------
Crypto Tipster Pro is a trading strategy with indicators based on Technical Analysis, Price Action and Momentum Swings for TradingView's charting platform.
We've compiled and continue to update a trading strategy that adapts to changes in the market; with custom indicator settings, fixed SL/TP, Trailing Stop, Safe Mode, Heikin Ashi Confirmation and more!
Our efforts have been focused towards the 1D time frame - using a larger time frame benefits most part-time or evening traders in multiple ways, catching bigger swings and earning a higher percentage per trade, the ability to reduce or remove any leverage associated with the trade, and only having to place a trade or move a stop loss ONCE per day ~ Meaning you are still able to go to work, tidy the house, play with the kids AND be a successful trader.
-----------
What's Included within Crypto Tipster Pro?
Crypto Tipster Pro comes with a host of features and is being continually updated, these features include (but are not limited to):
- Date Range Settings
Setting custom Start/End dates can help hone your strategy to suit the current times, or get a general overview of the market over the years.
- Heikin Ashi Confirmation
We added HA confirmation for both Entry & Exit of trades. This started as a form of "Safe Mode", we have since adapted this mode beyond Heikin Ashi; but kept this confirmation as an added extra.
- Variable Indicator Settings
As well as our Fixed Indicators and Price Action analysis going on in the background of the strategy, we've also included some Variable Indicators that you have access to edit.
Trend Detection Length for detecting trend! Higher numbers detect longer trends, but will inevitably make fewer trades and possibly miss the start of a new trend; a lower length will create more opportunities to trade but may get confused when ranging in choppy markets.
Range Short/Long Lengths are used for detecting percentage price movements over a given number of bars back. This enables you to effectively "zoom in" on market data and catch trends within trends.
- Safe Mode
Enabling Safe Mode will add a couple more confirmation indicators to the strategy - the aim of Safe Mode is, in essence, to remove any trading signals that would end of being false/bad moves. Usually resulting in less Overall Trades, a higher Net Profit, higher % Profitable, higher Profit Factor AND a lower Drawdown.
- Stop Loss/Take Profit Settings
This is where Crypto Tipster Pro really proves itself, Money Management. We have an editable Fixed SL/TP, as well as Trailing Stops for Long or Short orders, all of which you can use on their own, or combined with each other. Playing with these settings can turn an un-profitable system into a very-profitable system!
- Custom Stop Loss Indicator
This is a little extra indicator that we have found very useful over the years of trading markets, a custom Stop Loss Indicator. Simply turn it on, enter the price you want to calculate from, tick Long or Short, enter a % movement and watch as your new stop loss level is plotted on the chart. This is especially useful for when the strategy doesn't marry up with the prices you've actually obtained (for better or for worse!)
-----------
What's Included within Crypto Tipster Study / Alerts Script?
Our Study script will find Entry and Exit points exactly as our Pro Strategy would find them. The same indicators, methods and chart reading techniques are used, there are 2 big differences however...
The first difference is that our Pro Strategy has the ability to manage your money, Fixed Stops, Take Profit and Trailing Stops to name just a few. Our Study does not (and cannot) have these functions added due to the way TradingView's charting platform operates.
That's the bad news, the good news for our Crypto Tipster Study Script is that you can add Alerts to your trading plan! This is super handy if you decide to implement our methods into various time frames other than 1D and are looking for Intra-day alerts, or if you're looking to Automate your trading strategy using external software.
Help and Advice for setting up Alerts or to Automate your Strategy can be found on our website.
----------
For more information on the Crypto Tipster Pro Strategy visit the link in our signature.
Good Luck and Happy Trading!
Rounded Bluebox Zones - Bitcoin BeatsThis script is a combination of my Rounded Pitchforks script and an automatic support and resistance detector.
The goal of this script is to give the future supports and resistances in order to help guide your entries and exits in trades.
Both the curved and straight blueboxes indicate areas of confluence.
This means putting stoplosses and take profits in these areas can be a valid strategy.
This can be used on all timeframes.
ALL LINES AND BOXES CAN BE REMOVED IN THE SETTINGS.
So if you only want the curved pitchforks or only want to show a specific range, you can do as you wish.
For assets different from BTC, you will have to adjust the fully customisable settings.
TRADE AT YOUR OWN RISK

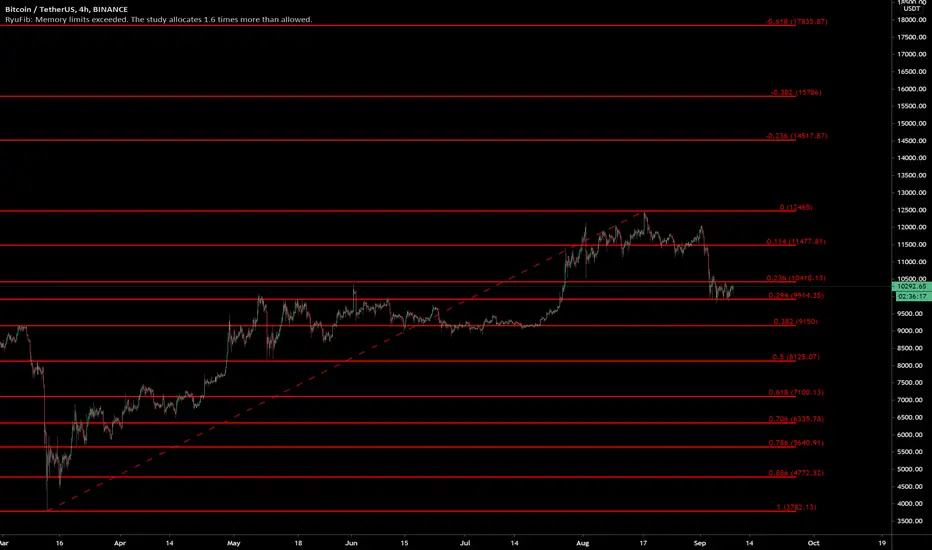
RyuFib🔰 Auto Fibonacci Retracement
New look, features, and improvements from the previous auto Fibonacci indicator. Now looks like the Fib Retracement Tool that you can draw and with all of it's settings options. This indicator will automatically draw all the Fibonacci levels onto the chart and update for each timeframe and adjust saving you time. By default the length is long so it will show the major levels, however, can be adjusted to any custom length or shorter length to select various retracements. An improvement to the indicator in the update is that now it will auto update and adjust to fit the history length. The previous custom timeframe option has been removed, since you can select any length for retracement anyways and is not needed. Lines that go further back in history that are not shown in the chart view are not loaded to prevent loading lines not in view, this done by TradingView. So if the length is long the lines do not appear unless you scroll back further in history to the start point in time of the retracement history. To prevent this, by default the lines are extended to the left so you don't have to scroll back for them to show, but you can still turn off the extend if you choose. Another update improvement is that it will now auto detect and adjust the Fibonacci retracement type, i.e, from high to low or low to high with the appropriate levels, with the option to reverse like the tool gives. Now also shows the trend line which shows the points used from the retracement from the high and low, which can also be turned on/off. Additionally, another improvement now the Fibonacci price levels are shown along with the levels.
This indicator shows all of the common default Fibonacci levels as well as my own added fib levels for the default levels, with the default extension levels, and added custom levels. By default there 9 of the common and my added Fibonacci levels displayed, plus the 2 for the high and low, so 11 levels, plus default 3 extension levels and 3 reverse extension levels, and 18 additional custom Fibonacci levels that are hidden and can be turned on and adjusted. So there are 35 total Fibonacci levels with the levels and price labels. All of the Fibonacci levels can be customized and adjusted in the settings with an input and can be turned on/off to be shown or hidden.
You don't need to do anything, simply load the indicator and it will auto adjust the appropriate length if needed, retracement type, and display the Fibonacci levels for each timeframe and update. However, you can still change the custom Fibonacci settings and style settings as you choose.
📌 Note: New update and redesign updated to new version pine script v4. This is published as a new indicator since it is now completely different redesigned with updates and improvements, and since the description was too long to fit in an update. This older Auto Fibonacci indicator is no longer used and updated by this one.
📌The following are the custom settings options of the user interface:
📌 For the plots display options:
Can show/hide all Fibonacci levels with a single master control switch
Can turn on/off the default Fibonacci extension levels
Can turn on/off the default Fibonacci reverse extension levels
Can show/hide all Fibonacci levels labels
Can show/hide all Fibonacci price labels
Can show/hide the Fibonacci trend line
📌 Fibonacci retracement settings:
Can adjust each Fibonacci level custom input
Reverse option to reverse the levels retracement type and levels
Can select the Fibonacci length max bars back, which will also auto adjust if needed if too long
Option to select the candle type for the retracement to use wick or candle close, default uses wick
📌 Fibonacci custom style settings:
The style settings updates for all 35 Fibonacci levels so you don't have to do individually
Can adjust all of the colors to your preference, default red since works for both black/white backgrounds
Adjusting the color will adjust all of the colors for the levels line, levels label, and price label
Can adjust the lines to solid, dashed, or dotted as preferred
Can extend lines to the left, right, or both, or turn off, default extended left
Can change the levels labels to display as levels or percents, i.e, 0.618 or 61.8%
Can adjust the width of the Fibonacci lines
Can adjust the size of the Fibonacci levels and price text labels
Can adjust the offset to shift the levels and price text labels
📌 Example on Bitcoin currently on the 1h showning Fibonacci levels being respected.
📌 Another example with BTC on the 15m showing price ping pong between Fibonacci levels; and with different settings with white color and levels shown as percents option.
📌 Here is Bitcoin again on the 1D timeframe with just default settings. Based on the history the indicator automatically selected the appropriate length and shows the high and low point and drew the levels. We can see the major Fibonacci levels being respected and with the extension levels can see the further future potential resistances.
RSI/DIV/Trend Lines [Anan]Hello Friends,,
This is the RSI indicator with (H/R) Divergence with Auto Trend Lines Drawer..

Auto Trend Channel [Anan]Hello Friends..
This is Auto Trend Channel using linear regression ,,
So helpful and smart !
Play with the options to adjust the precision.
*Note that the selected time frame in options must be > your current time frame (logic) to draw lines.

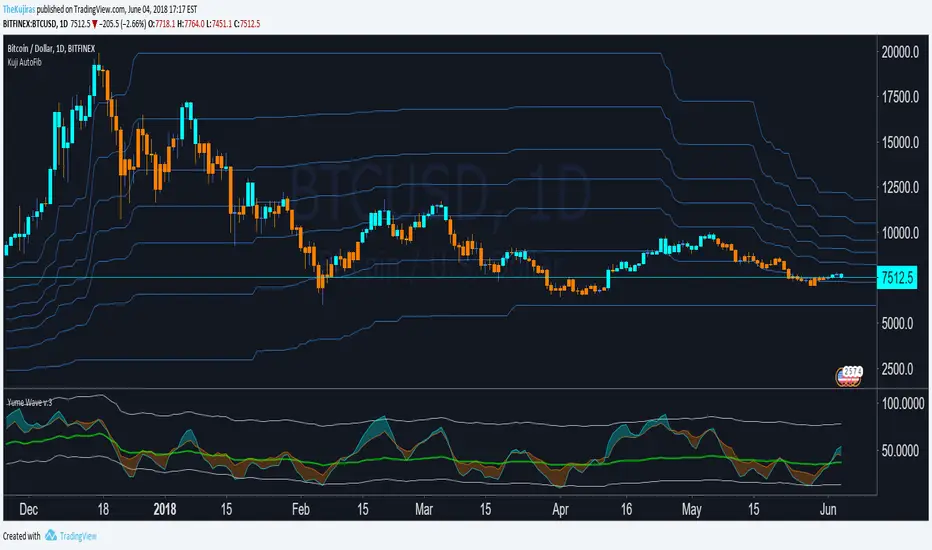
Auto Fibonacci Retracement Levels A Fibonacci retracement is a popular tool that traders can use to identify support and resistance levels, and place stop-loss orders or target prices.
The indicator connects any two points that are relevant, a high and low point.
The percentage levels provided are areas where the price could stall or reverse.
Levels should not be relied on exclusively. For example, it is dangerous to assume the price will reverse after hitting a specific Fibonacci level. It may, but it also may not.
Fibonacci retracement levels are most frequently used to provide potential areas of interest. If a trader wants to buy, they watch for the price to stall at a Fibonacci level and then bounce off that level before buying.
The most commonly used ratios include 23.6%, 38.2%, 50%, 61.8% and 78.6%. These represent how much of a prior move the price has corrected or retraced.

Assassin Multi StochrsiAuto change timeframe stochrsi.
1h with 4h
45m with 3h
3h with 8h
1d with 1 week
5and 15m with 1h and 4h.
auto change with timeframe

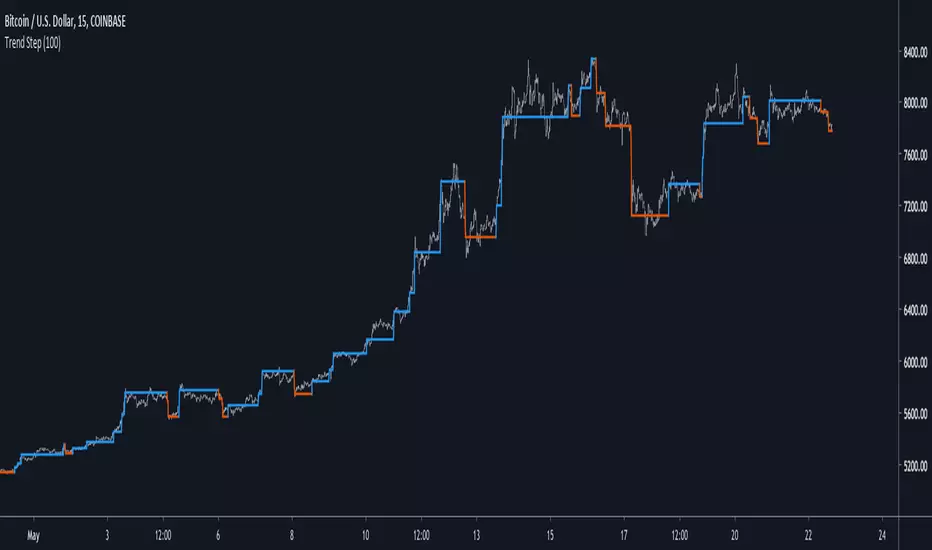
Trend StepJust a modification of my old auto-line script, lot of errors fixed and a correction in the standard deviation. Also changed the tittle because "auto-line" was really confusing.
Auto Anchored VWAP by Perigraph highAuto Anchored VWAP for High points
High point threshold included


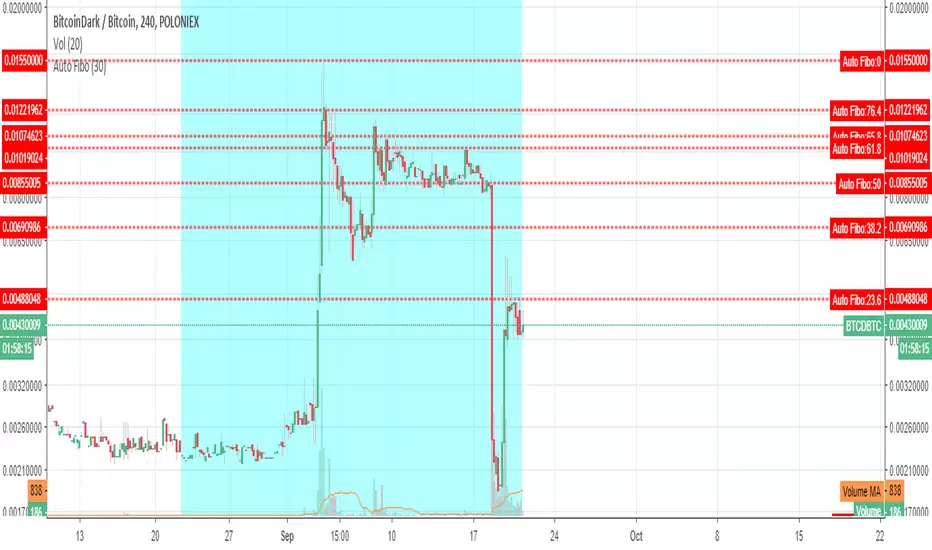
Basecamp AutoFibAutomatic Fibonacci Support and Resistance derived from the recent Average True Range.
This tool is used as a guideline for where mathematically evident support and resistances are estimated to be.
Unlike typical methods, this will adjust as candles print and the ATR expands or contracts assisting the user in ensuring realistic price targets relative to the current movement.

Efficient Auto LineMore Efficiency
Based on the Auto-Line code, the Efficient Auto Line aim to provide a more controlled adaptivity of the indicator. The first indicator of this sort worked this way : when the absolute difference between the price and the indicator is higher than the previous indicator +/- A pips of amplitude, the indicator will display the closing price, else its anterior value. The second indicator (Auto-Line) was adaptive and used the standard deviation instead of a constant A . This indicator will run both methodology providing both a trend strength indicator (Efficiency Ratio) parameter and two constant parameter.
Parameters
The length parameter will control the period of the efficiency ratio, a high period return lower values of the efficiency ratio. Since its an indicator in a range of (0,1) we use it to make our indicator more adaptive in trending market, this is when we need our two constant parameters, the fast/slow parameter can be any amount of pips where fast < slow , when the price is trending (efficiency ratio close to 1) the indicator will use the fast parameter, if its ranging (efficiency ratio away from 1) the indicator will use the slow parameter, then it will work like the first methodology previously explained. So the fast parameter should be equal to a small movement of pips (0.0001 or 1 pip) and the slow parameter should be equal to a number of pips you wont expect to see in a ranging market. At this point it is good to test for both parameter and see which values work better (a more automatic process is in development) .
Hope you like it !

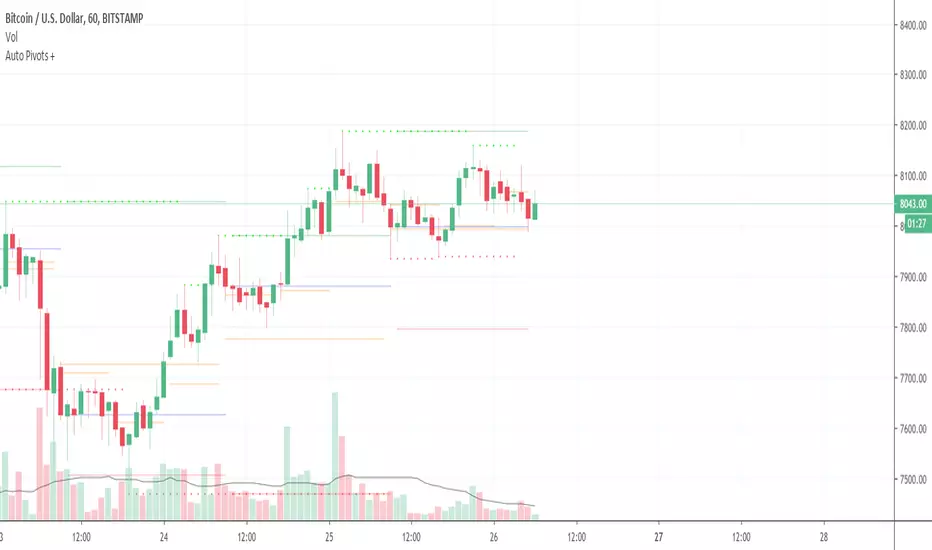
Auto Pivot PointsThis indicator plots a Pivot Point and 3 Support and Resistance lines that automatically adapt to the Timeframe
These can also be plotted against a Custom Timeframe
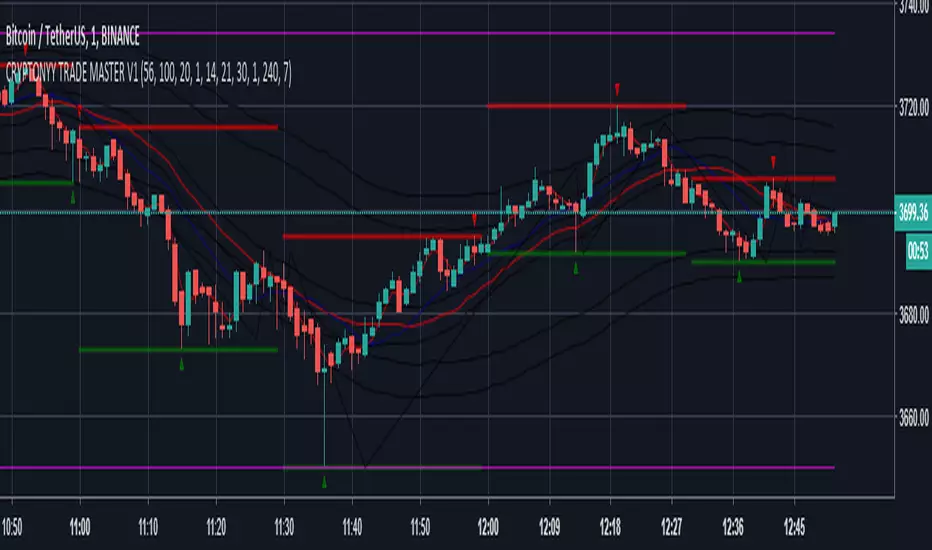
CRYPTONYY TRADE MASTER V1THIS SCRIPT IS ONLY MADE FOR BITMEX TRADERS.
IT WORKS ON 1MINUTE TIMEFRAME SMOOTHLY.
ADVANTAGES:
1. AUTO BUY/SELL SIGNALS.
2. 95% ACCURACY.
3. U WILL NEVER BE IN LOSS BECAUSE WE DEVELOPED THIS WITH OUR PERSONAL VOLATILITY INDICATOR.SO IF MARKET GOES OPPOSITE IT WILL GIVE U THE SIGNAL BEFORE YOUR LAST ENTRY PRICE.
4. DOUBLE CROSS INDICATOR.
5. MUCH VOLATILE=INCREASE THE SIGNAL ACCURACY.
6. 1MINUTE TIMEFRAME IS BEST TO TRADE WITH THIS SOFTWARE.
THOSE WHO WANT TO BUY THIS OR WANT DEMO COMMENT BELOW,I WILL MESSAGE YOU.
CRYPTONYY TRADING MACHINEThia script will automatically gives you long and short signals.
WORKS ON ALL EXCHANGE.
SUITABLE FOR BITMEX TRADING.
FOR ALTCOINS TRADING GO FOR 30MIN OR ABOVE 30MIN TIMEFRAME.
AUTOMATIC STOP LOSS TRIGGER.
MORE NEW UPDATES COMING!!!

Auto-Line With DriftA variation on the Auto-Line indicator, we allow it to get closer to the price thanks to a drift , this also allow the line to be more directional .
This indicator can be used with moving averages using crosses as signals or as a band indicator by ploting a + dev as the upper band and a - dev as the lower one.
For any help or suggestions feel free to send a message :)

Missile RSI (RSI of momentum w/ Dominant Cycle length + Fisher)This is a predictive indicator that looks for explosions in momentum of the cycles in price and large shifts in Momentum (Fisher turns the Bimodal PDF into Guassian like) as statistically unlikely events, showing points to exit or reverse positions.
You can adjust the lowpass frequency cuttoff (Aka what cycles you want to remove from the calculations through the super smoother filter).
To be honest you can monkey trade the direction of the Signal if you'd like but the Divergences and Maxing of the values is whats most useful.
Let me know if you guys want me to add anything else.

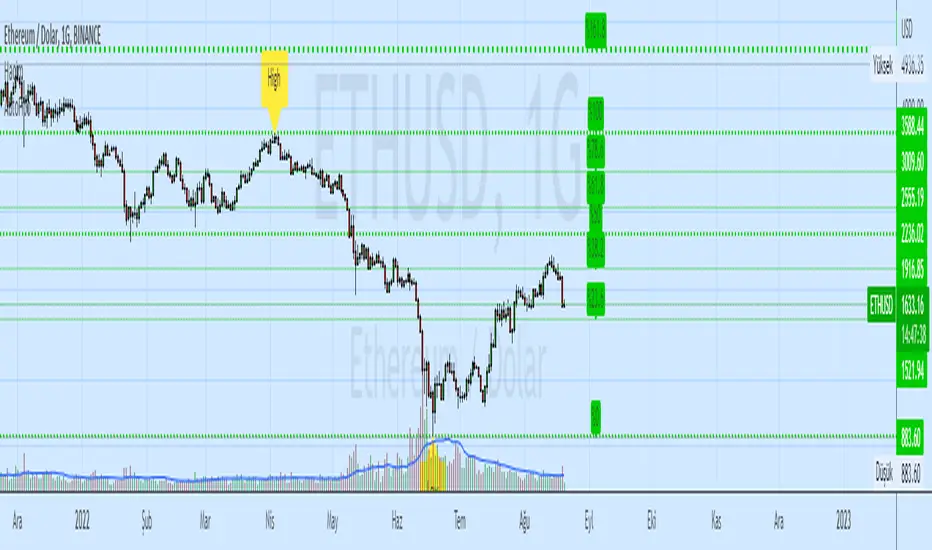
Auto Fibonacci Retracament Levels by evhar002This indicator/tool (Auto Fibo) draws Fibonacci Retracement Levels automatically on chart.
The algorithm of the Indicator Plots the extreme points and puts the retracement levels in order by itself with 100% sensitivity.
The key point is that to arrange the length of the "Days Back" to arrange the correct extreme points.
Like the other auto plotting tools, the levels can change when the time frame of the chart changes, in contrast with manually drawn Fibo levels.
In technical analysis , a Fibonacci retracement is created by taking two extreme points (usually a major peak and trough) on a stock chart and dividing the vertical distance by the key Fibonacci ratios of 23.6%, 38.2%, 50%, 61.8% and 100%.
Description copied from tr.tradingview.com and updated according to this script content.
Here's the link to a complete list of all my published indicators:
www.tradingview.com