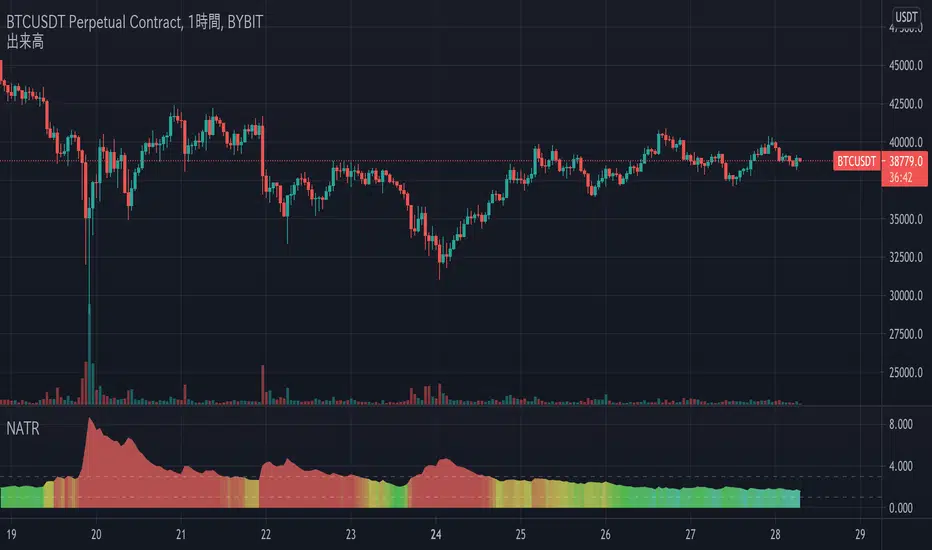
tr_volThis indicator shows the annualized volatility, computed using the ewma method. It also uses average true range (ATR) as the daily return, rather than the typical close-to-close percentage change. You can uncomment the "comparison" series to see how it compares to the standard deviation, daily log return method. The standard deviation method weights all periods equally and doesn't account for intra-day ranges, meaning it is less responsive to new information than the ewma method and doesn't weight large intra-day moves as heavily.
The long-run median is also displayed. This feature sometimes fails if there are too many bars.
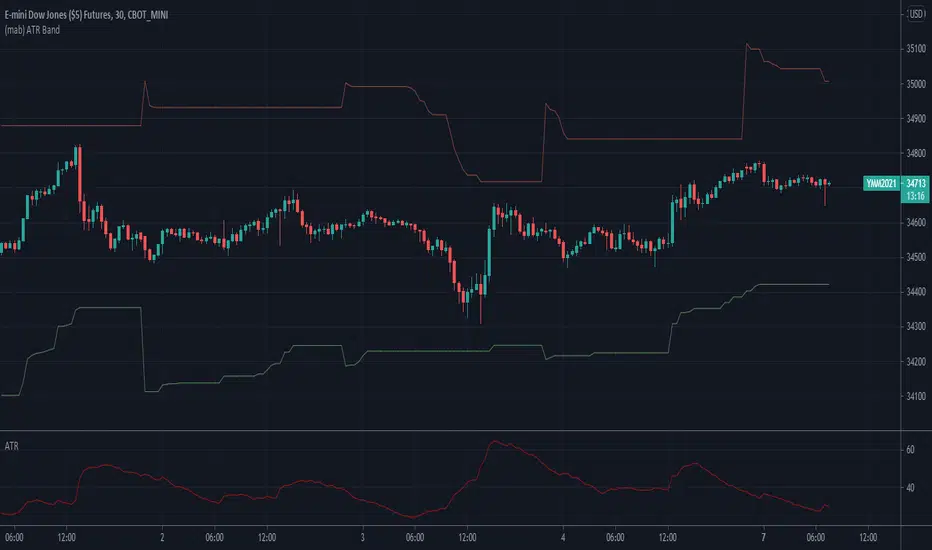
Average True Range (ATR)

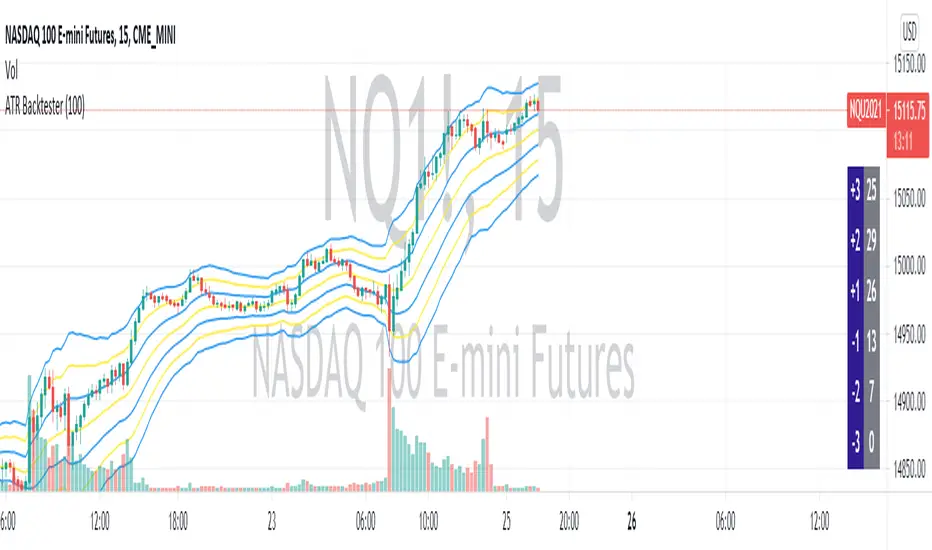
ATR BacktesterATR backtester... input the desired number of bars backwards (I'd recommend 100 or so), and then it'll spit out in the columns on the right side of the screen how many times each ATR was hit. Helps to tell at a glance where bullish and bearish is for the stock. May not be insanely useful since you can just look at the chart, but feel free to use the code yourself for something.
ZigZag SupertrendBack to my favourite supertrend. But, this time on the basis of zigzag pivots.
This is similar to forming supertrend based on pivot high lows - but instead of using pivot poitns, we are using zigzag pivots here.
Zigzag is derived using the same method as this script:
But, have removed labels and display options of zigzag. Older lines are also immediately deleted so that it can work well in lower timeframes without any error. Number of zigzaglines to be kept in memory depends on the parameter History
WaitForConfirmation option when selected only considers the confirmed zigzaglines and will ignore present zigzag line which is forming. This is not going to make much difference as the present zigzag line will be always opposite to low or high it formed and hence will not affect the stop loss levels or reversals.
WaitForClose is for supertrend determination. When checked uses close prices. If unchecked uses highs and lows for supertrend direction update.
ATR parameters allow you to set an adjustment below pivot high lows. This is required because support and resistence are often zones rather than single point. Hence, adds bit more wiggle room for trend continuation and delays frequent reversals on pullbacks.

SD - Average True Range v5 - DoubleSD - Average True Range - Daily Weekly Monthly Yearly v5
It gives ATR intervals as 4 hours, daily, weekly, monthly and yearly. The expectation is to fill the ATR targets within the specified ranges. It can be used to determine target points on charts with a clear direction on the train.
Unlike the previous version, it is provided to use 2 different periods in the same indicator.
Note: Developed based on the source codes of the original SD ADR indicator.

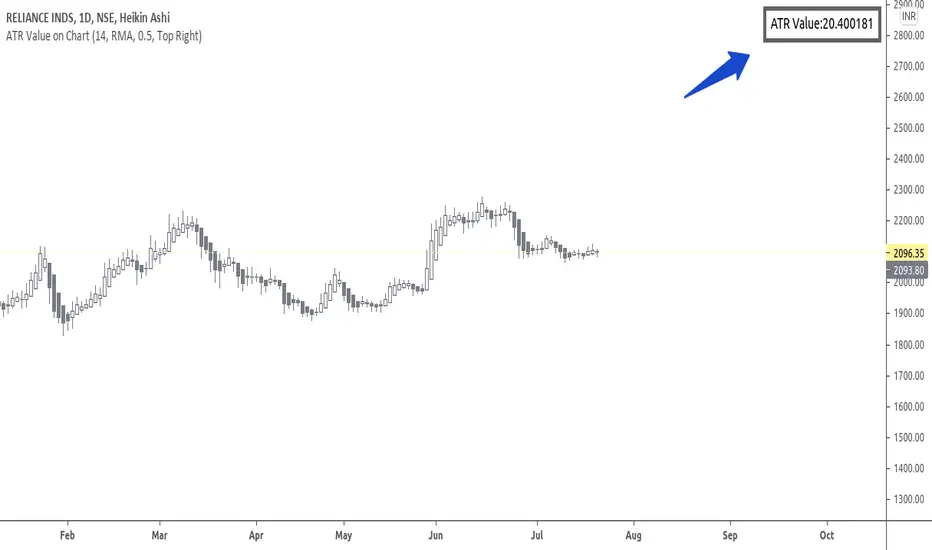
ATR Value on ChartHi Friends & TradingView community.
Greetings to you.
Many traders use ATR to set Stop loss.
The built in ATR indicator plots the ATR values as a line. However, many traders do not want the ATR to be plotted on their charts, but are only interested in the ATR value as such.
This script does that - it just prints the latest ATR with your set Multiplier value on the chart. I have used the built-in ATR indicator and made necessary additions to the code.
I hope this script proves useful to traders.
Queries / feedback welcome.
All the best.
Volatility semaphore Support&Resistance multi timeframe [LM]Hello Traders,
I would like to introduce you volatility semaphore support&resistance levels. The idea is the same as the pivot
semaphore script of mine to spot the importance of support&resistence.
It is little bit different than previous script as it uses different line API than previous volatility support& resistance multi timeframe . You have more control over hat and how many lines are rendered(better to use odd numbers in line count setting as it always finds 2 S/R lines). Also this indicator has setup for contol whether you want wicky candles or no by setting percentage of candle body that is accepted.
I hope you will enjoy it.

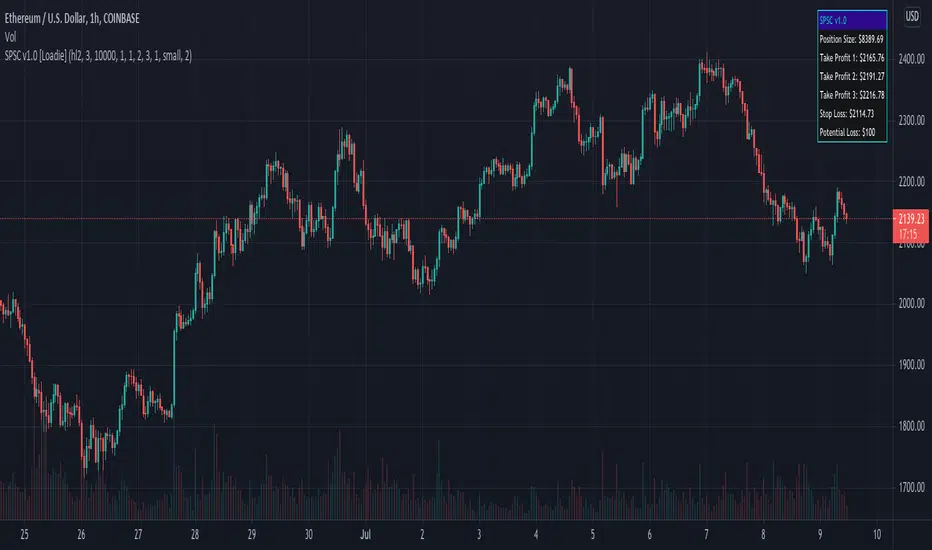
SPSC v1.0SPSC
What is this?
SPSC, or Simple Position Size Calculator, is a tool designed to help with long entries and risk management. You can set 3 separate take profit levels, your stop loss, and desired risk percentage of your overall capital. There is also an option to plot historical take profit and stop loss levels.
GLHF! - NFA!
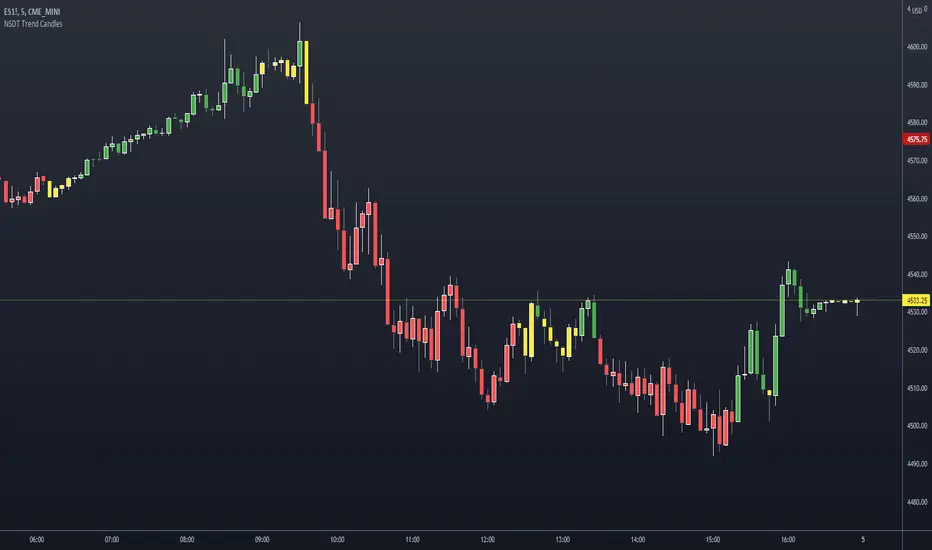
NSDT Trend CandlesThis script changes the color of the candles based on uptrend (green), downtrend (red), neutral/chop (yellow). It uses an ATR and Pivots to determine the direction, or lack of. Since all markets move differently and market volatility changes, you will need to adjust the settings to find a potential match for the day. It's pretty simple to use. Just enter in the direction of the trend and exit (or reverse) when the candle color changes.
Average Daily Range TableThis is the last script to complete Vladimir Poltoratskiy's setup found in his books.
Poltoratskiy argues that you should not take any fractal corridors higher than 50% of the Average Daily Range. To be honest, even 40% is a lot, because then, your target will be 160% ADR away from your entry and one "fracture" just can't be enough to predict moves this big.
I chose a table to visually represent the indicator because it doesn't change its value during the day. It takes far less room on the chart.
There are also two simple moving averages. You may use the as an indicator if the relative volatility as of late is extremely low and in that case, perhaps, expect an increase in the coming days. They are applied to the Average Daily Range, not one day range!

ATR Stop Loss FinderThis Indicator uses Average True Range (ATR) to determine a safe place to put stop losses to avoid being stop hunted or stopped out of a trade due to a tight stop loss. Default multiplier setting is 1.5. For a more conservative stop loss use 2 and for a tighter stop loss use 1. ATR and stop loss prices are displayed in table at bottom of screen. Use high(red) for shorts and low(teal) for longs.

ATR SLHi traders,
As you know, ATR trailing stop is very popular indicator. So I decided to make my own one.
The logic is simple.
If the price is above the RMA(src,len), then put a SL at OPEN - ATR value of that time period
otherwise, put a SL at OPEN + ATR value of that time period.
Stay safe ^^

ADR% / ATR / LoD dist. TableDisplays the following values in a table in the upper right corner of the chart:
ADR%: Average daily range (in percent).
ATR: Average true range (hidden by default).
LoD dist.: Distance of current price to low of the day as a percentage of ATR.
All values are calculated based on daily bars, no matter what time frame you are currently viewing. Doesn't work for time frames >1D, which is why the table is not shown on weekly/monthly charts.
Credit to MikeC / TheScrutiniser and GlinckEastwoot for ADR% formula

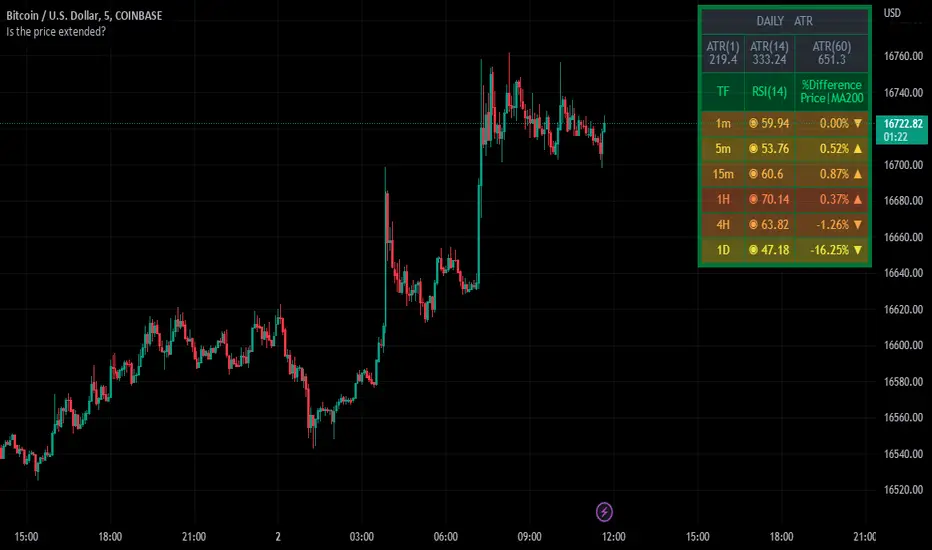
Table Identifies the Price Extensively Using RSI, MA, and ATR ⬤ INDICATOR KEY
⬤ INTRODUCTION
The indicator has presented as a table to show the perspective result of different indicators to help the user identify the status of the price if it’s extended or not. The table starts with the ATR section, which gives out a better look to compare the current day’s candle wide versus the average candle wide of a certain length of period that selected by the user. The second section of the table, showing RSI values at the most common upper timeframes, and the different percentages between the current price and long-term moving average entered by the user.
⬤ INDICATOR OVERVIEW
⬤ FINAL COMMENTS
▸This’s not a trading signal, but it helps to make a trading decision whether to set targets, stop loss, and enter a new trade.
▸If you found this content useful, please consider supporting presented indicators projects through PayPal which mentioned in the signature box, below.
▸ Trade Safe✌️.
⬤ OTHER GREAT INDICATORS CREATED BY MUQWISHI
📈 Muqwishi Volumetric Candle
📈 Support and Resistance For Day Trader | By MUQWISHI
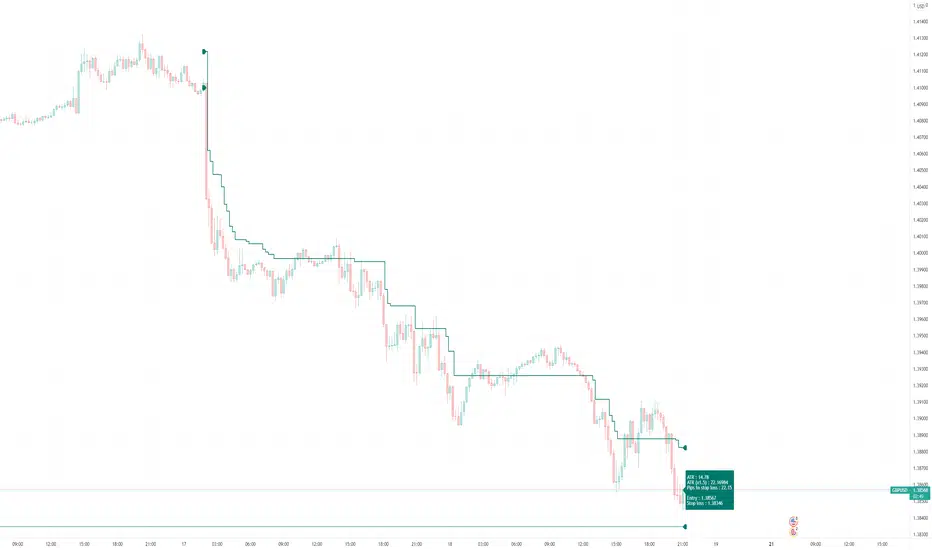
Stop Loss IndicatorThe stop loss indicator is a single trade indicator to manage risk
It tells you the size of the trade you should enter and lets you know where to place stops and when and where to trail your stops to based on ATR, given your entry price and risk amount.
Set the date and time once trade is active and once ATR moves above(long)/below(short) entry price you can move your stop loss following the green triangles.
Short
green triangle down => high + (ATR * 1.5)
red triangle up => low + (ATR * 1.5)
Long
green triangle up => low - (ATR * 1.5)
red triangle down => high - (ATR * 1.5)
TREX
TREX or TPA indicator by SOTTI
// The basic version and start of this indicator was set by my good friend Mr Shayan Karimi and we have room to learn from him and this text is here to make this happen.
//This indicator is taken from Master Saeed khakestar indicator
//Trigger price action -- True Range Exchange -- TPA - TRex
how to use this indicator:
this indicator for price action system and use full for student of master saeed khakestar
you can use tp1 for stop loss and tp3,7,15 for target you finde a flag limit on this area and set your tp or target
and use th or tr for price how much can be run and live use for price how much runned
TP1 = ATR time
PI.SL = TP1 + ENG.sl = pivot stop loss
ENG.sl = 0.25* TP1 = triger price actions stop loss
TP3 = 3*TP1
TP7 = 7*TP1
TP15 = 15*TP1
TH -> tavan harkati
TR -> True range average
LIVE -> live range candel
TP1 = توان حرکتی تایم که در ان هستیم
PI.SL = توان حرکتی تایم + میزانی که از نفوذ هار در امان باشیم
ENG.sl = یک چهارم ای تی ار تایم
TP3 =سه برابر تارگت اول
TP7 = هفت برابر تارگت اول
TP15 = پانزده برابر تارگت اول
TH -> توان حرکتی
TR -> میانگین توان حرکتی
LIVE -> میران حرکت کندل لایو
TH.long = گام بلند حرکتی
TH.small = گام کوتاه حرکتی

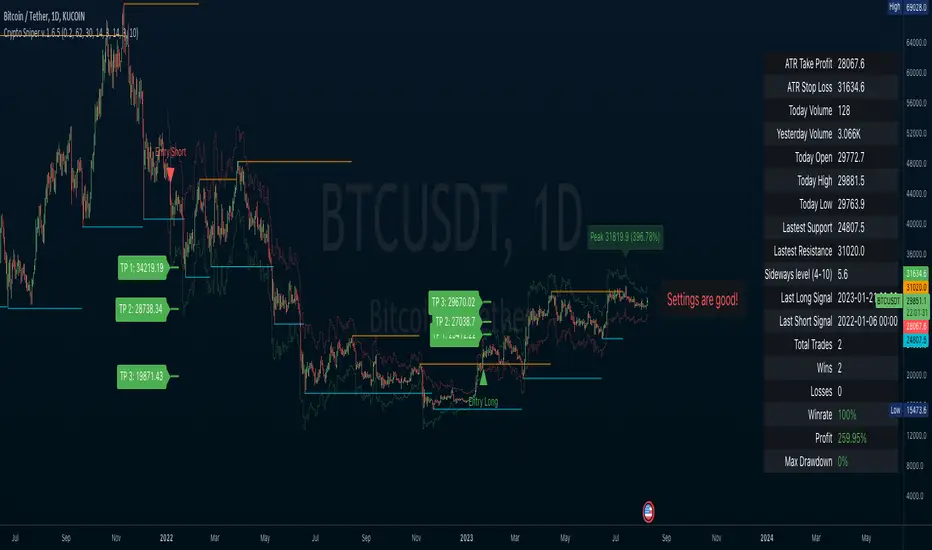
Crypto SniperAn easy to follow indicator for scalping or long term trades. You can add this indicator to other analysis as a complementary indicator or use it alone for entry and exit your trades.
Features
• Simple entry signals, buy the contract at the end of the signal candle
• Additional entry signals can be enabled to increase your position and your profits
• Get exit signals for your opened trades.
• Alert conditions for all entries, additional entries and exits
• Enable ATR plot of Take Profit and Stop Loss
• Customize your ATR settings to adapt the indicator to any market
This indicator use some analysis to get the bottom/top of the cycles. Any market or timeframe and can be used. Specially designed for scalping on cryptocurrency futures markets.
EMA based ATR Stops-If the FAST EMA is ABOVE the SLOW EMA then the ATR Stops will be placed x amount BELOW the lows
-If the FAST EMA is BELOW the SLOW EMA , then the ATR Stops will be placed x amount ABOVE the highs
-If the fast ema is above the slow ema but they are sloping down, their colours will turn to a shade of blue
-If the fast ema is below the slow ema but they are sloping up, their colours will turn to a lighter shade of blue
-I added an extra ema but it is off by default
TAYOR!

Flexible timezone-aware session rangeAllows you to define session range with local time and its timezone, also can toggle session visibility any day of week.


Session Volatility CalculatorHey traders!
This script calculates the average volatility of trading sessions.
You specify a start date, an end date, and a session time (eg. market open, Asian session etc)
The script then scans through all the price action on your chart and calculates the average price movement during that specified period.
What Is It For?
I created this script for my own purposes when developing certain strategies and testing certain ideas.
The purpose of this script is to give you an idea of how much price tends to move during certain times of day for certain markets.
You could think of it as a "session's average true range".
In crypto and forex this might be how much price tends to move on certain pairs during the Australian/Asian session, or the European session, or the overnight U.S. session etc.
In stocks this might be how much a symbol tends to move during the first hour of the day or the last hour of the day.
The point of calculating this information is for better understanding how markets move during certain times of day.
It's not a perfect science obviously since some days can be wilder than others depending on what fundamental events are developing, but it's useful information to have for times when there are no expected volatility-inducing events.
This info can help with optimizing targets and stop loss placement for certain day-trading strategies, and just generally getting an idea of what kinds of moves you might reasonably expect out of overnight positions or certain times of day etc - or at least that's what I use it for.
Settings
Hover your mouse over the "i" symbol to get more information on the script's settings, but here's a brief description:
Start Date: The date to begin calculating from (set to 1000 by default so it scans the entire chart).
End Date: The date to stop calculating (set to 2099 by default so it scans the entire chart)
Time Session: This is the time session during the day that you want to analyze.
Color Background: If turned on, this setting changes the background color to highlight the session.
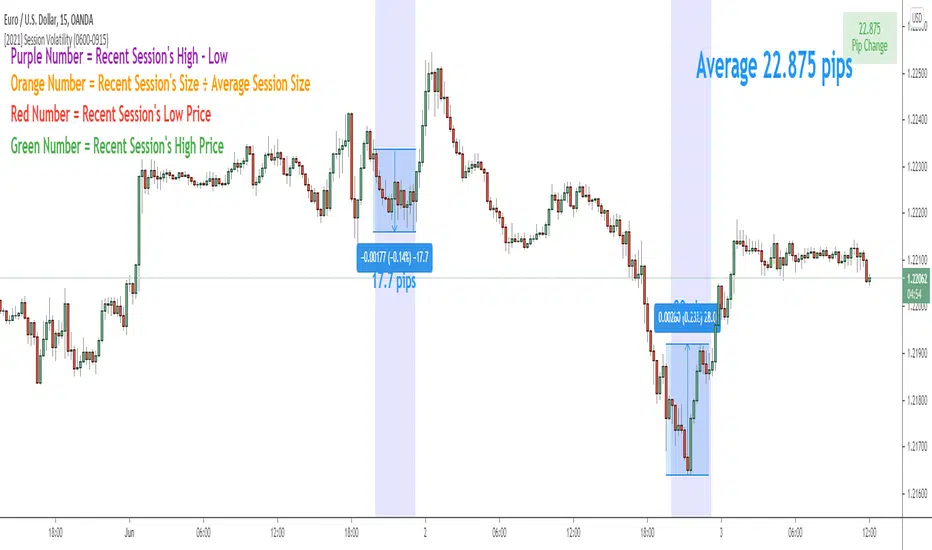
Indicator Values
The indicator outputs a handful of values onto your chart. This is what the colors correspond to:
Top-Right Box: The average price range during the given time of day over historical price action.
Green Number: The recent session's highest price.
Red Number: The recent session's lowest price.
Purple Number: The recent session's price range (high - low).
Orange Number: The recent session's range ÷ the average (outputs a relative % of the average).
[JL] ATR HL CloudI am playing ATR now.
This script is made to watch ATR and highest-lowest.
ATR is calculated by max of short period and long period.
Up cloud is lowest price plus ATR * Multi
Dn cloud is highest price decrease ATR* Multi
Higher and higher cloud means up trend
Lower and lower cloud means dn trend