OPEN-SOURCE SCRIPT
Telah dikemas kini Session Volatility Calculator
Hey traders!
This script calculates the average volatility of trading sessions.
You specify a start date, an end date, and a session time (eg. market open, Asian session etc)
The script then scans through all the price action on your chart and calculates the average price movement during that specified period.
What Is It For?
I created this script for my own purposes when developing certain strategies and testing certain ideas.
The purpose of this script is to give you an idea of how much price tends to move during certain times of day for certain markets.
You could think of it as a "session's average true range".
In crypto and forex this might be how much price tends to move on certain pairs during the Australian/Asian session, or the European session, or the overnight U.S. session etc.
In stocks this might be how much a symbol tends to move during the first hour of the day or the last hour of the day.
The point of calculating this information is for better understanding how markets move during certain times of day.
It's not a perfect science obviously since some days can be wilder than others depending on what fundamental events are developing, but it's useful information to have for times when there are no expected volatility-inducing events.
This info can help with optimizing targets and stop loss placement for certain day-trading strategies, and just generally getting an idea of what kinds of moves you might reasonably expect out of overnight positions or certain times of day etc - or at least that's what I use it for.
Settings
Hover your mouse over the "i" symbol to get more information on the script's settings, but here's a brief description:
Start Date: The date to begin calculating from (set to 1000 by default so it scans the entire chart).
End Date: The date to stop calculating (set to 2099 by default so it scans the entire chart)
Time Session: This is the time session during the day that you want to analyze.
Color Background: If turned on, this setting changes the background color to highlight the session.
Indicator Values
The indicator outputs a handful of values onto your chart. This is what the colors correspond to:
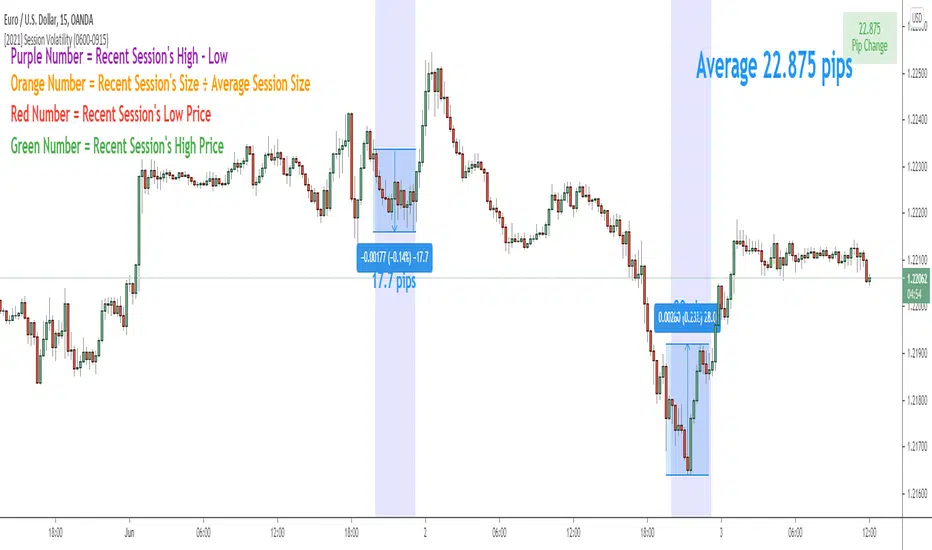
Top-Right Box: The average price range during the given time of day over historical price action.
Green Number: The recent session's highest price.
Red Number: The recent session's lowest price.
Purple Number: The recent session's price range (high - low).
Orange Number: The recent session's range ÷ the average (outputs a relative % of the average).
This script calculates the average volatility of trading sessions.
You specify a start date, an end date, and a session time (eg. market open, Asian session etc)
The script then scans through all the price action on your chart and calculates the average price movement during that specified period.
What Is It For?
I created this script for my own purposes when developing certain strategies and testing certain ideas.
The purpose of this script is to give you an idea of how much price tends to move during certain times of day for certain markets.
You could think of it as a "session's average true range".
In crypto and forex this might be how much price tends to move on certain pairs during the Australian/Asian session, or the European session, or the overnight U.S. session etc.
In stocks this might be how much a symbol tends to move during the first hour of the day or the last hour of the day.
The point of calculating this information is for better understanding how markets move during certain times of day.
It's not a perfect science obviously since some days can be wilder than others depending on what fundamental events are developing, but it's useful information to have for times when there are no expected volatility-inducing events.
This info can help with optimizing targets and stop loss placement for certain day-trading strategies, and just generally getting an idea of what kinds of moves you might reasonably expect out of overnight positions or certain times of day etc - or at least that's what I use it for.
Settings
Hover your mouse over the "i" symbol to get more information on the script's settings, but here's a brief description:
Start Date: The date to begin calculating from (set to 1000 by default so it scans the entire chart).
End Date: The date to stop calculating (set to 2099 by default so it scans the entire chart)
Time Session: This is the time session during the day that you want to analyze.
Color Background: If turned on, this setting changes the background color to highlight the session.
Indicator Values
The indicator outputs a handful of values onto your chart. This is what the colors correspond to:
Top-Right Box: The average price range during the given time of day over historical price action.
Green Number: The recent session's highest price.
Red Number: The recent session's lowest price.
Purple Number: The recent session's price range (high - low).
Orange Number: The recent session's range ÷ the average (outputs a relative % of the average).
Nota Keluaran
Removed some redundant code that I accidentally left in for testing purposesNota Keluaran
Updated to Pine Script v5Skrip sumber terbuka
Dalam semangat sebenar TradingView, pencipta skrip ini telah menjadikannya sumber terbuka supaya pedagang dapat menilai dan mengesahkan kefungsiannya. Terima kasih kepada penulis! Walaupun anda boleh menggunakannya secara percuma, ingat bahawa menerbitkan semula kod ini adalah tertakluk kepada Peraturan Dalaman kami.
My Resources Hub: theartoftrading.com
FREE YouTube Lessons: rebrand.ly/zyt
FREE Pine Script Basics Course: rebrand.ly/zpsbc
Pine Script MASTERY Course: rebrand.ly/zpsmc
My Indicators & Strategies: rebrand.ly/zmisc
FREE YouTube Lessons: rebrand.ly/zyt
FREE Pine Script Basics Course: rebrand.ly/zpsbc
Pine Script MASTERY Course: rebrand.ly/zpsmc
My Indicators & Strategies: rebrand.ly/zmisc
Penafian
Maklumat dan penerbitan adalah tidak dimaksudkan untuk menjadi, dan tidak membentuk, nasihat untuk kewangan, pelaburan, perdagangan dan jenis-jenis lain atau cadangan yang dibekalkan atau disahkan oleh TradingView. Baca dengan lebih lanjut di Terma Penggunaan.
Skrip sumber terbuka
Dalam semangat sebenar TradingView, pencipta skrip ini telah menjadikannya sumber terbuka supaya pedagang dapat menilai dan mengesahkan kefungsiannya. Terima kasih kepada penulis! Walaupun anda boleh menggunakannya secara percuma, ingat bahawa menerbitkan semula kod ini adalah tertakluk kepada Peraturan Dalaman kami.
My Resources Hub: theartoftrading.com
FREE YouTube Lessons: rebrand.ly/zyt
FREE Pine Script Basics Course: rebrand.ly/zpsbc
Pine Script MASTERY Course: rebrand.ly/zpsmc
My Indicators & Strategies: rebrand.ly/zmisc
FREE YouTube Lessons: rebrand.ly/zyt
FREE Pine Script Basics Course: rebrand.ly/zpsbc
Pine Script MASTERY Course: rebrand.ly/zpsmc
My Indicators & Strategies: rebrand.ly/zmisc
Penafian
Maklumat dan penerbitan adalah tidak dimaksudkan untuk menjadi, dan tidak membentuk, nasihat untuk kewangan, pelaburan, perdagangan dan jenis-jenis lain atau cadangan yang dibekalkan atau disahkan oleh TradingView. Baca dengan lebih lanjut di Terma Penggunaan.