ATR Stop [COFUTrading]ATR excluding price spikes for a more correct calculation of average volatility and setting a stop loss.
Average True Range (ATR)

ProjectionGreetings Traders! I have decided to release a few scripts as open-source as I'm sure others can benefit from them and perhaps make them better.(Be sure to check my Profile for the other scripts as well: www.tradingview.com).
This one is called Projection.
Projection is based off the same Principle as some of my other scripts, such as Trade Manager() and Price Predictor(). I use a simple concept using line.new() to define some potential Price Projections. From the Settings of the Indicator, you can access a couple different Pre-Set options.
Wide Parabola:
Skinny Parabola:
Straight Triangle:
ZigZag1:
ZigZag2:
I wanted to give a Special Thanks to @Pinecoders for the custom RoundToTick Function from Backtesting/Trading Engine --> ()
If you like Projection, be sure to Like, Follow, and if you have any questions, don't be afraid to drop a comment below.

User-Inputed Time Range & FibsGreetings Traders! I have decided to release a few scripts as open-source as I'm sure others can benefit from them and perhaps make them better.(Be sure to check my Profile for the other scripts as well: www.tradingview.com).
This one is called User-Inputed Time Range & Fibs.
The idea behind this script is to record the Range Highs and Lows of a User Defined Period, and plot potential Targets based on either Fibonacci Extensions or a Multiple of the Range Size. I created this originally for use with the US Session Initial Balance(From 9:30-10:30AM EST), however it can be set to any time period.
What is Initial Balance? In simple words, Initial Balance (IB) is the price data, which are formed during the first hour of a trading session. Activity of traders forms the so-called Initial Balance at this time. This concept was introduced for the first time by Peter Steidlmayer when he presented the market profile to traders(atas.net).
The IB is monitored as a break-out area for Range Extension traders. The IB High is also seen as an area of resistance and the IB Low as an area of support until it is broken(www.mypivots.com).
As a note, depending on the Time Zone you are in, you may need to manually add or subtract from the Timed Range to match the desired Time. For example in NY Eastern Time, I have to use 8:30-9:30AM to Capture the 9:30-10-30AM IB for ES and NQ. Similarly, I must use 14:30-15:30PM to Capture the 9:30-10-30AM IB for BTC. You will need to make adjustments based on the Time Zone you are located in.
I wanted to give a Special Thanks to @PineCoders for the Custom Rounding Function from Backtesting/Trading Engine--> (), Pinecoders.com for help with Tracking the Highs/Lows--> (www.pinecoders.com), and @TradeChartist for allowing me to use some of the code for the Fibonacci Extensions from his script here--> ().
If you like User-Inputed Time Range & Fibs, be sure to Like, Follow, and if you have any questions, don't be afraid to drop a comment below.

Price PredictorGreetings Traders! I have decided to release a few scripts as open-source as I'm sure others can benefit from them and perhaps make them better.(Be sure to check my Profile for the other scripts as well: www.tradingview.com).
This one is called Price Predictor.
How To Use Price Predictor
Price Predictor acquires potential targets by measuring the Average Change of Price from a user-defined resolution, from Open to Open. By default, the Resolution is set to 1 Day, however you can play around with Weekly, Monthly, etc. When a new resolution period begins, Price Predictor will automatically adjust based on the new Average Change of Price.
Due to the avoidance of Security() in this script, you may have to play around with the Timeframe that you use it in to ensure that you have enough bars on your chart to process the User-Defined Resolution.
The first Target Zone represents Target 5 of my other script, Trade Manager()(Given that you set the Target Multiple and Default Threshold Inputs as the same in each script), and is the most likely to be hit before the end of the resolution period.
In addition to a User-Defined Resolution, you also have the option of using a Custom Price to define Target Zones, however I'd recommend using my other script, Trade Manager(), if the volatility of the Instrument isn't too high.
I wanted to give a Special Thanks to @Pinecoders for the Custom RoundToTick Function from The Backtesting/Trading Engine --> (
If you like Price Predictor, be sure to Like, Follow, and if you have any questions, don't be afraid to drop a comment below.

Trade ManagerGreetings Traders! I have decided to release a few scripts as open-source as I'm sure others can benefit from them and perhaps make them better.(Be sure to check my Profile for the other scripts as well: www.tradingview.com).
This one is called Trade Manager.
How To Use Trade Manager
Trade Manager acquires potential targets by measuring the Average Change of Price from a user-defined resolution, from Open to Open. By default, the Resolution is set to 1 Day, however you can play around with Weekly, Monthly, etc. When a new resolution period begins, Trade Manager will automatically adjust its Targets based on the new Average Change of Price.
Due to the avoidance of Security() in this script, you may have to play around with the Timeframe that you use it in to ensure that you have enough bars on your chart to process the User-Defined Resolution.
The idea behind Trade Manager is quite simple yet can be quite powerful at the same time. Consider a Daily Candle for example. You can clearly see how a vast amount of price movement can be encapsulated within it, sometimes in both directions. By measuring the Average Change of Price per day(From Open to Open), we can use this Average to build targets off of. Defining a small Threshold above and below the Open Price of the Daily Candle allows you to set Limit Orders at these levels with predefined Targets. Then, the use of the custom Trailing Stop and Break Even helps to secure profits without giving too much back to the market, all while managing your risk.
Within the Settings of Trade Manager, you have the option to alter the logic of whether Break-Even is set after the first Target or second Target is hit.
In addition to using a User-Defined Resolution Period, you can also input a Custom Price into the settings of Trade Manager and allow the Targets, Trailing Stop, and Break Even to be calculated from the Custom Price.
I wanted to give a Special Thanks to @PineCoders for the Custom RoundToTick Function from The Backtesting/Trading Engine --> ()
As a note, there are times where price will break out very strongly from the Limit Price, sometimes crossing the Stop and Limit Price on the same bar. When this happens, it is difficult for Pine to determine which occurred first intra-bar, and as a result, it does not record a new position. In these instances, I'd recommend adjusting the Default Stop Multiple so it is below the bar.
If you like Trade Manager, be sure to Like, Follow, and if you have any questions, don't be afraid to drop a comment below.

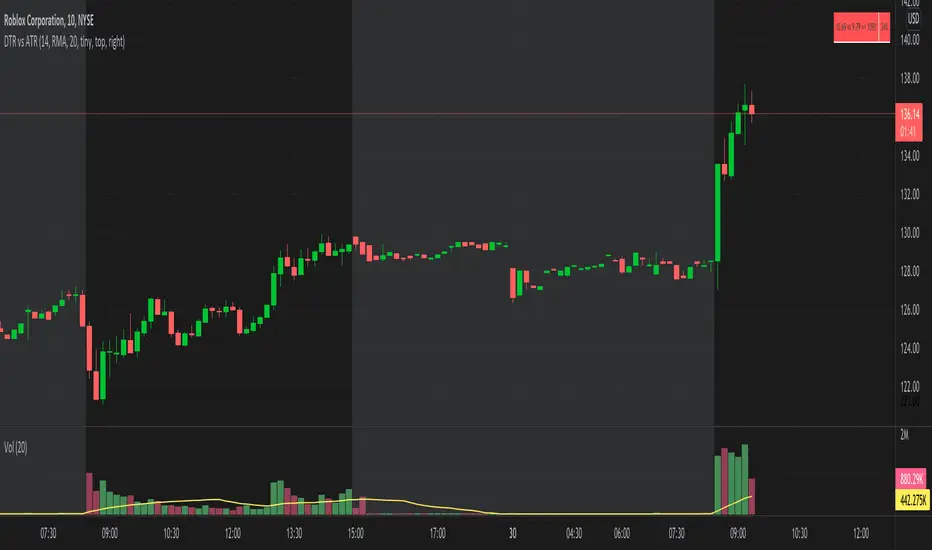
DTR vs ATR w RVolDTR vs ART along with Relative Volume in Percentage. So if you see RVol as 200% with input length of 10 days, today's volume is 2x compared to past 10 days. It helps if today's volume is already reached 20% or 30% within 30mins of market open, etc.
ATR BandsIt has happened to everybody. You enter the market, the position gets a stop loss, then later the market goes in the direction you originally planned. Worse yet - you enter a position, the market goes in your favor, gets near the target, and then it reverses and you get stopped.
We brazilians call this a "violinado", or getting violinated. It happens either because:
1. You put the stop loss too close, or the target too far
2. You entered in the right direction, but at a wrong time
While the second point cannot be programmly adressed, the first can. One popular way of setting a stop loss is by using the average of the true range, it even has a built-in indicator in TV. The problem with it is that you can still get violinated, since as the trend develops, the stop loss only goes up, never down. So if you enter at the wrong time, one slip can still take you out of the market.
Since I got sick of losing money using a conventional stop loss, I made these ATR bands. When you add this indicator to your graph, 6 lines are going to show up, 3 above the price, 3 below it. These lines are calculated from the ATR of the last 20 periods (can be configurated). The upper lines are the high of the last candle + the ATR * the multiplicator factor, the lower lines are the low - ATR * multiplicator factor. There are three multiplicator factors: 1.0, 1.618 and 2.0, and you change them to be whatever you want.
The logic behind it is that theses bands represents the region in which the market is more likely to stay. So if you enter the market at 50.00, you can't expect it to reach 500.00 in the next hour if the ATR is 5.00. And if you set the stop loss at 49.99, it is very likely that the market is going to stop you. By using the ATR bands, you can get a more reasonable price range, so you would set the stop loss at 45.00 and the take profit level at 60.00.
There are two types os ATR you can use: the regular, calculated with RMA, and another using a custom WMA, which puts greater emphasis on large amplitudes. By default, the average uses the past 20 true ranges. You can also choose to use either the closing price or the extremes of the candle as a basis.
Another thing I've added is the violation statistics, which shows the percentages of the times that a band was violated in the next 5 candles (can be configurated). With this, you can get a broader view on the probability of the bands actually being reached.
You may have notice that the bands are lagged by 1 period. I did this so that there is no way you can use future data. You can disable it or increase it, but I recommend just letting it be 1. These bands are the range in which the price is most likely to stay in, if you change the lag you are essentially breaking it's whole purpose.

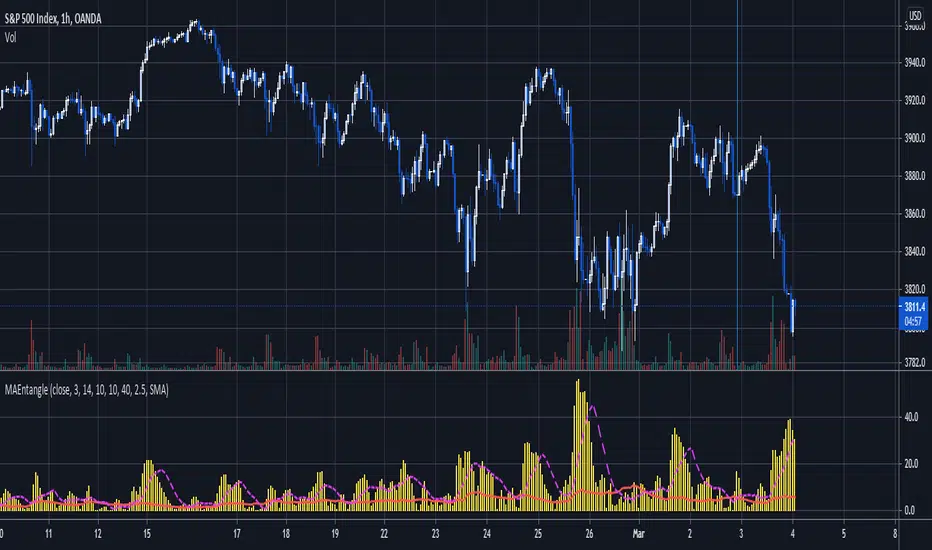
Moving Average EntanglementThis script uses the gap in moving averages standardized to the average true range to determine entry and exit points.
The red line represents the current percentage of ATR that is deemed "The Dead Zone" - a move that is too small to be reliable.
The histogram represents the gap between moving averages. When the histogram is above the red line, it confirms a breakout move.
The dashed line an be used as a secondary filter and is a moving average of the histogram.
When Standard Deviation mode is on, a third line is displayed, which represents how many standard Deviations the current histogram bar represents, and can be also used as a filter.
Adoptive Supertrend - PivotsAnother experiment with Supertrend by making use of pivot point high/lows.
Trailing Stop types used in this indicator are:
ATR - plain ATR based supertrend
Breakout - ATR based supertrend combined with breakout. (Trailing triggered only if price change is higher than HighPriceChange multiplier times ATR.
Pivot Points - Trail only when new pivots created. Pivot stop multiplier is used below pivot low.
Combined - Combine everything together

Fishing The TrendFishing The Trend
HOW Does it work ? The code uses dynamic levels to identify trend.
This script used SuperTrend (ST), ATR and relatively Smoothened ST for early trend reversal detection to determine the trend and direction so that a fruitful decision can be made.
To Indicate the strength of the trendline, The standard calculations of SuperTrend, along with multiple smoothen ATR results are clubbed determine the direction, a step ahead.
However, the indicator is not appropriate for all the situations. It works when the market is trending. Hence it is best to use for short-term technical analysis . SuperTrend uses only the two parameters of ATR and multiplier which are not sufficient under certain conditions to predict the accurate direction of the market. Here in this indicator ATR value is not editable and after long backtests the best ATR value is kept that helps the indicator working very well.
The default setting is best for use, but user can customize the Multiplier for his own fine tunings, So once the Levels are matched, a Long / Short suggestion is plotted.
Best Time Frames to use : starting from 1, 3, 5, 15, 30 Mins and so on... to determine Trend.
Long = L and Short = S.
Where and how to use?
The main use of this indicator is quick scalping and Intra-day trading.
The Indicator shows the option to show Long/Short Signals which the use can be turned on or off.
The indicator shows a very useful option for early detection of the ongoing trend whether there will be reversal of trend or not ?
Stop Loss - That should be done by following ones risk appetite, Ideally the High of the Previous Candle should be the stop loss for the Long / Short but everyone has their own Risk Management Strategies based on the capital deployed.
Disclaimer : There could be scenarios when the candle is shown as a long or short and then the candle turns into opposite direction red/green. In such scenarios , Please refer to the just preceding candle and the early detection signal and if this candle is moving into positive direction only then go for long, Similarly opposite for Short, the value of multiplier 0.5 is determined using series of back test across various assets with different time frames.
User Options : Choice of turning on / off the Long / Short Labels and early detection/StopLoss Option can also be activated or deactivated.
Visual Checks - The user could manually validate the back test results on various assets they would like to use this strategy on before putting it live.
Usage/Markets : Index Trading / Equities and also well with Commodities and Currencies
How to get access
Please click on the link / email in the signature or send me a private message to get access
Feedback
Please click on the link/email in the signature or send me a private message for suggestions/feedbacks
Slow and Fast TurtleThis script is based on the famous turtle strategy with add on cha stop.
- Fast Buy triggered when price cross upper DC 20.
- Slow Buy triggered when price cross upper DC55.
- There is 2 lines (black line) which is Stop Line and Average Up line.
- Stop when price close below Stop Line and Average Up when price close above Average Up line.
- There is 2 Sell signal which is Fast Sell and Slow Sell. Fast Sell triggered when price close below than lower DC 10 and Slow Sell triggered when price close below than lower DC 20.
- Cha stop is also sell signal which is triggered when close price is lower than lowest 2 days before.

ATR on Double Bollinger Bands (BB) ATR Coupled with Bollinger bands helps you to time the Entries & Exits.
The combination of two Volatility Indicators ATR & Bollinger bands captures cyclical behavior of the market.
This Indicator helps you to identify the range contraction & range expansion for trades & signals reversal signs
ATR - Double Bollinger Bands (BB) indicator plots Two Bollinger Bands on ATR Indicator.
ATR - Double Bollinger Bands (BB) indicator plots Two Bollinger Bands on ATR Indicator.
Markets go through cycles of contraction and expansion. Range Expansion is identified when ATR is rising above the ATR average. Range Contraction is identified when ATR is falling below ATR average.
Whenever the market is contracted, then comes the range expansion so these signals can be used for entries & exits.
The average true range is a volatility indicator. Volatility measures the strength of the price action and is often considered for clues on market direction
This is the combination of two Volatility Indicators ATR & Bollinger bands to capture cyclical behavior of the market.
How to use the indicator for Entry & Exits ?
When ATR is below Bollinger band basis line and closer to the lower band that indicates the range contraction, so traders can expect the range expansion soon & entering long positions becomes a safe bet.
When ATR is touching the upper Bollinger band (2 standard deviation) that indicates range expansion so closing a long position or booking partial profits becomes a safe bet, because the stock is likely to enter a trading range or reverse direction at this point.
When ATR is outside the upper Bollinger band, avoid long trades as range contraction expected soon.
Reversals - A reversed trend is expected when price touches its extreme outer bands. it is always a good practice to confirm reversal signals with more than one indicator signals.
A prolonged period of low ATR values may indicate a consolidation area and the possibility of a continuation move or reversal.

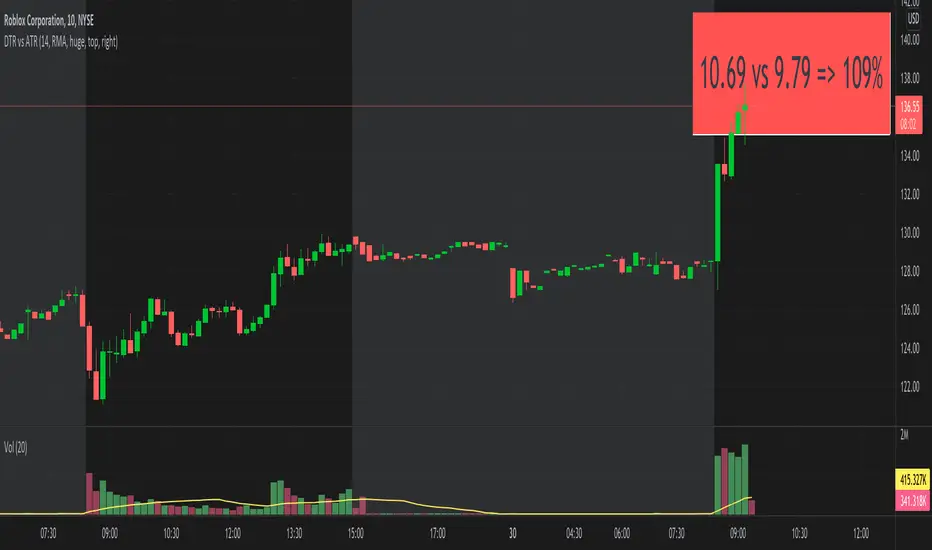
DTR vs ATRThis script shows DTR vs ATR (Today's True Range vs 14 days Avg True Range) along with percentage. The label automatically changes color based on percent value. <=70 is GREEN, >=90 is RED and between 70 & 90 is ORANGE.
The location of the script not stick to one place. There is no such a functionality to keep it static at one location (like top right corner). But I think that feature is coming soon. I may be wrong.

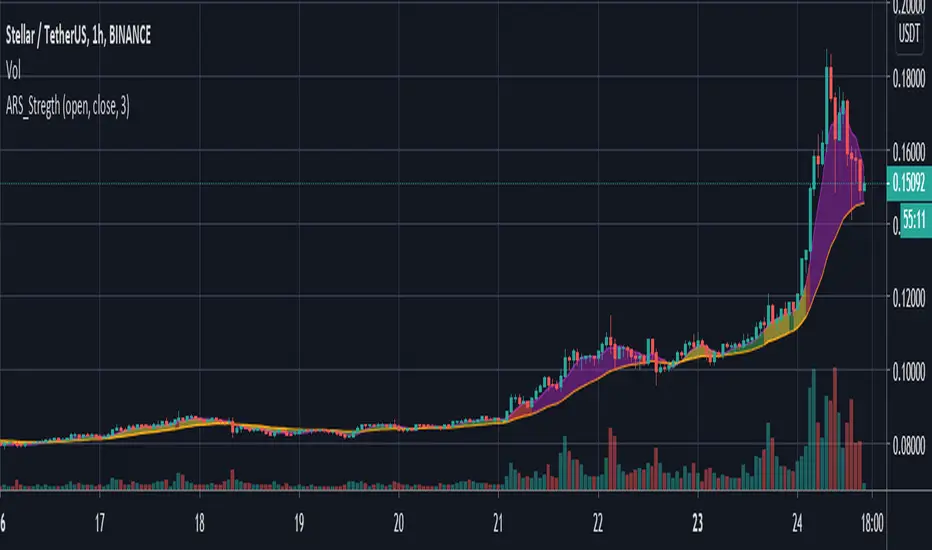
ARS Strength IndexThis script is a graphis representation of Gunbot`s addon called ARS.
Small script indicator showing the strength (volatility) of a current selected pair.
Based on % deviation between ATR and baseline SMA(ATR)
Supposed to be used on 1h frame.
Could be used to switch automated trading strategy settings to more save if index grows.
Green zone is calm market
Yellow zone is average
Red is risk zone
Purple is high risk zone (liqudation)
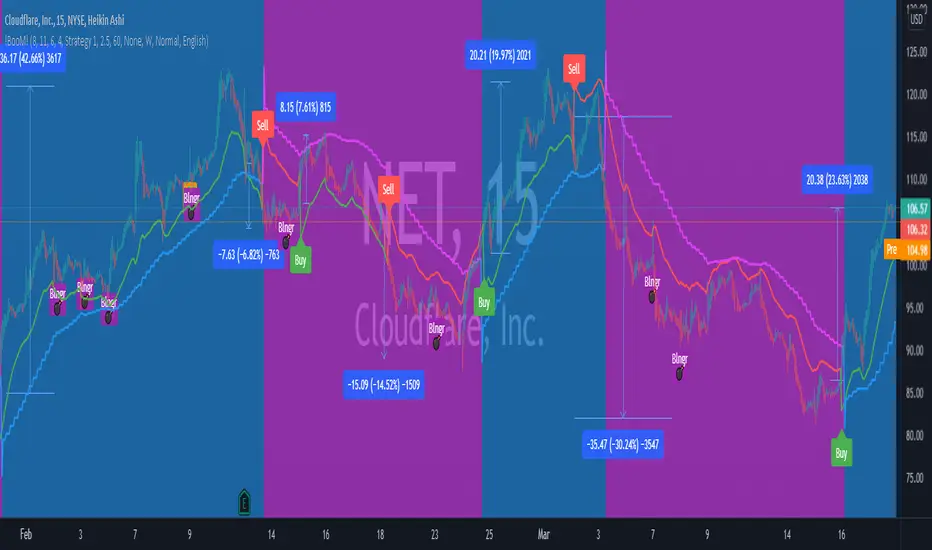
!BooM!Hello
The indicator measures the relationship between Average True Range (ATR) that shows how much an asset moves, on average, during a given time frame and Standard Deviation that measuring how widely asset prices are dispersed from the average price. If prices trade in a narrow trading range, the relationship between the ATR and SD will return a low value that indicates low volatility that will lead to potential price quick movement.
To increase the accuracy of the indicator and reduce false signals, it generates three circles, each indicate protentional price quick movement coming. For circle to print, following criteria must meet:
• Green Circle is based on low volatility and both ATR and SD are at minimum value for a short pre-defined time frame.
• Magenta Circle is based on low volatility and SD are at minimum value for a long pre-defined time frame.
• Yellow Circle is based on low volatility and SD are at minimum value for a short pre-defined time frame and Average Directional Movement Index reaching to pre-defined level.
The indicator focuses mainly on identifying potential price quick movement. However, it is equipped with two signal that is generated upon crossing the keltner channel upper or lower bands to help identifying the direction of the price movements but the user shall study the chart on big time frame to confirm the direction of the price movement.
If you would like to use it, please drop a message or find other contact under my signature.
After purchase, open the TradingView indicator library. Under the Invite-Only Scripts section, you will see it. Add it to your chart and save your chart layout.
Daily GAP StatsI did not write the script from scratch but rather started editing code of an existing one. The original code came from a script called GAP DETECTOR by @Asch-
First up: I am a trader, not a programmer and therefore my code most likely is inefficient. If someone with more expertise would like to help and optimize it - feel free to get in touch, I am always happy to learn some new tricks. :)
This script does 2 things:
- It shows daily gaps stats based on user inputs
- It shows color coded labels on gap days with additional information in tooltips ( important: make sure to read 'known issues/limitations' at the end )
User Inputs
==========
Although the input dialog is pretty straight forward, I do a quick rundown:
- Length: max lookback time
- Gap Direction: self explanatory
- Show All Gaps | Cont Only | Reversal Only | Off:
This refers to the way labels are displayed on gap days (again: make sure to read known issues/limitations!)
- Show All Gaps: does what it says
- Cont Only: only shows gaps where price continued in the gap direction. If you filter for gap ups and chose 'Cont only' you will only see labels on gap days where price closed above the open (and vice versa if you scan for gap downs).
- Reversal Only: you will only see labels for closes below the open on gap up days (and the opposite on gap down days)
- Off: self explanatory
- Gap Measure in ATR/PCT: self explanatory, ATR is calculated over a 10d period
- Gap Size (Abs Values): no negative values allowed here. If you filter for gap downs and enter 3 it means it will show gaps where the stock fell more than 3 ATR/PCT on the open.
- RVOL Factor: along with significant gaps should come significant volume. RVOL = volume of the gap day / 20d average volume
- Viewing Options: Placing the stats label in the window is a bit tricky (see knonw issues/limitations) and I was not sure which way I liked better. See for yourself what works best for you.
Known Isusses/Limitations:
=======================
- Positioning of the stats table:
As to my knowledge, Tradingview only allows label positioning relative to price and not relative to the chart window. I tried to always display the gap stats table in the upper right corner, using 52wk high as y-coordinate. This works ok most of the time, but is not pretty. If anybody has some fancy way to tag the label in a fixed position, please get in touch.
- Max number of labels per script:
TradingView has a limitation that allows a maxium of ~50 labels per script. If there are more labels, TradingView will automatically cut the oldest ones, without any notification. I have found this behaviour to be rather inconsistent - sometimes it'll dump labels even if there are a lot fewer than 50. Hopefully TradingView will drop this limitation at one point in the future.
Important: The inconsistent display of the gap day labels has NO INFLUENCE on the calculations in the gap stats table - the count and the calculations are complete and correct!

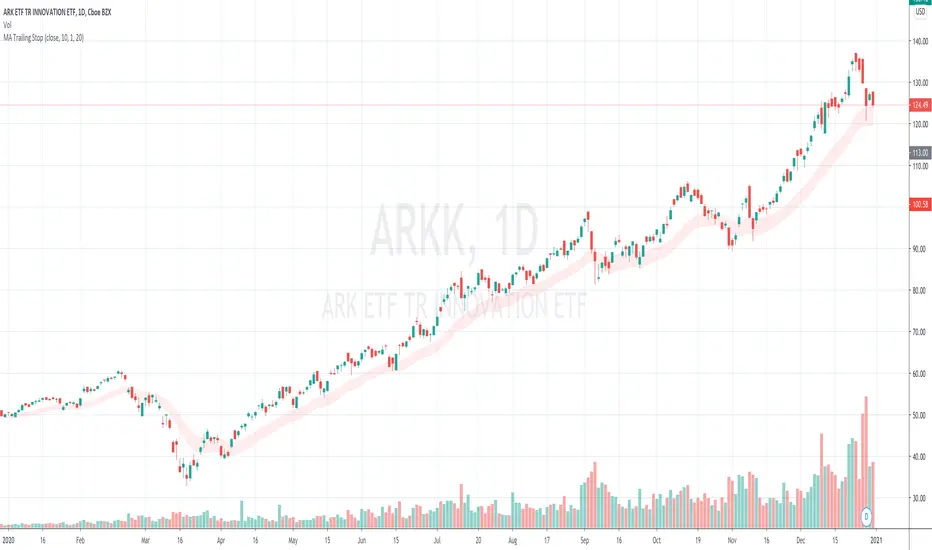
MA Trailing StopA Trailing Stop indicator that uses a multiple of ATR below a SMA/EMA line. Support long positions only.
Configurables:
1. Use SMA or EMA
2. MA Period
3. ATR multiplier
4. ATR look back period
The bottom of the red area indicates the stop line. The top of the red area indicates the reference MA line.
Ideal use case is you find your a red area that covers most local lows.
The stop line moves up with MA, but does not move down if MA moves down.
If moves down (re-calculates itself) only when a low penetrates the stop line.
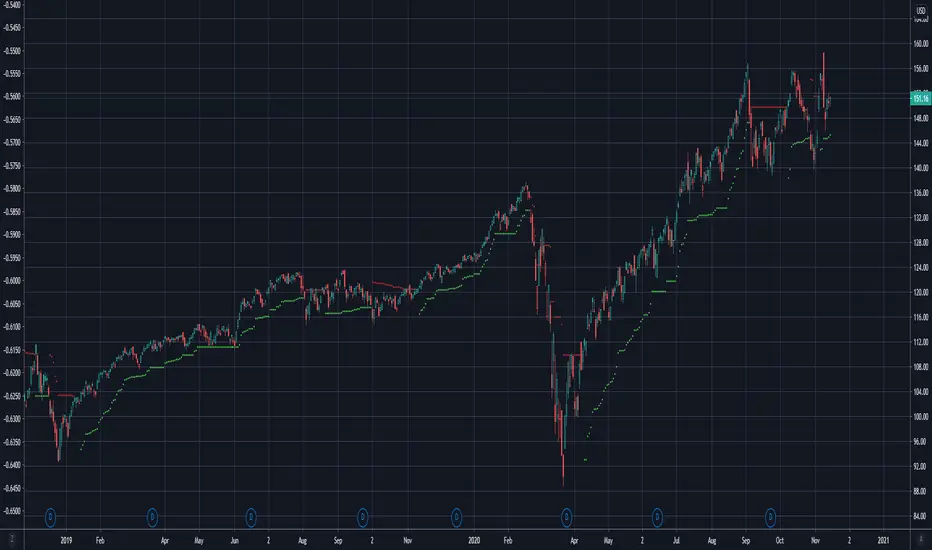
Chandelier Exit | SAR/Long Only (4CUP)As introduced by StockCharts.com, Chandelier Exit was developed by Charles Le Beau and featured in Alexander Elder's books, this sets a trailing stop-loss based on the Average True Range (ATR).
Chandelier Exit can be formulated as a stop-and-reverse (SAR) or as a traditional trailing stop-loss version shown by Stockcharts.com.
The main difference is that, in SAR version, the indicator is usually formulated in a higher of previous or spot indicator (HPS) for long and lower of previous and spot indicator (LPS) for short position.
This indicator is coded to show both the SAR version and the traditional one shown by Stockcharts.com (for long position) by simply clicking a tick in the Version box.
The ATR multiplier is relaxed to allow non-integer input, like 3.5, 4.25, ... for a greater flexibility to tailor your best-fit exit strategy.
If you find this indicator is useful to you, Star it, Follow, Donate, Like and Share.
Your support is a highly motivation for me.
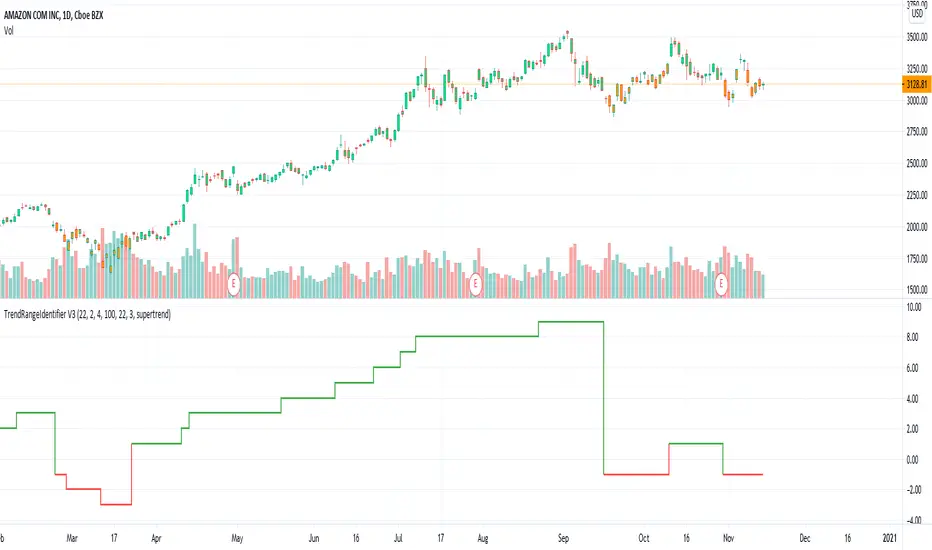
TrendRangeIdentifier V3This is non-overlay version of
Since, we plot trend value which keeps incrementing/decrementing upon every step, this also helps us in identifying strength of trend and how long the trend is going on.
Other changes:
Removed display of channels
Coloring candles made optional
ATR Trend & ATR Top/Bottom (Zeiierman)█ Overview
ATR Trend & ATR Top/Bottom (Zeiierman) blends momentum, volatility, and adaptive trend analysis into a unified framework. It fuses a dynamic oscillator with ATR-based exhaustion detection to identify trend direction, impulses, and potential reversals within the same structure.
Rather than viewing volatility as noise, this tool interprets it as trend expansion, which represents directional conviction, while contraction signals absorption or exhaustion. By combining multi-phase smoothing, adaptive ATR scaling, and contextual trend filtering, the indicator delivers a complete picture of when a market is accelerating, stabilizing, or reversing.
It performs best once a trend has matured and volatility normalizes around a directional core, giving traders the confidence to participate in established moves while dynamically managing risk.
⚪ Why This One Is Unique
Traditional trend oscillators rely on fixed parameters that degrade across assets or timeframes. ATR Trend & ATR Top/Bottom instead employs adaptive weighting and volatility-normalized filtering that automatically aligns with the current market structure.
Its framework integrates three distinct components:
Adaptive Oscillator Core that reveals the internal rhythm of trend and momentum.
ATR Top/Bottom Layer that marks exhaustion and potential turning zones.
Trend Signal & Dynamic Trailing Stop Engine that highlights directional shifts, confirms alignment with the prevailing trend, and transforms trend data into a self-adjusting risk-management system.
█ Main Features
⚪ ATR Trend (The Main Oscillator)
The ATR Trend serves as the indicator’s primary oscillator, translating price and volatility dynamics into a smooth directional curve. When the oscillator line remains above its equilibrium, bullish momentum dominates; when it stays below, bearish momentum prevails. Color transitions reflect real-time trend bias, helping traders immediately recognize whether the market is strengthening or weakening.
This component forms the structural core of the tool, defining overall trend direction, momentum intensity, and transition zones.
It also visualizes trend expansion through the fast leading signal line. When this line crosses above the upper or below the lower boundary, it signals an expansive move within the active trend, often representing short-term overbought or oversold conditions, and can also indicate trend strength in the prevailing market direction.
⚪ ATR Top/Bottom
The ATR Top/Bottom layer highlights potential exhaustion zones within the trend. Green peaks reveal areas of buy-side saturation, suggesting a possible slowdown or reversal in bullish momentum, while red peaks mark sell-side extremes, often appearing before stabilization or renewed strength. These zones help traders identify when a move is becoming stretched or losing balance, offering valuable context for managing exits, scaling out, or anticipating reversals. However, these areas can extend for a prolonged period when price is in a strong, sustained trend, reflecting persistent directional pressure rather than immediate exhaustion.
⚪ Trend Channel Hits
The Trend Channel Hits feature visualizes moments when the price interacts with the projected internal trend channel boundaries of the prevailing trend.
Green arrows appear when the price touches the upper boundary of the trend channel. This can indicate two possible outcomes:
A potential breakout from a negative trend into a developing bullish trend, as price breaks above the upper boundary of the descending channel.
A take-profit zone within an established bullish trend, as price reaches the upper channel where mean reversion is likely to occur.
Red arrows appear when the price touches the lower boundary of the trend channel. This can indicate:
A potential breakout from a positive trend into a developing bearish trend, as price breaks below the lower boundary of the rising channel.
A take-profit opportunity within an established bearish trend, as price reaches the lower channel where mean reversion or short-term recovery is likely to occur.
These signals provide early visual confirmation of trend exhaustion, continuation, or structural breakout, helping traders refine entries, exits, and profit-taking within the broader market context.
█ How to Use
⚪ Trend Following
When the oscillator line remains above the mid-level, the market is in a bullish phase. When it stays below the mid-level, the trend is bearish. Periods where the oscillator holds close to its upper or lower limits indicate strong, sustained momentum in that direction. Watch for color changes or crossovers near the mid-level, as these often signal an upcoming shift in trend control.
Bullish Trend
Bearish Trend
⚪ Trend Signals
To help traders identify and participate in trend trades, the indicator includes pre-built Trend Signals that highlight optimal entry conditions within confirmed market trends. These signals are designed to activate only once the market shows established directional momentum, ensuring higher reliability and filtering out noise from short-term fluctuations.
In addition, the indicator includes built-in take-profit markers for each signal. These serve as suggested partial exit levels, helping traders systematically secure profits while allowing the remaining position to follow the trend with the dynamic trailing stop.
Before relying on the signals, always confirm that the market has been trending for a sustained period. This ensures that entries align with genuine long-term directional strength rather than temporary volatility.
Bullish Trend Signals
Bullish Trend Signals appear during an established uptrend when the indicator detects confirmed positive momentum and stable directional structure. These signals mark potential continuation points where buyers regain control after short-term pauses or pullbacks.
The objective is to follow the trend signals, manage trades with the dynamic trailing stop, and consider taking partial profits at the inbuilt take-profit levels plotted by the indicator.
This setup works best when the market is trending clearly upward and has demonstrated consistent buying strength over time.
Bearish Trend Signals
Bearish Trend Signals occur during a confirmed downtrend, indicating that selling momentum remains dominant and the trend structure is intact. They typically appear after short-term corrective rallies, signaling that sellers are reasserting control within the broader bearish environment.
As with bullish signals, the goal is to follow the trend signals and trailing stop to capture sustained downside movement, while using the inbuilt take-profit levels to lock in partial gains as the move progresses. This approach performs best when the market is in a clear, mature downtrend with persistent selling pressure and expanding downside momentum.
⚪ Trend Impulses
Impulses represent short bursts of directional acceleration within the active trend.
A surge above the upper band reflects bullish expansion.
A move below the lower band marks bearish acceleration.
These impulses often precede short consolidations before the trend resumes. Traders can use them to scale into strong phases or take partial profits at temporary extremes.
⚪ Reversals
Enable ATR Top/Bottom to monitor momentum peaks:
Red peaks show strong selling momentum. When these peaks start to fade, it can signal that selling pressure is weakening and a potential recovery may be forming.
Green peaks show strong buying momentum. As their size shrinks, it may signal that buying pressure is slowing, and a possible pullback or reversal could follow.
⚪ Extended Trends
For traders who want to visualize intense, extended trend phases, enable the ATR Top/Bottom feature and increase the Length setting to around 30, with Sensitivity set between 40 and 50. Consider reducing the ATR Trend Length to 50 to gain clearer signals of when a trend begins and ends.
This configuration extends the ATR Top/Bottom zones across the entire duration of a major trend, making it easier to identify sustained directional strength and long-lasting momentum phases.
█ How It Works
⚪ Adaptive Oscillator Engine
The oscillator interprets directional flow through a combination of momentum mapping and volatility weighting. It continuously re-centers its equilibrium to reflect evolving market structure, producing a stable yet responsive representation of underlying trend force.
Calculation: Applies multi-domain smoothing and adaptive normalization to align amplitude with volatility while maintaining directional coherence.
⚪ ATR Top/Bottom Detection
The exhaustion layer isolates high-magnitude deviations from the current volatility envelope, identifying potential top and bottom regions where expansion may stall.
Calculation: Uses proportional volatility thresholds and dynamic range modeling to highlight statistically elevated momentum extremes without over-reacting to noise.
-----------------
Disclaimer
The content provided in my scripts, indicators, ideas, algorithms, and systems is for educational and informational purposes only. It does not constitute financial advice, investment recommendations, or a solicitation to buy or sell any financial instruments. I will not accept liability for any loss or damage, including without limitation any loss of profit, which may arise directly or indirectly from the use of or reliance on such information.
All investments involve risk, and the past performance of a security, industry, sector, market, financial product, trading strategy, backtest, or individual's trading does not guarantee future results or returns. Investors are fully responsible for any investment decisions they make. Such decisions should be based solely on an evaluation of their financial circumstances, investment objectives, risk tolerance, and liquidity needs.
Skrip berbayar

Minimum Average True RangeI use ATR a lot when designing trading strategies, this way the strategy adjusts to the instrument in most cases instead of me plugging in special numbers.
However, ATR itself could get spiked by some violent moves. For this I have created MinATR which I am publishing here.
It is effectively ATR + minimum ATR over the last "Min Length" bars. (this is a parameter which I have defaulted to 50).
So use this the same way you use ATR, but it will also show the min ATR over the last "Min Length" periods.

Range & Trend (Zeiierman)█ Overview
Range & Trend (Zeiierman) is a trend-first mapping of price that fuses an adaptive Range & Trend Line, a Trend Buffer (noise gate), a volatility-aware Trend Tracker, and optional Range Levels & Candles to reveal where trend is establishing, compressing, or handing off to a ranged regime.
Execution is guided by graded Buy/Sell labels (Regular / Plus / Strong), structural HH/HL & LL/LH markers with optional Peak Profit readouts, and a multi-TF Timeframe Scanner for alignment.
⚪ Why This One Is Unique
Unlike single-source trend lines, this version layers two orthogonal stabilizers:
a Range & Trend core that adapts its band size to volatility and dispersion, and
a dynamic smoothing buffer that dampens insignificant fluctuations, ensuring only meaningful trend movements affect signal output.
Signals are graded (Regular / Plus / Strong) based on contextual conditions, allowing traders to gauge the conviction behind each trend event. Range Candles add regime context by coloring bars only when a statistically consistent range structure forms, highlighting potential consolidation or transitional market phases. A lightweight Timeframe Scanner completes the workflow, broadcasting alignment from intraday to daily without adding chart clutter.
█ Main features
⚪ Range & Trend Line – Signal Generator
Adaptive directional mapping forms the foundation of the system. It highlights the active trend through color transitions and generates graded Buy/Sell labels (Regular / Plus / Strong) to reflect the strength of confirmation. The line responds dynamically to volatility, revealing when momentum is expanding, stabilizing, or reversing.
Unlike typical reactive signal tools, this model isolates only the most strong and meaningful trend transitions — those with the structural weight to establish or extend a new long-term directional phase. Each signal represents a filtered, high-conviction shift rather than a short-term fluctuation.
⚪ Trend Buffer (Noise Gate)
A precision filter that smooths the core trend output and suppresses false flips caused by short-term noise. It enhances visual consistency and provides the confirmation layer used to promote Regular signals to Plus strength when agreement occurs between buffer and core.
⚪ Trend Tracker
A trailing validation line that tracks directional health and trend persistence. It advances only in the direction of the active move, creating an adaptive stop-like reference. Tracker alignment helps identify trend exhaustion and contributes to Strong-grade signal confirmation.
⚪ Range Levels & Candles
Contextual zones that identify periods of compression or balance. When a valid range forms, candles are shaded within it, distinguishing ranging environments from trending conditions. These zones help anticipate breakouts and define natural support and resistance areas.
⚪ Live Structure (HH/HL & LL/LH with Peak Profit)
Displays real-time structural evolution — Higher Highs/Lows during uptrends and Lower Highs/Lows during downtrends. The optional Peak Profit label shows performance since the last regime change, offering an immediate view of current trend efficiency.
⚪ Timeframe Scanner
A compact multi-timeframe alignment panel that visualizes bullish or bearish trend states across user-selected intervals. It provides fast confirmation of directional consensus, helping traders act only when the broader structure supports their chosen bias.
█ How to Use
⚪ Range & Trend Line – Signal Generator
The Range & Trend Line is the core signal engine — its color shifts mark confirmed directional changes. This is where the system produces the graded Buy/Sell signals shown as ▲ / ▼ labels. Each grade reflects how many internal layers agree at the moment of signal creation:
Regular (▲ / ▼) – Triggered by a confirmed flip in the Range & Trend core. It appears when the base trend direction changes and is the earliest signal of potential reversal.
Plus (▲ + / ▼ +) – Requires the Trend Buffer to confirm the same direction. This upgrade indicates stronger trend agreement and higher reliability.
Strong (▲ ++ / ▼ ++) – These are high-conviction continuation signals and typically occur after structural confirmation.
How to trade them: Regular signals provide early awareness; Plus signals suggest confirmation; Strong signals mark trend maturity or high-probability continuations. Always trade in the direction of the prevailing trend. Use the Trend Buffer or Live Structure to confirm the dominant directional bias before acting on a signal.
⚪ Support and Resistance
The Range & Trend Line and the Buffer Line can act as dynamic support and resistance zones. Price often reacts around these levels, confirming whether the current move is continuing or losing strength.
Look for confirmation or rejection signals near these lines. Reactions around them often mark key decision points within the active trend.
⚪ Range Levels & Candles
Highlights when price enters structured consolidation zones. Candle coloring activates only inside validated ranges, helping to identify areas that show the typical characteristics of a ranging market. These zones visually separate balanced conditions from active trends and provide context for potential transitions.
Watch how price reacts around the upper and lower range levels. Look for false or confirmed breakouts, and expect price to move between these boundaries until a clear breakout develops. Range edges can also serve as practical entry or stop zones.
█ How It Works
⚪ Range & Trend Core
The main engine that defines the chart’s directional trend line. It adapts to changing market conditions, showing a smooth and reliable view of trend strength and direction.
Calculation: Builds a range-adaptive structure whose width adjusts with current volatility. The core moves toward new highs or lows but limits pullbacks to avoid false shifts. Several smoothing methods work together to create a steady, low-lag trend path.
⚪ Trend Buffer (Noise Gate)
A stabilizing layer that keeps the main trend line steady when price noise increases. It improves visual clarity and helps confirm true direction before a trend update appears.
Calculation: Uses a feedback-based update that reacts more when movement is strong and less when noise dominates. This lets the buffer ignore minor fluctuations while staying responsive to real trend changes.
⚪ Trend Tracker
A support line that follows the main move and helps confirm when a trend remains intact. It also serves as a guide for managing active positions.
Calculation: Applies a one-way trailing system that only moves in the direction of the trend. The offset adjusts with volatility, keeping a consistent distance that tightens or widens with market energy.
⚪ Buy/Sell Signal Engine (Regular / Plus / Strong)
The signal system that classifies entries by strength and confirmation level. It reacts to real-time trend changes while filtering weak reversals.
Calculation: Detects state flips in the Range & Trend Core, checks for agreement with the buffer, and rates each signal by historical pattern support. Higher-grade signals appear only when several layers confirm continuation strength.
⚪ Range Levels & Candles
Identifies short-term balance zones and highlights candles within those areas. These zones show where price pauses before the next directional move.
Calculation: Finds upper and lower range limits based on recent highs and lows, confirming only when several bars form a stable zone. Candle colors and level lines extend slightly forward to show likely reaction areas.
⚪ Swing Points & Peak Profit
Marks key turning points and measures performance since the last reversal. It helps track the strength and duration of each movement.
Calculation: Keeps a short memory of recent pivots and updates only when a new high or low replaces the last one. The percent distance from the last flip to the current bar defines the live Peak Profit reading.
⚪ Timeframe Scanner & Alert Aggregator
Combines directional data from multiple timeframes into a single view. Alerts trigger only when all selected timeframes agree.
Calculation: Gathers the trend state from each timeframe, converts it to a simple up or down value, and compares the results. When every layer matches your chosen direction, one clear, high-confidence alert is sent.
-----------------
Disclaimer
The content provided in my scripts, indicators, ideas, algorithms, and systems is for educational and informational purposes only. It does not constitute financial advice, investment recommendations, or a solicitation to buy or sell any financial instruments. I will not accept liability for any loss or damage, including without limitation any loss of profit, which may arise directly or indirectly from the use of or reliance on such information.
All investments involve risk, and the past performance of a security, industry, sector, market, financial product, trading strategy, backtest, or individual's trading does not guarantee future results or returns. Investors are fully responsible for any investment decisions they make. Such decisions should be based solely on an evaluation of their financial circumstances, investment objectives, risk tolerance, and liquidity needs.
Skrip berbayar
