Open Interest Weighted Average Price [Arjo]Open Interest Weighted Average Price , or OIWAP , is a simple visual indicator that shows the average price of an asset based on changes in open interest .
Instead of using trading volume like VWAP, this indicator gives more weight to prices where new futures contracts are being added or removed . This helps highlight the price levels where traders are actively building or closing positions.
The indicator shows:
A main line that represents the average price weighted by open interest changes.
Upper and lower bands (standard deviation bands) that show how far the price moves away from this average.
OIWAP is mainly useful for NSE futures markets , where open interest data is available. It helps traders visually understand where most market participation and positioning are taking place relative to price .
Concepts:
Applies statistical concepts, including weighted averaging and standard deviation, to open interest data
Uses the absolute change in open interest as a weighting factor for each price point
Creates a dynamic average that reflects where significant open interest activity has occurred during a given period
Standard deviation bands are computed from this weighted average to show the statistical spread of prices around the OIWAP line
Resets calculations based on user-selected time periods (daily, weekly, monthly, or session-based)
Allows for fresh analysis at regular intervals
Similar concept to volume-weighted average price (VWAP) indicators, but uses open interest changes as the weighting component
Features:
Weighted Average: Calculates a central line based on contract activity.
Flexible Anchors: Allows users to choose the reset period for the calculation.
Volatility Bands: Displays outer and mid-bands to visualize price stretches.
Data Check: Built-in alerts notify you if Open Interest data is missing for a symbol.
Visual Zones: Color-coded areas help identify price location at a glance.
How To Use
When you add the indicator to your chart, you will see:
A main OIWAP line — the open-interest-weighted price level
Mid-bands around the line (±0.5 standard deviations)
Outer bands farther away (±2.0 standard deviations)
Shaded background zones between these lines
You can:
Change the reset period to see how the average behaves over different time ranges
Adjust the timeframe for open-interest data
Turn mid-bands on or off
Adjust colors and styles to improve readability
Conclusion
The OIWAP indicator serves as an educational tool for visualizing the relationship between price movements and open interest activity in futures markets
Presents a weighted average price line along with statistical deviation bands
Offers a structured framework for chart analysis
Customizable settings allow users to adapt the display to their analytical preferences
Maintains focus on visual interpretation rather than directional predictions
Functions as a supplementary charting overlay that may complement other forms of technical and fundamental analysis
Disclaimer
This indicator is for educational and visual-analysis purposes only. It does not provide trading signals, financial advice, or guaranteed outcomes . You should perform your own research and consult a licensed financial professional when needed. All trading decisions are solely the responsibility of the user.
Band

KC Multi-TF ATR TableThis indicator is a comprehensive risk management tool designed to help traders gauge market volatility and determine rational Take Profit (TP) and Stop Loss (SL) levels. It allows you to analyze both the current timeframe and higher timeframes (15m, 1H, 4H, Daily) at a single glance.
Key Features:
Multi-Timeframe (MTF) Dashboard:
Displays ATR (Average True Range) values for fixed periods: 15 Minutes, 1 Hour, 4 Hours, and Daily, alongside your current chart timeframe.
Allows you to monitor whether general market volatility is expanding or contracting from a single panel.
Auto TP & SL Calculation:
Lists potential Long and Short targets for each timeframe based on your custom ATR multipliers.
Logic:
Buy TP: Close Price + (ATR x TP Multiplier)
Buy SL: Close Price - (ATR x SL Multiplier)
(Inverted logic applies for Sell setups.)
Dynamic On-Chart Lines:
Draws the calculated TP and SL levels directly on the chart for the current timeframe.
Lines extend 10 bars into the future, providing a visual reference for how close the price is to your targets.
Full Customization:
Calculation: You can adjust the ATR period and TP/SL multipliers to fit your strategy.
Visuals: Table position, text size, and all colors (buy, sell, background) can be personalized via the settings menu.
How to Use:
Trend Following: If ATR values on higher timeframes are increasing, it may indicate a strengthening trend.
Risk Management: Check the SL levels in the table before entering a trade to adjust your stop loss dynamically based on volatility.
Scalping: Use the on-chart lines as dynamic targets during support/resistance breakouts.

SuperBandsI've been seeing a lot of volatility band indicators pop up recently, and after watching this trend for a while, I figured it was time to throw my two chips in. The original spark for this idea came years ago from RicardoSantos's Vector Flow Channel script, which used decay channels with timed events in an interesting way. That concept stuck with me, and I kept thinking about how to build something that captured the same kind of dynamic envelope behavior but with a different mathematical foundation. What I ended up with is a hybrid that takes the core logic of supertrend trailing stops, smooths them heavily with exponential moving averages, and wraps them in Donchian-style filled bands with momentum-based color gradients.
The basic mechanism here is pretty straightforward. Standard supertrend calculates a trailing stop based on ATR offset from price, then flips direction when price crosses the trail. This implementation does the same thing but adds EMA smoothing to the trail calculation itself, which removes a lot of the choppiness you get from raw supertrend during sideways periods. The smoothing period is adjustable, so you can tune how reactive versus stable you want the bands to be. Lower smoothing values make the bands track price more aggressively, higher values create wider, slower-moving envelopes that only respond to sustained directional moves.
Where this diverges from typical supertrend implementations is in the visual presentation and the separate treatment of bullish and bearish conditions. Instead of a single flipping line, you get persistent upper and lower bands that each track their own trailing stops independently. The bullish band trails below price and stays active as long as price doesn't break below it. The bearish band trails above price and remains active until price breaks above. Both bands can be visible simultaneously, which gives you a dynamic channel that adapts to volatility on both sides of price action. When price is trending strongly, one band will dominate and the other will disappear. During consolidation, both bands tend to compress toward price.
The color gradients are calculated by measuring the rate of change in each band's position and converting that delta into an angle using arctangent scaling. Steeper angles, which correspond to the band moving quickly to catch up with accelerating price, get brighter colors. Flatter angles, where the band is moving slowly or staying relatively stable, fade toward more muted tones. This gives you a visual sense of momentum within the bands themselves, not just from price movement. A rapidly brightening band often precedes expansion or breakout conditions, while fading colors suggest the trend is losing steam or entering consolidation.
The filled regions between price and each band serve a similar function to Donchian channels or Keltner bands, creating clearly defined zones that represent normal price behavior relative to recent volatility. When price hugs one band and the fill area compresses, you're in a strong directional regime. When price bounces between both bands and the fills expand, you're in a ranging environment. The transparency gradients in the fills make it easier to see when price is near the edge of the envelope versus safely inside it.
Configuration is split between bullish and bearish settings, which lets you asymmetrically tune the indicator if you find that your market or timeframe has different characteristics in uptrends versus downtrends. You can adjust ATR period, ATR multiplier, and smoothing independently for each direction. This flexibility is useful for instruments that exhibit different volatility profiles during bull and bear phases, or for strategies that want tighter trailing on longs than shorts, or vice versa.
The ATR period controls the lookback window for volatility measurement. Shorter periods make the bands react quickly to recent volatility spikes, which can be beneficial in fast-moving markets but also leads to more frequent whipsaws. Longer periods smooth out volatility estimates and create more stable bands at the cost of slower adaptation. The multiplier scales the ATR offset, directly controlling how far the bands sit from price. Smaller multipliers keep the bands tight, triggering more frequent direction changes. Larger multipliers create wider envelopes that give price more room to move without breaking the trail.
One thing to note is that this indicator doesn't generate explicit buy or sell signals in the traditional sense. It's a regime filter and envelope tool. You can use band breaks as directional cues if you want, but the primary value comes from understanding the current volatility environment and whether price is respecting or violating its recent behavioral boundaries. Pairing this with momentum oscillators or volume analysis tends to work better than treating band breaks as standalone entries.
From an implementation perspective, the supertrend state machine tracks whether each direction's trail is active, handles resets when price breaks through, and manages the EMA smoothing on the trail points themselves rather than just post-processing the supertrend output. This means the smoothing is baked into the trailing logic, which creates a different response curve than if you just applied an EMA to a standard supertrend line. The angle calculations use RMS estimation for the delta normalization range, which adapts to changing volatility and keeps the color gradients responsive across different market conditions.
What this really demonstrates is that there are endless ways to combine basic technical concepts into something that feels fresh without reinventing mathematics. ATR offsets, trailing stops, EMA smoothing, and Donchian fills are all standard building blocks, but arranging them in a particular way produces behavior that's distinct from each component alone. Whether this particular arrangement works better than other volatility band systems depends entirely on your market, timeframe, and what you're trying to accomplish. For me, it scratched the itch I had from seeing Vector Flow years ago and wanting to build something in that same conceptual space using tools I'm more comfortable with.

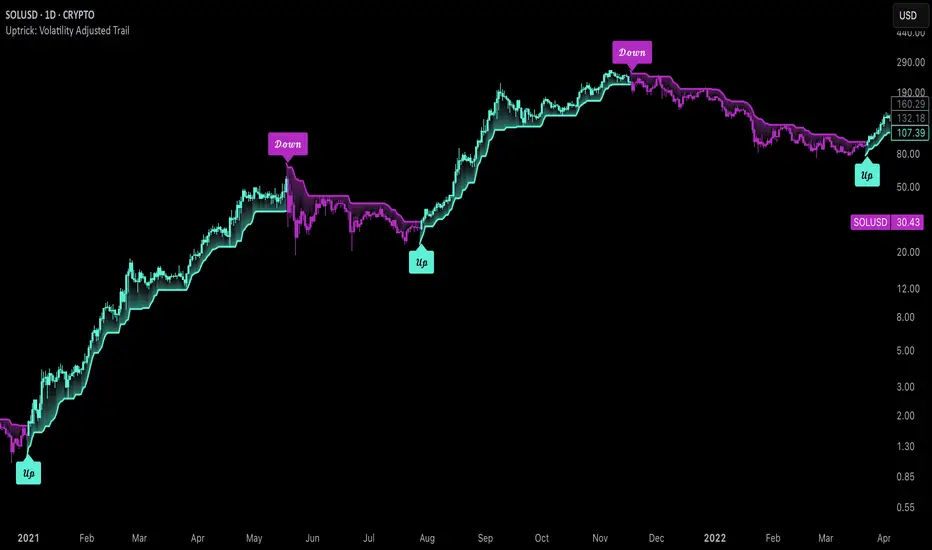
Uptrick: Volatility Adjusted TrailIntroduction
The "Uptrick: Volatility Adjusted Trail" is a dynamic trailing band indicator. It adapts in real time to changing market conditions by adjusting both to volatility and trend consistency. Inspired by Supertrend-style logic, it enhances traditional approaches by introducing adaptive mechanisms for more context-sensitive behavior in both trending and consolidating environments.
Overview
This indicator combines an exponential moving average (EMA) as its basis with an Average True Range (ATR)-derived multiplier that adjusts dynamically. Unlike fixed-multiplier tools, this indicator modifies its band distances in real time according to volatility expansion and trend persistence. The result is a trailing system that adapts to the prevailing market regime, providing traders with clearer signals for trend bias, stop placement, and potential momentum shifts.
Originality
The script’s originality lies in its multi-layered approach to trail calculation. It introduces a real-time ATR multiplier adjustment driven by two factors: a volatility expansion ratio and a trend persistence model. The expansion ratio compares the current ATR to its moving average, making the indicator more sensitive during volatile conditions and less sensitive during quieter periods. The trend persistence model assesses directional consistency to widen the bands during sustained trends. This dual adjustment method creates a system that evolves with market behavior, making it more responsive and adaptive than static-band or fixed-multiplier alternatives.
Components & Inspiration
This indicator was designed with specific components that work together:
Exponential Moving Average (EMA): Chosen as the central baseline because it responds faster to recent price changes than a simple moving average, providing a more current reference for trailing bands.
Average True Range (ATR): Used as the volatility measure because it accounts for both intraday and gap movement, making it a robust and widely accepted standard for market volatility.
Dynamic Multiplier: The multiplier is adjusted by both volatility expansion and trend persistence to produce bands that tighten during low volatility and widen during consistent trends. This combination was chosen to give the indicator the ability to self-regulate across different market regimes.
Trend Persistence Model: Integrated to assess directional consistency, ensuring the bands expand during strong trends, which can prevent premature stop-outs.
Flip Confirmation Logic: Added to filter out noise by requiring multiple bar closes beyond a band before confirming a state change, reducing false reversals.
For inspiration, the indicator draws on the core idea behind Supertrend—using a baseline and volatility-derived bands to define trailing stop levels. However, while Supertrend uses a fixed ATR multiplier, this indicator introduces a dynamic multiplier system and persistence weighting, making it more adaptive and suited for varying conditions.
Inputs and Parameters
Basis EMA Length
Defines the period for the EMA that serves as the core price reference.
ATR Length
Sets the lookback period for the Average True Range calculation used in band spacing.
Base ATR Mult
The base multiplier applied to ATR before adjustments. Forms the starting scale of the band offset.
Volatility Expansion Sensitivity
Controls how strongly the band spacing reacts to short-term volatility bursts. Higher values create more pronounced band expansions or contractions.
Trend Persistence Window
Determines how many bars are used to calculate directional trend consistency using a smoothed step function.
Persistence Impact
Scales how much influence the trend persistence has on band widening. Values range from 0 (no effect) to 1 (maximum effect).
Min Effective Mult
Sets the minimum value that the adjusted multiplier can reach. Prevents the bands from becoming too narrow.
Max Effective Mult
Sets the maximum value the adjusted multiplier can reach. Prevents the bands from over-expanding during high volatility.
Bars Above/Below to Confirm Flip
Number of consecutive bars required to close above or below the opposing trail before confirming a bullish or bearish flip. Helps reduce noise and false signals.
Show Flip Labels
Enables or disables the display of flip markers on the chart.
Label Size
Allows users to adjust the size of flip labels from Tiny to Huge.
Label ATR Offset
Adjusts the vertical placement of flip labels in relation to the trail using an ATR-based offset.
Features and Logic
EMA Basis: All calculations stem from an EMA that tracks the centerline of price action.
Dynamic ATR Multiplier: The ATR multiplier adjusts in real time based on volatility expansion and trend persistence.
Clamped Multiplier: The adjusted multiplier is limited between user-defined minimum and maximum values to keep the band scale practical.
Upper and Lower Bands: Bands are plotted above and below the EMA using the dynamic multiplier and ATR values.
Trailing Logic: The script uses Supertrend-style trailing logic, updating the active band in the current trend direction and resetting the opposite band.
Trend State Detection: A state variable tracks the current market regime (bullish, bearish, or neutral). Transitions are confirmed only after a user-specified number of bars close beyond the respective bands.
Visual Elements: Trail lines and fill zones are color-coded (bullish cyan, bearish magenta). Candlestick and bar colors match the trend state. Optional flip labels mark confirmed transitions.
Alerts: Built-in alert conditions allow users to receive real-time notifications for bullish or bearish flips.
Usage Guidelines
This indicator can be used for:
Defining context-aware dynamic stop levels that adjust with market behavior.
Identifying trend direction and reversal points based on adaptive logic.
Filtering entry or exit signals during trending vs. consolidating conditions.
Supplementing trade management strategies with responsive visual markers.
Entering long or short positions based on the appearance of flip labels and managing stop losses by following the adaptive trail.
Traders may tune the parameters to suit different trading styles or timeframes. For example, lower ATR and EMA values may suit intraday setups, while longer settings may benefit swing or positional trading.
Summary
The "Uptrick: Volatility Adjusted Trail" provides a flexible, adaptive trailing band system that accounts for both volatility and directional consistency. By combining an EMA baseline with a dynamic ATR multiplier influenced by volatility expansion and trend persistence, it creates a context-sensitive trailing system that aligns with changing market conditions. Customizable confirmation, flip labels, alerts, and dynamic visual cues make it a versatile tool for trend-following, breakout filtering, and trailing stop logic.
Disclaimer
This indicator is provided for educational and research purposes only. It does not constitute financial advice. Trading involves risk, and past performance does not guarantee future results. Always conduct your own analysis and risk management before making trading decisions.
Uptrick: Volatility Weighted CloudIntroduction
The Volatility Weighted Cloud (VWC) is a trend-tracking overlay that combines adaptive volatility-based bands with a multi-source smoothed price cloud to visualize market bias. It provides users with a dynamic structure that adapts to volatility conditions while maintaining a persistent visual record of trend direction. By incorporating configurable smoothing techniques, percentile-ranked volatility, and multi-line cloud construction, the indicator allows traders to interpret price context more effectively without relying on raw price movement alone.
Overview
The script builds a smoothed price basis using the open, and close prices independently, and uses these to construct a layered visual cloud. This cloud serves both as a reference for price structure and a potential area of dynamic support and resistance. Alongside this cloud, adaptive upper and lower bands are plotted using volatility that scales with percentile rank. When price closes above or below these bands, the script interprets that as a breakout and updates the trend bias accordingly.
Candle coloring is persistent and reflects the most recent confirmed signal. Labels can optionally be placed on the chart when the trend bias flips, giving traders additional visual reference points. The indicator is designed to be both flexible and visually compact, supporting different strategies and timeframes through its detailed configuration options.
Originality
This script introduces originality through its combined use of percentile-ranked volatility, adaptive envelope sizing, and multi-source cloud construction. Unlike static-band indicators, the Volatility Weighted Cloud adjusts its band width based on where current volatility ranks within a defined lookback range. This dynamic scaling allows for smoother signal behavior during low-volatility environments and more responsive behavior during high-volatility phases.
Additionally, instead of using a single basis line, the indicator computes two separate smoothed lines for open and close. These are rendered into a shaded visual cloud that reflects price structure more completely than traditional moving average overlays. The use of ALMA and MAD, both less commonly applied in volatility-band overlays, adds further control over smoothing behavior and volatility measurement, enhancing its adaptability across different market types.
Inputs
Group: Core
Basis Length (short-term): The number of bars used for calculating the primary basis line. Affects how quickly the basis responds to price changes.
Basis Type: Option to choose between EMA and ALMA. EMA provides a standard exponential average; ALMA offers a centered, Gaussian-weighted average with reduced lag.
ALMA Offset: Determines the balance point of the ALMA window. Only applies when ALMA is selected.
Sigma: Sets the width of the ALMA smoothing window, influencing how much smoothing is applied.
Basis Smoothing EMA: Adds additional EMA-based smoothing to the computed basis line for noise reduction.
Group: Volatility & Bands
Volatility: Choose between StDev (standard deviation) and MAD (median absolute deviation) for measuring price volatility.
Vol Length (short-term): Length of the window used for calculating volatility.
Vol Smoothing EMA: Smooths the raw volatility value to stabilize band behavior.
Min Multiplier: Minimum multiplier applied to volatility when forming the adaptive bands.
Max Multiplier: Maximum multiplier applied at high volatility percentile.
Volatility Rank Lookback: Number of bars used to calculate the percentile rank of current volatility.
Show Adaptive Bands: Enables or disables the display of upper and lower volatility bands on the chart.
Group: Trend Switch Labels
Show Trend Switch Labels: Toggles the appearance of labels when the trend direction changes.
Label Anchor: Defines whether the labels are anchored to recent highs/lows or to the main basis line.
ATR Length (offset): Length used for calculating ATR, which determines label offset distance.
ATR Offset (multiplier): Multiplies the ATR value to place labels away from price bars for better visibility.
Label Size: Allows selection of label size (tiny to huge) to suit different chart setups.
Features
Adaptive Volatility Bands: The indicator calculates volatility using either standard deviation or MAD. It then applies an EMA smoothing layer and scales the band width dynamically based on the percentile rank of volatility over a user-defined lookback window. This avoids fixed-width bands and allows the indicator to adapt to changing volatility regimes in real time.
Volatility Method Options: Users can switch between two volatility measurement methods:
➤ Standard Deviation (StDev): Captures overall price dispersion, but may be sensitive to spikes.
➤ Median Absolute Deviation (MAD): A more robust measure that reduces the effect of outliers, making the bands less jumpy during erratic price behavior.
Basis Type Options: The core price basis used for cloud and bands can be built from:
➤ Exponential Moving Average (EMA): Fast-reacting and widely used in trend systems.
➤ Arnaud Legoux Moving Average (ALMA): A smoother, more centered alternative that offers greater control through offset and sigma parameters.
Multi-Line Basis Cloud: The cloud is formed by plotting two individually smoothed basis lines from open and close prices. A filled area is created between the open and close basis lines. This cloud serves as a dynamic support or resistance zone, allowing users to identify possible reversal areas. Price moving through or rejecting from the cloud can be interpreted contextually, especially when combined with band-based signals.
Persistent Trend Bias Coloring: The indicator uses the last confirmed breakout (above upper band or below lower band) to determine bias. This bias is reflected in the color of every subsequent candle, offering a persistent visual cue until a new signal is triggered. It helps simplify trend recognition, especially in choppy or sideways markets.
Trend Switch Labels: When enabled, the script places labeled markers at the exact bar where the bias direction switches. Labels are anchored either to recent highs/lows or to the main basis line, and spaced vertically using an ATR-based offset. This allows the trader to quickly locate historical trend transitions.
Alert Conditions: Two built-in alert conditions are available:
➤ Long Signal: Triggered when the close crosses above the upper adaptive band.
➤ Short Signal: Triggered when the close crosses below the lower adaptive band.
These conditions can be used for custom alerts, automation, or external signaling tools.
Display Control and Flexibility: Users can disable the adaptive bands for a cleaner layout while keeping the basis cloud and candle coloring active. The indicator can be tuned for fast or slow response depending on the strategy in use, and is suitable for intraday, swing, or position trading.
Summary
The Volatility Weighted Cloud is a configurable trend-following overlay that uses adaptive volatility bands and a structured cloud system to help visualize market bias. By combining EMA or ALMA smoothing with percentile-ranked volatility and a four-line price structure, it provides a flexible and informative charting layer. Its key strengths lie in the use of dynamic envelopes, visually persistent trend indication, and clearly defined breakout zones that adapt to current volatility conditions.
Disclaimer
This indicator is for informational and educational purposes only. Trading involves risk and may not be suitable for all investors. Past performance does not guarantee future results.

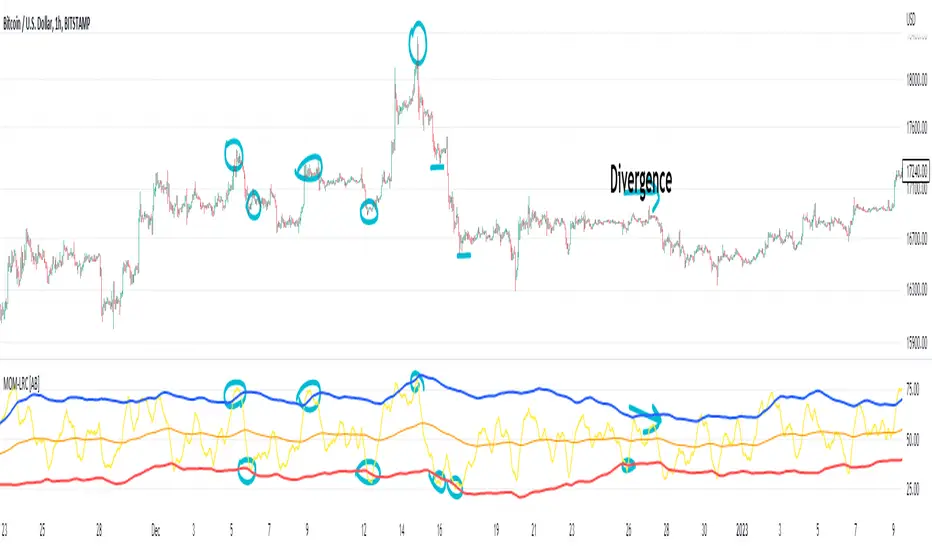
Manipulation Ribbon [FxScripts]Manipulation Ribbon
Designed to detect areas of price manipulation by Market Makers vs areas where it is trading in a natural, price-driven state. By identifying zones of control and imbalance, the ribbon provides a clear visualization of where price is being held or artificially displaced, offering key insights into potential future direction.
Indicator Function
Unlike traditional oscillators, the Manipulation Ribbon plots a continuous line or ribbon, with no defined y-axis. The ribbon dynamically adapts to market conditions, allowing the user to spot potential manipulation and price containment vs natural price movement.
Calculation Methodology
The Manipulation Ribbon is derived exclusively from price action. The underlying algorithm evaluates where price is, where it should be and where it’s being held.
The resulting ribbon reflects these dynamics in real time, providing a visual framework for interpreting price behavior at a granular level.
Operational Use: Divergences
The primary use of the Manipulation Ribbon is to locate divergences between price and the ribbon.
There are two distinct types of divergence to look for:
Price Containment: Where the ribbon moves but price doesn’t. This can help identify zones where price is being held, often preceding sharp movements once control is released.
Price Manipulation: Where price moves but the ribbon doesn’t. This can help identify liquidity sweeps, often preceding swift reversals once the liquidity has been taken.
Analytical Scenarios
High Liquidity Sweep: Price forms a higher high while the ribbon forms a lower high. Indicates a liquidity sweep may be occurring at the highs and a potential bearish reversal may be imminent.
Low Liquidity Sweep: Price forms a lower low while the ribbon forms a higher low. Indicates a liquidity sweep may be occurring at the lows and a potential bullish reversal may be imminent.
Top Edge Hold: Upwards movement of the ribbon without price followthrough. Indicates price may be being held at the highs, suggesting Market Makers are artificially holding price down in order to create a top edge and potential bearish reversal.
Bottom Edge Hold: Downwards movement of the ribbon without price followthrough. Indicates price may be being held at the lows, suggesting Market Makers are artificially holding price up in order to create a bottom edge and potential bearish reversal.
Settings
Guides: Option to have dynamic guides applied to your chart. Customizable style, color and width.
Guide Lookback: Due to the ribbon having a non-standard y-axis scale, it’s not possible to plot standard interval guides. Due to technical limitations this value is not calculable automatically either. The upper and lower bounds of the guides are therefore calculated using a user-inputted lookback function. In order to ensure the guides use the correct y-axis on the chart, simply input the average number of bars in your current viewport using the ruler, the guides will automatically update to match this.
Line 1 / Band 1: Option to turn on/off Line 1 and Band 1 alongside updating color and linewidth. Line 1 and Band 1 use the current chart symbol as their source.
Line 2 / Band 2: Option to add a second line and/or band to the chart. Use this to compare any correlated instrument e.g. BTCUSDT and ETHUSDT (as visualized in the chart above) or other pairs such as XAUUSD/XAUEUR or ES/NQ. Due to differences in y-axis scaling it's advised to add this as an additional indicator on a new pane (as per chart above).
Inverse Line 2 / Band 2: Option to show/hide the inverse of Line 2 and Band 2. This is useful for comparing inversely correlated symbols e.g. EURUSD and USDCHF.
Performance and Optimization
Backtesting Results: The Manipulation Ribbon has undergone extensive backtesting across various instruments, timeframes and market conditions, demonstrating strong performance in identifying where price is out of sync with its natural state. User backtesting is strongly encouraged as it allows traders to gain familiarity with the ribbon using their preferred instruments and timeframes.
Optimization for Diverse Markets: The Manipulation Ribbon can be used on crypto, forex, indices, commodities and stocks. The Manipulation Ribbon's algorithmic foundation ensures consistent performance across a variety of instruments. The lack of complex settings makes it easy for the trader to set up and go.
Educational Resources and Support
Users of the Manipulation Ribbon benefit from comprehensive educational resources and full access to FxScripts Support. This ensures traders can maximize the potential of the Manipulation Ribbon and other tools in the Sigma Indicator Suite by learning best practices and gaining insights from an experienced team of traders.

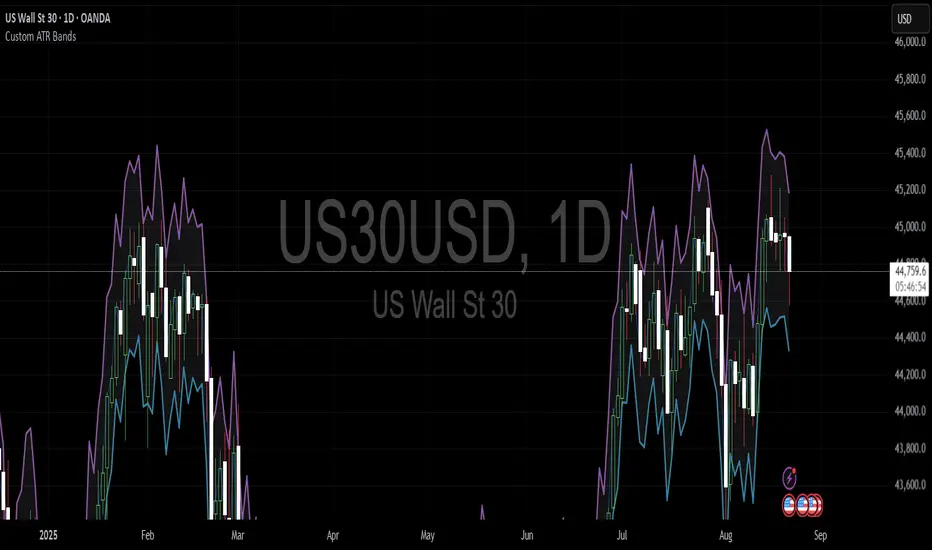
Custom ATR BandsThis indicator provides a customisable, easy to view band around the price, based on the ATR. The ATR length and multiplier can be adjusted.
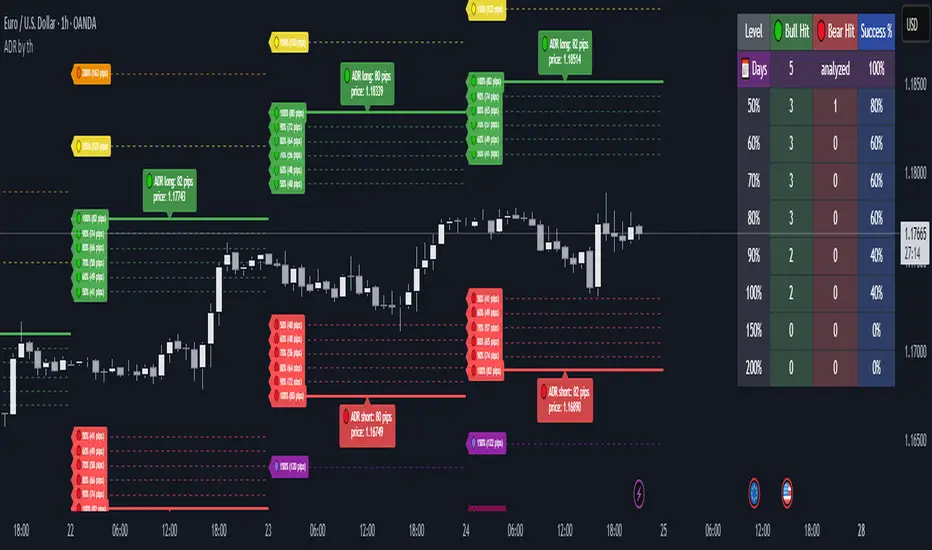
Average Daily Range ADR by thSpecial for Amer and ATR testing and some text for description which I will add a little bit later because beatiful tv can't pass my indicator to be published
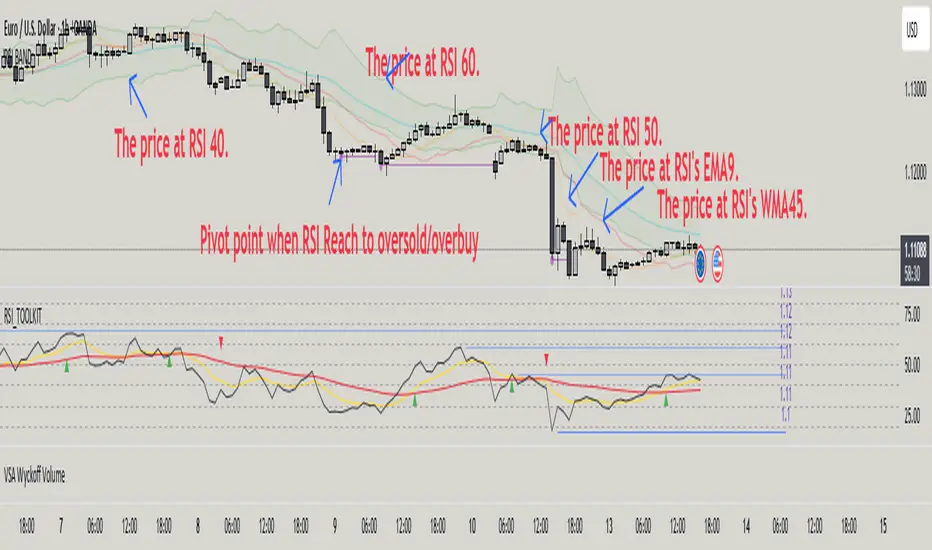
RSI BAND – RSI-Based Support & Resistance Levels📃 Description
RSI BAND is an original technical analysis tool that builds support and resistance levels based on the RSI (Relative Strength Index) indicator. This script is designed to enhance traders' understanding of RSI behavior and provide potential price zones where reversals or continuations may occur.
🔍 What it does
Calculates and visualizes horizontal levels on the price chart corresponding to RSI-based thresholds (e.g., RSI = 40, 50, 60).
Calculates and visualizes horizontal levels on the price chart corresponding to RSI's EMA9 & WMA45.
Detects pivot highs and lows in the RSI and marks corresponding price levels.
🎯 Key Features
🔺 RSI Resistance (e.g., RSI 60) and 🔻 RSI Support (e.g., RSI 40) levels calculated as price zones.
📉 Real-time calculation of price levels that correspond to RSI EMA (9) and RSI WMA (45).
🌀 Detects RSI Pivot Lows and Pivot Highs.
🎯 Includes alerts for Pivot points.
🧩 Fully configurable visibility and styling options for each plotted level.
🔬 How to read data
✅ How to Use
Use this indicator to:
See price action at key RSI levels (40, 50, 60) and RSI's EMA & WMA: For setting up reversal entries.
Identify RSI's pivot points at overbought or oversold levels: For setting up divergence entries.
📊 Visualizing RSI-Based Levels for Price Action
This script plots key RSI-based levels directly onto the chart, such as RSI support, resistance, and the 50-level, to help traders to easily see price action at key RSI zones.
The RSI Resistance and RSI Support levels (such as RSI = 60 and RSI = 40), RSI's EMA9 & WMA45 are plotted on the chart. These levels act as significant price action zones, where traders can anticipate potential reactions from the price based on the RSI's behavior.
By visualizing these levels as plots on the chart, traders can quickly see where price is in relation to these key RSI thresholds, allowing them to make more informed decisions when the price approaches these zones. For example, if the price is near the RSI resistance zone (RSI = 60), it might indicate a potential resistance area where the price could face selling pressure.
By utilizing these RSI-based plots, this script provides a clear, visual representation of key levels, enabling traders to make quicker and more confident decisions in relation to the price action and RSI dynamics.
🧠 Underlying Logic
The script uses standard RSI calculation (length = 14), combined with a reverse-engineered formula to calculate the required price change to reach a specific RSI value. This unique approach creates realistic price levels aligned with RSI expectations, unlike traditional static zones.
Function to calculate price from RSI level:
f_calc_target_price(targetRSI, close_price, avgGain, avgLoss, rsiLength) =>
targetRS = 100 / (100 - targetRSI) - 1
if targetRSI >= 50
requiredGain = targetRS * avgLoss - avgGain
requiredChange = requiredGain * rsiLength
close_price + requiredChange
else
requiredLoss = avgGain / targetRS - avgLoss
requiredChange = requiredLoss * rsiLength
close_price - requiredChange
Depending on whether the target RSI is above or below 50:
If RSI ≥ 50, the function estimates the additional gain needed to raise the RSI to the target, and adds the corresponding value to the current price.
If RSI < 50, it estimates the required loss and subtracts that value from the current price.
⚠️ Important Notes
Pivot Detection Offset: The script uses an offset of 3 bars to identify pivot points. This means that the pivot high and low points are calculated using the values from 3 bars before the current one. As a result, the pivot points may appear slightly delayed compared to the most recent price action.
No Lookahead Bias: The script does not rely on future data (lookahead bias). It strictly uses past price information for all calculations to maintain accuracy and avoid misleading results. The pivot points are plotted after the price has already formed, ensuring that the script does not predict future price movement but rather reacts to established patterns.
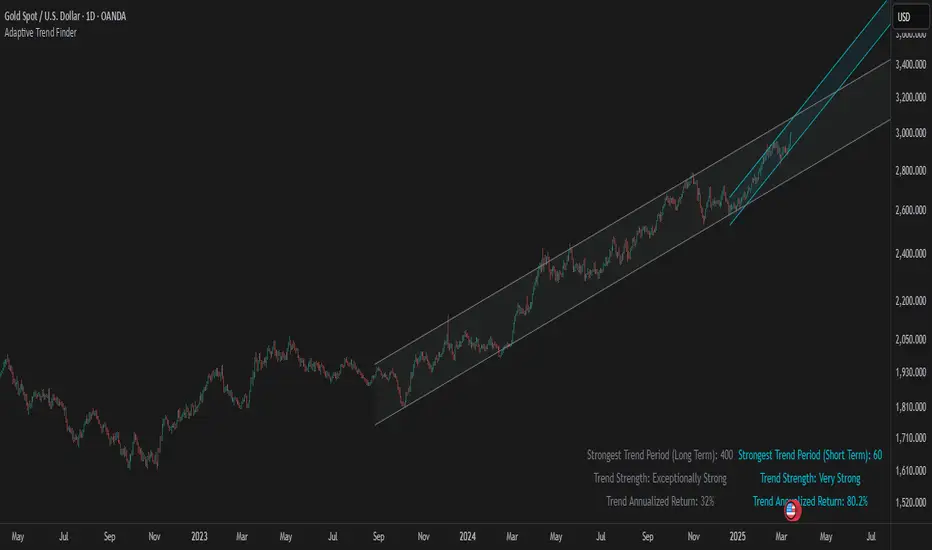
Adaptive Trend FinderAdaptive Trend Finder - The Ultimate Trend Detection Tool
Introducing Adaptive Trend Finder, the next evolution of trend analysis on TradingView. This powerful indicator is an enhanced and refined version of Adaptive Trend Finder (Log), designed to offer even greater flexibility, accuracy, and ease of use.
What’s New?
Unlike the previous version, Adaptive Trend Finder allows users to fully configure and adjust settings directly within the indicator menu, eliminating the need to modify chart settings manually. A major improvement is that users no longer need to adjust the chart's logarithmic scale manually in the chart settings; this can now be done directly within the indicator options, ensuring a smoother and more efficient experience. This makes it easier to switch between linear and logarithmic scaling without disrupting the analysis. This provides a seamless user experience where traders can instantly adapt the indicator to their needs without extra steps.
One of the most significant improvements is the complete code overhaul, which now enables simultaneous visualization of both long-term and short-term trend channels without needing to add the indicator twice. This not only improves workflow efficiency but also enhances chart readability by allowing traders to monitor multiple trend perspectives at once.
The interface has been entirely redesigned for a more intuitive user experience. Menus are now clearer, better structured, and offer more customization options, making it easier than ever to fine-tune the indicator to fit any trading strategy.
Key Features & Benefits
Automatic Trend Period Selection: The indicator dynamically identifies and applies the strongest trend period, ensuring optimal trend detection with no manual adjustments required. By analyzing historical price correlations, it selects the most statistically relevant trend duration automatically.
Dual Channel Display: Traders can view both long-term and short-term trend channels simultaneously, offering a broader perspective of market movements. This feature eliminates the need to apply the indicator twice, reducing screen clutter and improving efficiency.
Fully Adjustable Settings: Users can customize trend detection parameters directly within the indicator settings. No more switching chart settings – everything is accessible in one place.
Trend Strength & Confidence Metrics: The indicator calculates and displays a confidence score for each detected trend using Pearson correlation values. This helps traders gauge the reliability of a given trend before making decisions.
Midline & Channel Transparency Options: Users can fine-tune the visibility of trend channels, adjusting transparency levels to fit their personal charting style without overwhelming the price chart.
Annualized Return Calculation: For daily and weekly timeframes, the indicator provides an estimate of the trend’s performance over a year, helping traders evaluate potential long-term profitability.
Logarithmic Adjustment Support: Adaptive Trend Finder is compatible with both logarithmic and linear charts. Traders who analyze assets like cryptocurrencies, where log scaling is common, can enable this feature to refine trend calculations.
Intuitive & User-Friendly Interface: The updated menu structure is designed for ease of use, allowing quick and efficient modifications to settings, reducing the learning curve for new users.
Why is this the Best Trend Indicator?
Adaptive Trend Finder stands out as one of the most advanced trend analysis tools available on TradingView. Unlike conventional trend indicators, which rely on fixed parameters or lagging signals, Adaptive Trend Finder dynamically adjusts its settings based on real-time market conditions. By combining automatic trend detection, dual-channel visualization, real-time performance metrics, and an intuitive user interface, this indicator offers an unparalleled edge in trend identification and trading decision-making.
Traders no longer have to rely on guesswork or manually tweak settings to identify trends. Adaptive Trend Finder does the heavy lifting, ensuring that users are always working with the strongest and most reliable trends. The ability to simultaneously display both short-term and long-term trends allows for a more comprehensive market overview, making it ideal for scalpers, swing traders, and long-term investors alike.
With its state-of-the-art algorithms, fully customizable interface, and professional-grade accuracy, Adaptive Trend Finder is undoubtedly one of the most powerful trend indicators available.
Try it today and experience the future of trend analysis.
This indicator is a technical analysis tool designed to assist traders in identifying trends. It does not guarantee future performance or profitability. Users should conduct their own research and apply proper risk management before making trading decisions.
// Created by Julien Eche - @Julien_Eche
Volatility Price FlowCapitalize on market volatility with our new volatility price flow indicator. We have designed this indicator to process historical price movements and indicate when price may have reached exhaustion in the context of current volatility.
This is achieved by taking the price deviation from a user defined moving average, and applying a weighting to the deviations from the candle body and candle wick on both buy side and sell side, over a user defined period. The period of the base moving average, type of moving average and the period of the historical price deviations can all be modified. This creates a typical 'band' style indicator, though with a unique characteristic that the buy and sell side vary independently as well as the band expansion being based on weighted variables tied to the actual price changes, rather than just a standard deviation the moves uniformly.
Additionally, these bands can be merged with an anchored vwap - we do this so that the deviations of price from the moving average can include a more volume based approach to identifying potential pivots.
The end result is an indicator that reflects the current market price movements, identifies and capitalizes on impulsive or beginning moves to indicate potential tops / bottoms / reversals.
The signals are simple - anytime price closes within a band, having been outside the band, a signal is displayed. As a basic guide to setting the indicator up for the first time, we suggest reducing all of the multipliers to a value less than 1. Then gradually increase each one, until the signals reduce in quantity and improve in quality, starting with the price deviation multiplier, then the volatility multiplier and finally the expansion multiplier.
Last of all, alerts can be created based on the current chart timeframe and indicator settings, simply by adding an alert that uses the built in buy or sell signal.
Note: We cannot guarantee the accuracy of the signals provided, since the user creates the signals by modifying the settings, and as such we can take no responsibility for any trading losses incurred using the indicator and highly encourage all users to manage their risk and only risk what you can afford to lose.

Uptrick: Oracle Metrics +
Introduction
Uptrick: Oracle Metrics + is a multi-dimensional trading indicator designed to consolidate various technical and risk-oriented signals into one accessible framework. It allows traders to observe market volatility, identify potential reversal points, and assess numerous performance metrics, all within a single interface.
Purpose
The main goal of this indicator is to simplify a broad array of market insights. It merges trend analysis, volatility indicators, on-chart signals, and risk-performance metrics to help traders quickly evaluate the state of a market and make more informed decisions.
Features
1. Cloud Visualization
A colored cloud overlays the chart, indicating market conditions. When the cloud narrows, it can signal upcoming breakout scenarios, as volatility compresses and price movement may accelerate. In contrast, when the cloud is wide, this could hint at an extended trend that might be nearing a pullback or retracement. Observing shifts between narrow and wide phases helps anticipate shifts in momentum.
This can be seen here:
Simple Cloud Overlay
You can also use the cloud like this: when it turns purple you sell when it turns aqua color you buy. These signals are not very accurate in ranging markets but therefore they are usually better on almost all timeframes and assets in trending markets. :
Bounces of cloud. The cloud can also be used as a type of support/resistance. In the example below you can see how the trend bounces off of the cloud. For example, you could add up to your position every time it touches the cloud and then you could fully exit when the cloud turns purple or the trend breaks below the cloud:
An example of a way you could use this indicator as a confirmation is here. In the image below, a fake signal is generated, you can eliminate this signal by waiting for the cloud to turn purple in order to have confirmation for a potential downward move:
2. Bar Coloring for Volatility and System States
Traders can choose between two bar-coloring methods:
• Volatility: Bars change color intensity based on the level of current volatility relative to a historical average. This helps in spotting abrupt changes in market behavior, where bars become more pronounced when volatility is higher. You can see the volatility information in the volatility table.
• System Score: Bars receive a color gradient determined by the indicator’s final overall score. This simplifies spotting bullish, bearish, or neutral phases without needing to inspect multiple metrics separately. The closer the final score is to zero the less the color difference between bullish and bearish is.
3. Reversion Signals and Potential Reversal Alerts
Two sets of on-chart markers help in spotting sudden shifts in momentum:
• Reversion Signals marked with the letter R: These signals combine RSI thresholds, stochastic crossovers, and EMA confirmation to identify potential reversals. RSI highlights overbought (above 70) or oversold (below 30) conditions, while stochastic crossovers confirm shifts in momentum. The EMA ensures signals align with the broader trend, reducing false positives in volatile markets. Together, these components provide a reliable way to spot potential market corrections or reversals.
• Potential Reversal Signals marked with small circles: These signals detect subtle shifts in momentum using a smoothed RSI (via TEMA) and changes in its slope. When the slope turns positive or negative near key levels, it highlights early-stage reversals. This approach helps traders identify timely entry or exit opportunities by capturing potential trend changes before they fully develop.
4. Main Metrics Table
A primary dashboard shows detailed performance measures and market analytics. Next to each value, there is a bullish or bearish arrow to hint at the current direction of that metric. The table includes the following:
• Sharpe Ratio: Offers a view of risk-adjusted returns, hinting at whether rewards outweigh the variability in price.
• Sortino Ratio: A variation of risk-adjusted return focusing more on downside risk.
• Treynor Ratio: Displays returns relative to systematic risk, referencing a user-provided beta.
• Information Ratio: Shows how the instrument is outperforming or underperforming a benchmark, scaled by tracking error.
• ROC: Rate of change in price over a specified period, reflecting momentum.
• MACD Histogram: The difference between fast and slow moving average convergence, illustrating momentum shifts.
• CMF: Chaikin Money Flow, evaluating buying or selling pressure by combining price and volume.
• Ulcer Index: A measure of drawdown intensity to gauge how severe downtrends or pullbacks have been.
• Amihud Ratio: Assesses illiquidity by comparing price impact to volume.
• Market Depth Ratio: Looks at price ranges relative to volume activity, indicating how deeply the market can absorb trades.
• S2F Ratio: Incorporates the asset’s circulating supply relative to its yearly production, sometimes referenced in markets with a defined issuance schedule.
• NVT Ratio: A network value to transactions ratio, typically applied to on-chain data.
• MVRV Ratio: Compares the asset’s market value with its realized value, highlighting overall valuation conditions.
• Autocorrelation: Shows how current price movement may be echoing previous price changes.
• Alpha: Measures excess return over what might be expected from a risk-free rate plus systematic market exposure.
• Skewness: Reveals the asymmetry of the return distribution.
• Kurtosis: Looks at whether returns have heavier or lighter tails than typical distributions.
• Max Drawdown: The largest peak-to-trough drop within a lookback window, a key measure of downside risk.
• Calmar Ratio: Evaluates returns in light of drawdowns, relating performance to the severity of pullbacks.
• Omega Ratio: Considers gains versus losses around a threshold return level to measure reward-to-risk balance.
• January Performance: A snapshot of how price behaves in January over a lookback, connected to the idea of seasonality.
• Bid-Ask Spread: Reflects the percentage difference between highest and lowest price in a period, hinting at market liquidity costs.
5. Final Score Table
After analyzing individual metrics, the indicator calculates an overall score that determines if the broader environment appears bullish, bearish, or neutral. This final score then influences optional color schemes across the chart, allowing traders to see at a glance how multiple data points combine into one stance. For those who prefer a visual “gauge,” an additional grid table can be enabled, where boxes fill with varying color intensities based on the current score. The score calculation is complex and uses a similar technique to TPI. It assigns values to each metric and then divides the score by the amount of metrics. The score is then visualized in the System Generation bar coloring option according to how intense the signal is.
Grids (visualization of how much more the score needs to be a full signal.):
6. Volatility Table
A separate table focuses on how current volatility compares with an average measure. When current volatility differs significantly from historical norms, the bars become more vividly colored. If volatility nears its average, the bars are more subdued. This helps traders know when to be cautious of sudden moves or to adapt their position sizing.
Indicator Inputs
Users can tailor numerous inputs to suit the nature of each instrument:
• Risk-Free Rate (annualized rate used for risk calculations)
• Benchmark Return (expected return of the market benchmark)
• Beta (measure of systematic risk, particularly for Treynor Ratio calculations)
• Lookback Period (window of time used for many rolling calculations)
• ROC Period (time span for the rate of change calculation)
• CMF Period (window for the Chaikin Money Flow measure)
• Ulcer Index Period (depth for the Ulcer Index reading)
• Amihud Illiquidity Period (period for measuring price impact relative to volume)
• Market Depth Ratio Period (time range for examining price breadth versus volume)
• Circulating Supply (used for the stock-to-flow calculation)
• Yearly Production (helps update the stock-to-flow ratio)
• Market Cap (overall value of the instrument, often used in ratio metrics)
• Transaction Volume (on-chain or traded volume data for NVT ratio)
• Realized Value (alternative valuation data, used in MVRV calculation)
• Threshold Return for Omega (sets a custom threshold above which returns are considered favorable)
• Bar Coloring Method (choose between volatility-based or final-score-based color themes)
• Table Text Size (adjust the display size of table entries)
• Additional parameters related to internal signals (like RSI lengths or smoothing settings) can be fine-tuned for different market behaviors. It is important to customize these fields according to the characteristics of the specific asset you are trading.
Important!
Adjust the inputs according to your current asset! The inputs under the 'Vital' section have to be adjusted so that the metrics function properly. If not well adjusted to your asset, your final score will be mixed up and System Bar coloring as well! These inputs include: Circulating Supply, Yearly Production, Market Cap, Transaction Volume, and Realized Value!
Originality and Uniqueness
Uptrick: Oracle Metrics + stands out by combining complex metrics, including calculations similar to the Trend Probability Indicator (TPI), to provide a deeper analysis of market conditions. The indicator offers multiple signals tailored to different trading scenarios, allowing users to filter and customize them manually through a variety of features. This flexibility, combined with its advanced risk and trend analysis tools, makes it a versatile solution for both momentum and long-term trading strategies.
Warnings
In some scenarios, overlapping numbers or markers may crowd the chart. A practical fix for any visual overlap is removing the indicator and then reapplying it, which generally resets the tables and color overlays.
Summary
Uptrick: Oracle Metrics + merges cloud-based analytics, bar-coloring for volatility or system state, reversion alerts, and a detailed metrics dashboard into one seamless interface. This synergy of short-term signals and long-term performance metrics aims to give traders a fuller perspective on risk, trend changes, and valuation. By tuning the inputs to each asset, traders can capture more relevant data, while the color-coded approach simplifies quick decision-making in a dynamic market environment.
Disclaimer
The Uptrick: Oracle Metrics + indicator is a tool designed to assist traders in analyzing market conditions and making informed decisions. It is not a guarantee of future performance or a substitute for independent financial advice. Trading involves significant risk, and past results do not guarantee future outcomes. Users are advised to conduct their own research, consider their financial situation, and consult with a licensed financial professional if necessary. Uptrick and its affiliates are not responsible for any financial losses incurred while using this indicator. Use at your own discretion and risk.

Standard Deviation-Based Fibonacci Band by zdmre This indicator is designed to better understand market dynamics by focusing on standard deviation and the Fibonacci sequence. This indicator includes the following components to assist investors in analyzing price movements:
Weighted Moving Average (WMA) : The indicator creates a central band by utilizing the weighted moving average of standard deviation. WMA provides a more current and accurate representation by giving greater weight to recent prices. This central band offers insights into the general trend of the market, helping to identify potential buying and selling opportunities.
Fibonacci Bands : The Fibonacci bands located above and below the central band illustrate potential support and resistance levels for prices. These bands enable investors to pinpoint areas where the price may exhibit indecisiveness. When prices move within these bands, it may be challenging for investors to discern the market's preferred direction.
Indecisiveness Representation : When prices fluctuate between the Fibonacci bands, they may reflect a state of indecisiveness. This condition is critical for identifying potential reversal points and trend changes. Investors can evaluate these periods of indecisiveness to develop suitable buying and selling strategies.
This indicator is designed to assist investors in better analyzing market trends and supporting their decision-making processes. The integration of standard deviation and the Fibonacci sequence offers a new perspective on understanding market movements.
#DYOR

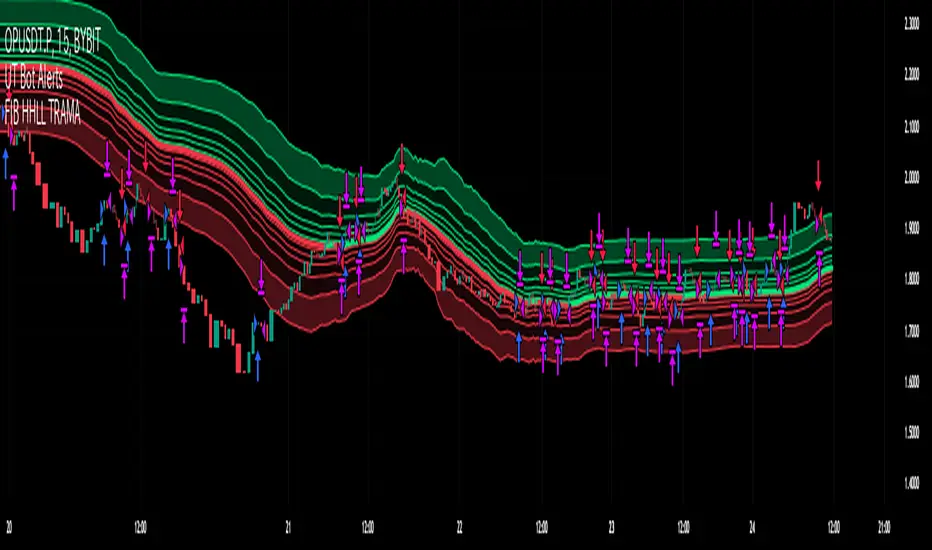
Fibonacci HH LL TRAMA BandLuxAlgo's Trend Moving Adaptive Moving Average was used as a reference to create bands by reading the highest and lowest prices of past bars based on Fibonacci numbers and then multiplying them by the Fibonacci ratio.
LuxAlgo/ LuxAlgo/
In particular, the so-called TRAMA is characterized by its adaptation to the average of the highest and lowest prices over a specific period of time and is used to identify support/resistance.
In order to apply this feature to the maximum extent possible, I used the high or low prices as the source of input, rather than the closing price.
For example,
src = high
not original like
src = close
In addition, I created 6 levels by multiplying the Fibonacci ratio
//Midline
mah = ama1
mal = ama2
m = (mah + mal)/2
//Half Mean Range
dist = (mah - mal)/2
//Levels
h6 = m + dist * 11.089
h5 = m + dist * 6.857
h4 = m + dist * 4.235
h3 = m + dist * 2.618
h2 = m + dist * 1.618
h1 = m + dist * 0.618
l1 = m - dist * 0.618
l2 = m - dist * 1.618
l3 = m - dist * 2.618
l4 = m - dist * 4.235
l5 = m - dist * 6.857
l6 = m - dist * 11.089
If you want to use it for scalping, such as 15 minutes, you can include Fibonacci numbers such as 21,34,55 for a quick reaction type to detect the trend. Also, by including Fibonacci numbers such as 89,144,233, you can see where you stand in the larger trend. Some examples are included below.
For Investors
BTCUSDT 1day Chart Fibonacci number "55"
For Daytraders
BTCUSDT 4hour Chart Fibonacci number "34"
For Scalpers
BTCUSDT 15min Chart Fibonacci number "55"
BTCUSDT 15min Chart Fibonacci number "89"
BTCUSDT 15min Chart Fibonacci number "233"
Fibonacci numbers are 1, 1, 2, 3, 5, 8, 13, 21, 34, 55, 89, 144, 233, 377, 610, etc.,
Fibonacci ratios are 0.618, 1.618, 2.618, 4.236, 6.854, 11.089, etc.,
Bollinger Bands Heatmap (BBH)The Bollinger Bands Heatmap (BBH) Indicator provides a unique visualization of Bollinger Bands by displaying the full distribution of prices as a heatmap overlaying your price chart. Unlike traditional Bollinger Bands, which plot the mean and standard deviation as lines, BBH illustrates the entire statistical distribution of prices based on a normal distribution model.
This heatmap indicator offers traders a visually appealing way to understand the probabilities associated with different price levels. The lower the weight of a certain level, the more transparent it appears on the heatmap, making it easier to identify key areas of interest at a glance.
Key Features
Dynamic Heatmap: Changes in real-time as new price data comes in.
Fully Customizable: Adjust the scale, offset, alpha, and other parameters to suit your trading style.
Visually Engaging: Uses gradients of colors to distinguish between high and low probabilities.
Settings
Scale
Tooltip: Scale the size of the heatmap.
Purpose: The 'Scale' setting allows you to adjust the dimensions of each heatmap box. A higher value will result in larger boxes and a more generalized view, while a lower value will make the boxes smaller, offering a more detailed look at price distributions.
Values: You can set this from a minimum of 0.125, stepping up by increments of 0.125.
Scale ATR Length
Tooltip: The ATR used to scale the heatmap boxes.
Purpose: This setting is designed to adapt the heatmap to the instrument's volatility. It determines the length of the Average True Range (ATR) used to size the heatmap boxes.
Values: Minimum allowable value is 5. You can increase this to capture more bars in the ATR calculation for greater smoothing.
Offset
Tooltip: Offset mean by ATR.
Purpose: The 'Offset' setting allows you to shift the mean value by a specified ATR. This could be useful for strategies that aim to capitalize on extreme price movements.
Values: The value can be any floating-point number. Positive values shift the mean upward, while negative values shift it downward.
Multiplier
Tooltip: Bollinger Bands Multiplier.
Purpose: The 'Multiplier' setting determines how wide the Bollinger Bands are around the mean. A higher value will result in a wider heatmap, capturing more extreme price movements. A lower value will tighten the heatmap around the mean price.
Values: The minimum is 0, and you can increase this in steps of 0.2.
Length
Tooltip: Length of Simple Moving Average (SMA).
Purpose: This setting specifies the period for the Simple Moving Average that serves as the basis for the Bollinger Bands. A higher value will produce a smoother average, while a lower value will make it more responsive to price changes.
Values: Can be set to any integer value.
Heat Map Alpha
Tooltip: Opacity level of the heatmap.
Purpose: This controls the transparency of the heatmap. A lower value will make the heatmap more transparent, allowing you to see the price action more clearly. A higher value will make the heatmap more opaque, emphasizing the bands.
Values: Ranges from 0 (completely transparent) to 100 (completely opaque).
Color Settings
High Color & Low Color: These settings allow you to customize the gradient colors of the heatmap.
Purpose: Use contrasting colors for better visibility or colors that you prefer. The 'High Color' is used for areas with high density (high probability), while the 'Low Color' is for low-density areas (low probability).
Usage Scenarios for Settings
For Volatile Markets: Increase 'Scale ATR Length' for better smoothing and set a higher 'Multiplier' to capture wider price movements.
For Trend Following: You might want to set a larger 'Length' for the SMA and adjust 'Scale' and 'Offset' to focus on more probable price zones.
These are just recommendations; feel free to experiment with these settings to suit your specific trading requirements.
How To Interpret
The heatmap gives a visual representation of the range within which prices are likely to move. Areas with high density (brighter color) indicate a higher probability of the price being in that range, whereas areas with low density (more transparent) indicate a lower probability.
Bright Areas: Considered high-probability zones where the price is more likely to be.
Transparent Areas: Considered low-probability zones where the price is less likely to be.
Tips For Use
Trend Confirmation: Use the heatmap along with other trend indicators to confirm the strength and direction of a trend.
Volatility: Use the density and spread of the heatmap as an indication of market volatility.
Entry and Exit: High-density areas could be potential support and resistance levels, aiding in entry and exit decisions.
Caution
The Bollinger Bands Heatmap assumes a normal distribution of prices. While this is a standard assumption in statistics, it is crucial to understand that real-world price movements may not always adhere to a normal distribution.
Conclusion
The Bollinger Bands Heatmap Indicator offers traders a fresh perspective on Bollinger Bands by transforming them into a visual, real-time heatmap. With its customizable settings and visually engaging display, BBH can be a useful tool for traders looking to understand price probabilities in a dynamic way.
Feel free to explore its features and adjust the settings to suit your trading strategy. Happy trading!

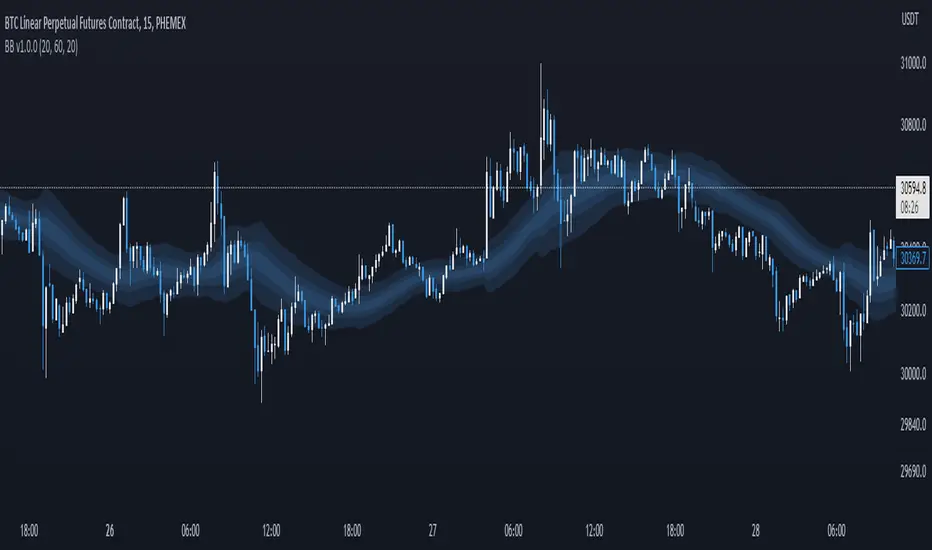
Breakout Band v1.0This indicator uses a custom source to define a point of relativity to which regions are based off to aid in technical analysis.
Breakout Band's use is:
- Monitoring trends
- Defining trends
- Defining areas of consolidation
- Trend support / resistance levels
- Aid in technical analysis
However, the band provides information different to that of an EMA, as they are not created from the same source, ref Fig 1.
---
Fig 1
Breakout Band compared to an EMA, both with a length setting of 20.
---
The primary band uses your charts timeframe to plot the band. This can be useful for more immediate information, ref Fig 2.
Fig 2
BTC on a 15m chart with Breakout Band's Chart Timeframe option.
---
There is also a functionality for a higher timeframe band to be plotted ( currently limited to 4 higher timeframes ) which can help to view higher timeframe moves with lower timeframe information, ref Fig 3. The higher timeframe band has an added smoothing effect.
Fig 3.
The same chart as referenced in Fig 2., while using Breakout Bands HTF option ( 60m band ).
---
USING BREAKOUT BAND
The band provides potential areas of consolidation, as seen in Fig 4., and when price action falls outside of the band, it can be considered trending.
Fig 4.
Defining areas of consolidation, trends, and monitor trends with Breakout Band.
---
Different zones are given different colors. The closer to the middle of the band, the higher chance of reactivity. Meaning, there is a greater chance that price will have a reaction within this zone. Whether that be trend continuation or a break of structure, showing signs of weakness of a trend, ref Fig 5.
Fig 5.
Breakout Bands reactivity region showing an area of potential resistance, which price action enters, then the trend continues.
---
NOTE : The same principles apply if you're using the HTF band for monitoring HTF trends.
I hope you enjoy the Breakout Band. Should you encounter any issues or have any suggestions for improving this indicator, let me know.
Any and all feedback is appreciated.
Ultimate Trend ChannelThe "Ultimate Trend Channel" indicator is a comprehensive trend analysis tool that calculates and displays a series of upper and lower bands based on user-defined input lengths. It uses linear regression and standard deviation to determine these bands for each of the 21 different group lengths. The indicator then computes the averages of these upper and lower bands, as well as the average of all the bands combined.
The visualization on the chart includes the plotting of the average upper and lower bands, with the space between these bands shaded for easy visualization of the overall trend. Additionally, the average of all the bands, referred to as the "Ultimate Trend Line," is also plotted on the chart.
This indicator provides a robust way of assessing market trends and volatility over varying periods, which can be extremely useful for both short-term and long-term trading strategies.

(Very promising) [Abdullah Ahmed] Momentum indicator V.1Description: MOM-LRC is a powerful technical analysis indicator designed to provide traders with signals based on the momentum of an asset's price and its deviation from its mean value. The indicator calculates the exponential RSI and uses a custom function to determine the percentage change from the mean. The upper and lower bands of the momentum channel are then calculated using linear regression of the rate of change from the mean. The channel multiplier can be adjusted to increase or decrease the sensitivity of the indicator.
How to use :
1 - Using MOM-LRC , look for buy signals when the price of the asset is below the lower border of the channel and retracing up. The opposite is true in the case of sell signals.
2 - It is also used in the case of negative and positive divergences, just as you use RSI
The indicator can be used on any time frame and any asset, making it a versatile tool for traders of all levels.
features:
Calculates exponential RSI and percentage change from the mean
Uses linear regression to calculate upper and lower bands of momentum channel
Adjustable channel multiplier for increased sensitivity
Suitable for any time frame and any asset
Happy trading!
Faytterro Bandswhat is Faytterro Bands?
it is a channel indicator like "Bollinger Bands".
what it does?
creates a channel using standard deviations and means. thus giving users an idea about the expensive and cheap zones. It uses a special weighted moving average different from standard bollinger bands, it also averages not only price but also deviations.
how it does it?
it uses this formulas:
how to use it?
its usage is the same as "bollinger band".
length represents the number of candles to be taken into account, source represents the source of those candles and stdev represents the coefficient of the standard deviation.
you can use it with other indicators:

Chebyshevs BandsThis script calculates upper and lower bands using Chebyshev's inequality formula.
The main pros.: the band doesn't depend on particular distribution. It fits to any type of random variables. Also it allows to calculate bands for instruments with extremely high volatility.
Cons.: formula provides a rough estimation in some special cases like lognormal distribution.
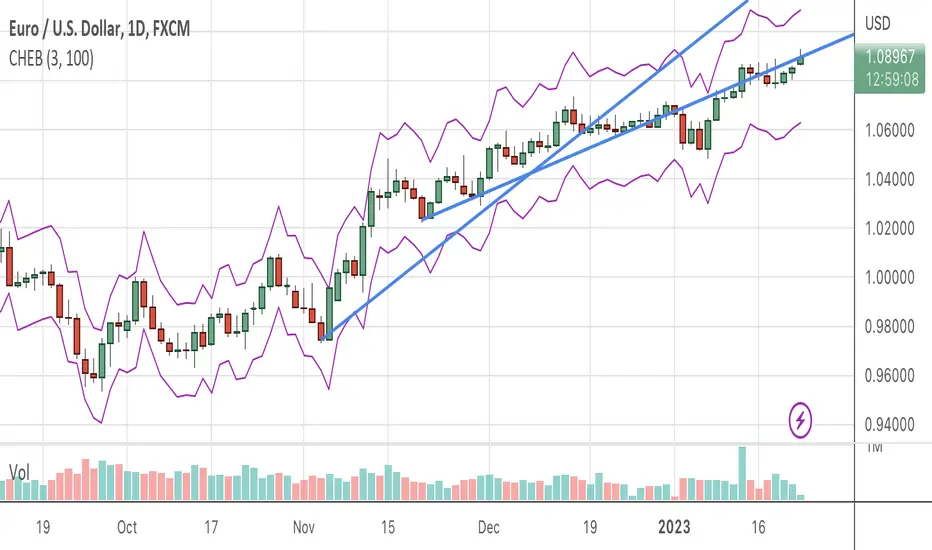
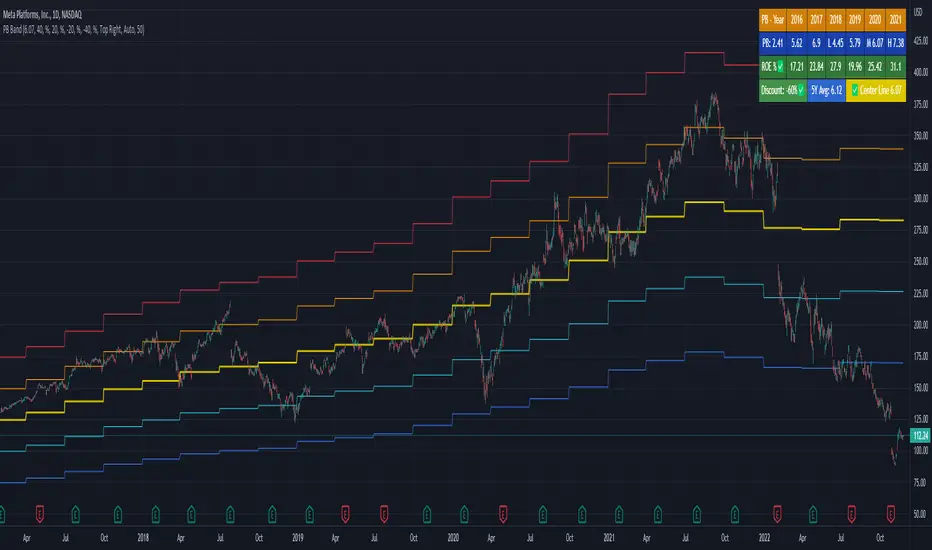
PE Band V2PE Band is a very practical stock selection technique for investors, which can be used to judge whether the company's stock price is currently overvalued or undervalued.
The PE ratio center line of the stock must be set every time the stock is changed because of the program limitation of Tradingview.
Usually we use the 5-year median to judge whether the company's stock price has a discount .
Not all stocks are suitable for using PE Band, especially cyclical stocks.
You can also use ROE to determine whether the company is a cyclical stock.

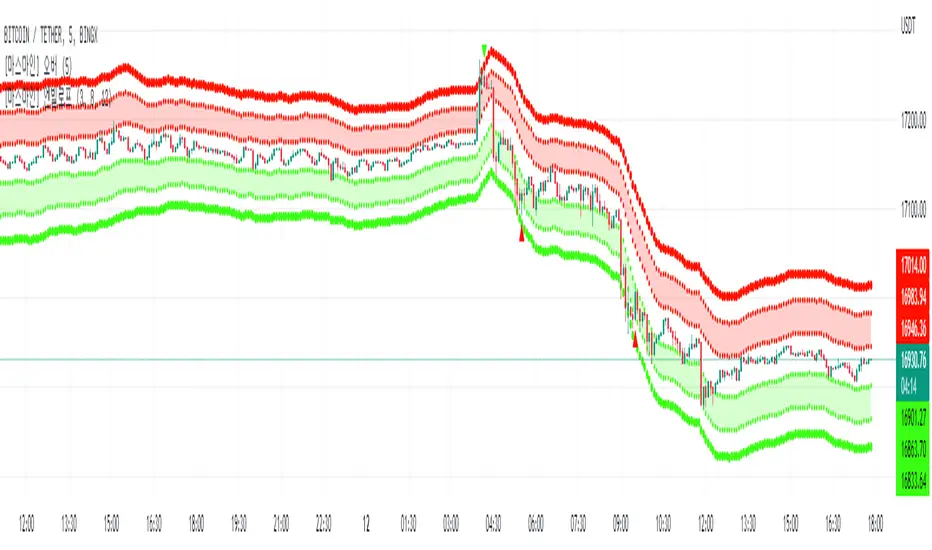
MarsMine_EnvelopThis indicator is an indicator for use in 5-minute period day trading strategies.
The indicator derives a power power based on past closing prices and substitutes the power value into a multiplier of Euler's constant to derive a range.
Bands were increased by substituting multiples into the derived range, and each band has a role.
You will enter a buy or sell between the first and second bands, and become comfortable on the opposite first band.
The third band is set as a stop loss standard.
이 지표는 5분봉 단타 매매 전략에서 사용하기 위한 보조지표입니다.
해당 지표는 과거 종가를 기반으로 멱수를 도출해내고 해당 멱수값을 오일러 상수의 승수에 대입하여 범위를 도출해냅니다.
도출해 낸 범위에 멀티플을 대입하여 밴드를 증가 시켰으며 각 밴드들은 역할이 존재합니다.
첫번째와 두번째 밴드 사이에서 매수 또는 매도 진입을 하게 되며, 반대의 첫번째 밴드에서 익절하게 됩니다.
세번째 밴드는 손절기준으로 설정합니다.
PB BandPB Band is a very practical stock selection technique for investors, which can be used to judge whether the company's stock price is currently overvalued or undervalued.
The PB ratio center line of the stock must be set every time the stock is changed because of the program limitation of Tradingview.
Usually we use the 5-year median to judge whether the company's stock price has a discount.
Not all stocks are suitable for using PB Band, especially cyclical stocks.
You can also use ROE to determine whether the company is a cyclical stock.