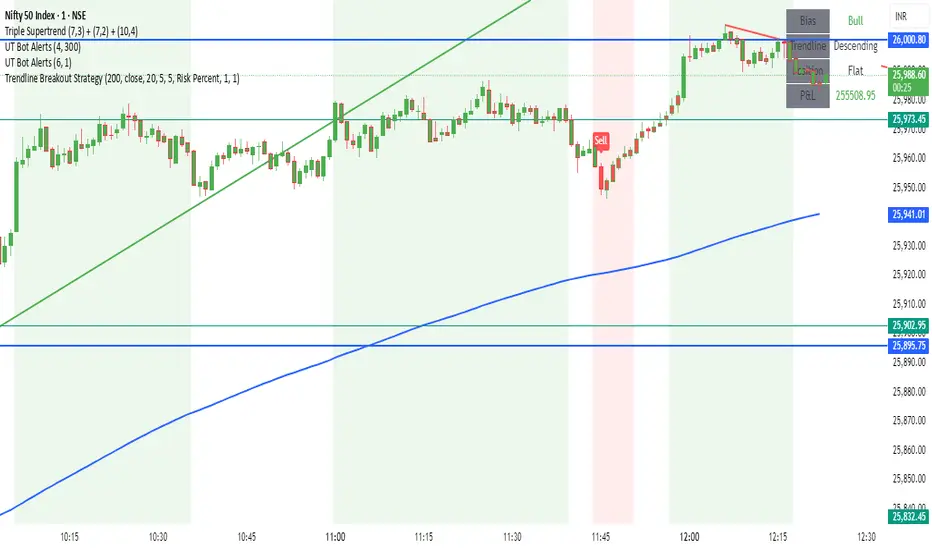
Trendline Breakout Strategy Strategy should place entries & exits so that it can be backtested (use strategy.entry and strategy.exit with explicit stop and limit prices). Include an option for fixed percent position sizing and an option for fixed contract size. Draw the trendline on the chart (with option to hide/show) and add labels that show: bias (Bull/Bear), trendline slope, entry price, SL, TP and the reason (e.g., "Trendline Breakout"). Provide user inputs for: EMA length (default 200), lookback for pivot detection, pivot sensitivity (left/right bars), quantity mode (percent / contracts), risk percent or fixed size, enable/disable backtest prints, and enable alerts. Avoid repainting: use confirmed pivot logic (pivot detection must use completed bars) and only take entry after breakout confirmed on close. Document any limitations (for example, trendline using two highest/highest bars inside lookback is approximate). Add clear comments, helpful variable names, and include example alertcondition lines for entry and exit signals.
Jalur dan Saluran
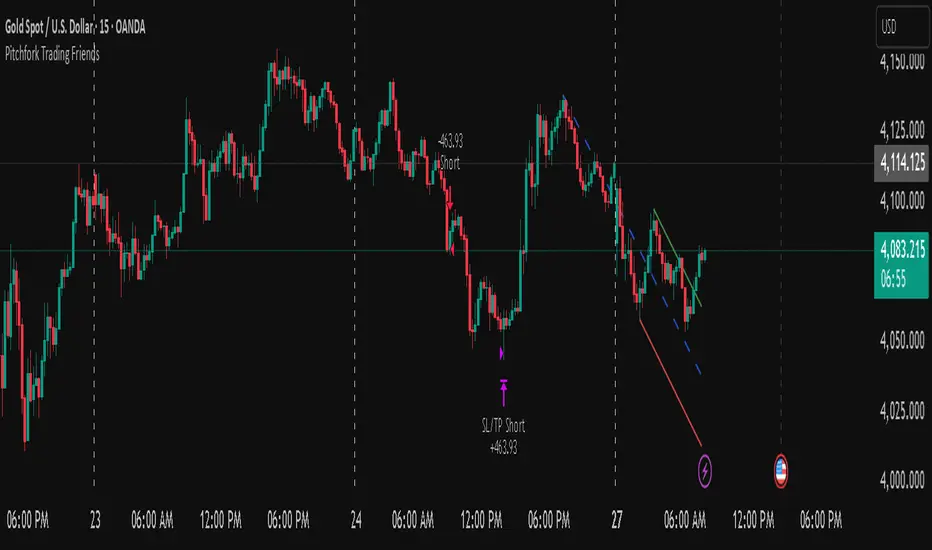
Pitchfork-Trading Friendsuses the pitchfork to give entry and exit zones, and gives a net overall summary for a beginner trader to enter into.
FVG Donchian Channel strategy30min FVG + Donchian Channel strategy
buy sell by 30min fvg
and stoploss , take profit by Donchian Channel
Run the strategy on the 1min timeframe!

VWAP & Band Cross Strategy v6VWAP & Band Cross Strategy v6: Script Summary
This Pine Script implements a highly flexible, multi-layered trading strategy centered around the Volume Weighted Average Price (VWAP) and its associated Standard Deviation Bands.
The strategy is designed to test various entry/exit models based on how the price interacts with the central VWAP line and the upper/lower volatility bands, with extensive risk management and confirmation filters.
1. Core Mechanics (VWAP & Bands)
VWAP Calculation: Calculates the VWAP based on a user-defined source (default is the close price).
Standard Deviation Bands: Creates upper and lower bands by calculating the standard deviation of the price (over 20 periods by default) and multiplying it by a user-defined Multiplier (default is 2.0). These bands dynamically expand and contract with volatility.
Plotting: The script clearly plots the VWAP (purple), the Upper Band (green), and the Lower Band (red), with a colored fill between the bands.
2. Entry Triggers
The core entry logic is based on a single, user-selected cross event between the price and the VWAP/Bands. The user can choose from six predefined entry types:
Entry Type Category
Entry Trigger (Long)
Entry Trigger (Short)
Mean Reversion
Price crosses over the Lower Band.
Price crosses under the Upper Band.
Trend Following
Price crosses over the Upper Band (Breakout).
Price crosses under the Lower Band (Breakout).
VWAP Cross
Price crosses over the VWAP.
Price crosses under the VWAP.
3. Filters and Confirmation
Trades are only executed if they pass a series of optional filters, making the strategy highly customizable:
Technical Confirmation (Optional): Users can enable and configure up to three additional indicators that must align with the trade direction:
RSI: Price must be Oversold (for Long) or Overbought (for Short).
SMMA: Price must be above the SMMA (for Long) or below (for Short).
MACD: MACD line must cross the Signal line and the Histogram must be positive/negative.
Time and Day Filters: Trades are restricted to a defined Entry Start/End Hour/Minute window, and only execute on user-selected Trading Days of the week.
Trade Direction: Can be toggled to execute Long Only, Short Only, or Both.
4. Advanced Risk Management (Daily Limits)
The strategy incorporates robust daily limits that reset at a configured Daily Reset Hour/Minute:
Daily Profit/Loss Limits: If the running total of Realized PnL (closed trades) + Unrealized PnL (open position) exceeds a user-defined Daily Take Profit (in Ticks) or falls below the Daily Stop Loss (in Ticks), the strategy locks out new trades and immediately closes any open position.
Max Daily Trades: Prevents the strategy from entering more than a specified number of trades per day.
5. Exit Logic
The strategy exit is also highly configurable via the Exit Type setting:
Fixed Ticks / ATR / Capped ATR: If one of these is selected, the script calculates a static Stop Loss and Take Profit level upon entry, using either fixed tick values or dynamic values based on the Average True Range (ATR), which are then executed using Pine Script's strategy.exit function.
Cross Exits (VWAP/Bands): If selected, the position is closed when the price crosses the VWAP or a specific band in the opposite direction.
End-of-Day Close: An unconditional exit that closes all open positions at a user-defined Close All Hour/Minute, regardless of profit/loss or limit status, preventing positions from being held overnight.

Zero Lag Trend Signals (MTF) [Quant Trading] V7Overview
The Zero Lag Trend Signals (MTF) V7 is a comprehensive trend-following strategy that combines Zero Lag Exponential Moving Average (ZLEMA) with volatility-based bands to identify high-probability trade entries and exits. This strategy is designed to reduce lag inherent in traditional moving averages while incorporating dynamic risk management through ATR-based stops and multiple exit mechanisms.
This is a longer term horizon strategy that takes limited trades. It is not a high frequency trading and therefore will also have limited data and not > 100 trades.
How It Works
Core Signal Generation:
The strategy uses a Zero Lag EMA (ZLEMA) calculated by applying an EMA to price data that has been adjusted for lag:
Calculate lag period: floor((length - 1) / 2)
Apply lag correction: src + (src - src )
Calculate ZLEMA: EMA of lag-corrected price
Volatility bands are created using the highest ATR over a lookback period multiplied by a band multiplier. These bands are added to and subtracted from the ZLEMA line to create upper and lower boundaries.
Trend Detection:
The strategy maintains a trend variable that switches between bullish (1) and bearish (-1):
Long Signal: Triggers when price crosses above ZLEMA + volatility band
Short Signal: Triggers when price crosses below ZLEMA - volatility band
Optional ZLEMA Trend Confirmation:
When enabled, this filter requires ZLEMA to show directional momentum before entry:
Bullish Confirmation: ZLEMA must increase for 4 consecutive bars
Bearish Confirmation: ZLEMA must decrease for 4 consecutive bars
This additional filter helps avoid false signals in choppy or ranging markets.
Risk Management Features:
The strategy includes multiple stop-loss and take-profit mechanisms:
Volatility-Based Stops: Default stop-loss is placed at ZLEMA ± volatility band
ATR-Based Stops: Dynamic stop-loss calculated as entry price ± (ATR × multiplier)
ATR Trailing Stop: Ratcheting stop-loss that follows price but never moves against position
Risk-Reward Profit Target: Take-profit level set as a multiple of stop distance
Break-Even Stop: Moves stop to entry price after reaching specified R:R ratio
Trend-Based Exit: Closes position when price crosses EMA in opposite direction
Performance Tracking:
The strategy includes optional features for monitoring and analyzing trades:
Floating Statistics Table: Displays key metrics including win rate, GOA (Gain on Account), net P&L, and max drawdown
Trade Log Labels: Shows entry/exit prices, P&L, bars held, and exit reason for each closed trade
CSV Export Fields: Outputs trade data for external analysis
Default Strategy Settings
Commission & Slippage:
Commission: 0.1% per trade
Slippage: 3 ticks
Initial Capital: $1,000
Position Size: 100% of equity per trade
Main Calculation Parameters:
Length: 70 (range: 70-7000) - Controls ZLEMA calculation period
Band Multiplier: 1.2 - Adjusts width of volatility bands
Entry Conditions (All Disabled by Default):
Use ZLEMA Trend Confirmation: OFF - Requires ZLEMA directional momentum
Re-Enter on Long Trend: OFF - Allows multiple entries during sustained trends
Short Trades:
Allow Short Trades: OFF - Strategy is long-only by default
Performance Settings (All Disabled by Default):
Use Profit Target: OFF
Profit Target Risk-Reward Ratio: 2.0 (when enabled)
Dynamic TP/SL (All Disabled by Default):
Use ATR-Based Stop-Loss & Take-Profit: OFF
ATR Length: 14
Stop-Loss ATR Multiplier: 1.5
Profit Target ATR Multiplier: 2.5
Use ATR Trailing Stop: OFF
Trailing Stop ATR Multiplier: 1.5
Use Break-Even Stop-Loss: OFF
Move SL to Break-Even After RR: 1.5
Use Trend-Based Take Profit: OFF
EMA Exit Length: 9
Trade Data Display (All Disabled by Default):
Show Floating Stats Table: OFF
Show Trade Log Labels: OFF
Enable CSV Export: OFF
Trade Label Vertical Offset: 0.5
Backtesting Date Range:
Start Date: January 1, 2018
End Date: December 31, 2069
Important Usage Notes
Default Configuration: The strategy operates in its most basic form with default settings - using only ZLEMA crossovers with volatility bands and volatility-based stop-losses. All advanced features must be manually enabled.
Stop-Loss Priority: If multiple stop-loss methods are enabled simultaneously, the strategy will use whichever condition is hit first. ATR-based stops override volatility-based stops when enabled.
Long-Only by Default: Short trading is disabled by default. Enable "Allow Short Trades" to trade both directions.
Performance Monitoring: Enable the floating stats table and trade log labels to visualize strategy performance during backtesting.
Exit Mechanisms: The strategy can exit trades through multiple methods: stop-loss hit, take-profit reached, trend reversal, or trailing stop activation. The trade log identifies which exit method was used.
Re-Entry Logic: When "Re-Enter on Long Trend" is enabled with ZLEMA trend confirmation, the strategy can take multiple long positions during extended uptrends as long as all entry conditions remain valid.
Capital Efficiency: Default setting uses 100% of equity per trade. Adjust "default_qty_value" to manage position sizing based on risk tolerance.
Realistic Backtesting: Strategy includes commission (0.1%) and slippage (3 ticks) to provide realistic performance expectations. These values should be adjusted based on your broker and market conditions.
Recommended Use Cases
Trending Markets: Best suited for markets with clear directional moves where trend-following strategies excel
Medium to Long-Term Trading: The default length of 70 makes this strategy more appropriate for swing trading rather than scalping
Risk-Conscious Traders: Multiple stop-loss options allow traders to customize risk management to their comfort level
Backtesting & Optimization: Comprehensive performance tracking features make this strategy ideal for testing different parameter combinations
Limitations & Considerations
Like all trend-following strategies, performance may suffer in choppy or ranging markets
Default 100% position sizing means full capital exposure per trade - consider reducing for conservative risk management
Higher length values (70+) reduce signal frequency but may improve signal quality
Multiple simultaneous risk management features may create conflicting exit signals
Past performance shown in backtests does not guarantee future results
Customization Tips
For more aggressive trading:
Reduce length parameter (minimum 70)
Decrease band multiplier for tighter bands
Enable short trades
Use lower profit target R:R ratios
For more conservative trading:
Increase length parameter
Enable ZLEMA trend confirmation
Use wider ATR stop-loss multipliers
Enable break-even stop-loss
Reduce position size from 100% default
For optimal choppy market performance:
Enable ZLEMA trend confirmation
Increase band multiplier
Use tighter profit targets
Avoid re-entry on trend continuation
Visual Elements
The strategy plots several elements on the chart:
ZLEMA line (color-coded by trend direction)
Upper and lower volatility bands
Long entry markers (green triangles)
Short entry markers (red triangles, when enabled)
Stop-loss levels (when positions are open)
Take-profit levels (when enabled and positions are open)
Trailing stop lines (when enabled and positions are open)
Optional ZLEMA trend markers (triangles at highs/lows)
Optional trade log labels showing complete trade information
Exit Reason Codes (for CSV Export)
When CSV export is enabled, exit reasons are coded as:
0 = Manual/Other
1 = Trailing Stop-Loss
2 = Profit Target
3 = ATR Stop-Loss
4 = Trend Change
Conclusion
Zero Lag Trend Signals V7 provides a robust framework for trend-following with extensive customization options. The strategy balances simplicity in its core logic with sophisticated risk management features, making it suitable for both beginner and advanced traders. By reducing moving average lag while incorporating volatility-based signals, it aims to capture trends earlier while managing risk through multiple configurable exit mechanisms.
The modular design allows traders to start with basic trend-following and progressively add complexity through ZLEMA confirmation, multiple stop-loss methods, and advanced exit strategies. Comprehensive performance tracking and export capabilities make this strategy an excellent tool for systematic testing and optimization.
Note: This strategy is provided for educational and backtesting purposes. All trading involves risk. Past performance does not guarantee future results. Always test thoroughly with paper trading before risking real capital, and adjust position sizing and risk parameters according to your risk tolerance and account size.
================================================================================
TAGS:
================================================================================
trend following, ZLEMA, zero lag, volatility bands, ATR stops, risk management, swing trading, momentum, trend confirmation, backtesting
================================================================================
CATEGORY:
================================================================================
Strategies
================================================================================
CHART SETUP RECOMMENDATIONS:
================================================================================
For optimal visualization when publishing:
Use a clean chart with no other indicators overlaid
Select a timeframe that shows multiple trade signals (4H or Daily recommended)
Choose a trending asset (crypto, forex major pairs, or trending stocks work well)
Show at least 6-12 months of data to demonstrate strategy across different market conditions
Enable the floating stats table to display key performance metrics
Ensure all indicator lines (ZLEMA, bands, stops) are clearly visible
Use the default chart type (candlesticks) - avoid Heikin Ashi, Renko, etc.
Make sure symbol information and timeframe are clearly visible
================================================================================
COMPLIANCE NOTES:
================================================================================
✅ Open-source publication with complete code visibility
✅ English-only title and description
✅ Detailed explanation of methodology and calculations
✅ Realistic commission (0.1%) and slippage (3 ticks) included
✅ All default parameters clearly documented
✅ Performance limitations and risks disclosed
✅ No unrealistic claims about performance
✅ No guaranteed results promised
✅ Appropriate for public library (original trend-following implementation with ZLEMA)
✅ Educational disclaimers included
✅ All features explained in detail
================================================================================

ApexSignalsIve been working with pine code for a really long time now, took me about 6 months to build this script, hopefully it works well for you.very good for trading. will help you out a lot

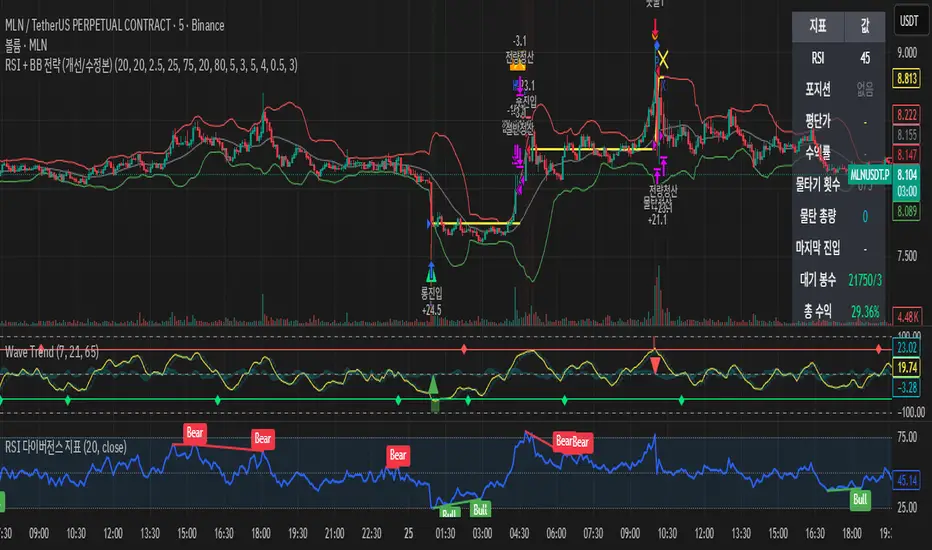
RSI + BB strategyBollinger Bands 20/2.5 + RSI 20-day 25/75
Long = Enter a long position when the price breaks below the Bollinger Band, the candlestick closes, and the RSI is below 25.
Short = Enter a short position when the price breaks above the Bollinger Band, the candlestick closes, and the RSI is above 75.
Take profit = Default setting: Take profit when profit is +4%. For safety, sell half of the position when profit is +2% to break even.
Lower average: -5% loss. If the RSI is 20/80, use the lower average. Sell the remaining amount when the price returns to its original price.
Based on 5-minute and 15-minute charts
Otherwise, signals will be difficult to obtain. For charts longer than 1 hour, adjust RSI and BB appropriately.
Monthly First-Day Range Breakout (Long-Only)Monthly First-Day Range Breakout (Long-Only)
When the Close is above the first candle of the month - Long
Wait for the First Day Close

[Aegis]Original Turtle System for CryptoAs Richard Dennis once said, "Even if I published all the Turtle rules in the newspaper right now, no one would be able to 'execute' them," and 40 years later, even in modern financial markets (like the crypto market) where all the conditions have been disclosed, this strategy continues to deliver amazing performance. The following outlines the original Turtle rules as disclosed by Curtis Faith in his book *Way of the Turtle*, and a TradingView algorithm that translates these rules for application in the crypto market.
---
### **The Original Turtle Trading Rules**
#### **1. Markets**
* Trade in liquid futures markets.
#### **2. Position Sizing**
The volatility measure, **N**, is used as the basis for all calculations.
**True Range (TR) Calculation:** Select the largest of the following three values:
* Current High - Current Low
* $|\text{Current High} - \text{Previous Close}|$ (Absolute Value)
* $|\text{Current Low} - \text{Previous Close}|$ (Absolute Value)
**N (Average True Range, ATR) Calculation:**
$$N = \frac{(19 \times \text{PDN} + \text{TR})}{20}$$
* **PDN:** Previous Day's N value
* **TR:** Current True Range
This is similar to a 20-day Exponential Moving Average, and is sometimes calculated using a Simple Moving Average.
**Unit Size Calculation:**
$$\text{Unit Size (Number of Contracts)} = \frac{1\% \text{ of Account Equity}}{(\text{N} \times \text{Dollars per Point})}$$
* **Dollars per Point (Tick Value):** The value of a 1-point change in price.
#### **3. Entries**
* **Entry:** Buy when the 55-day high is broken to the upside, and sell when the 55-day low is broken to the downside.
#### **5. Stops**
* The stop-loss for every unit is set at a price **2N** unfavorable from the entry price.
* For each additional unit added, the stop price for the **entire position** is adjusted favorably by **1/2 N**.
* In other words, the stop price of the last unit entered becomes the stop price for the entire position.
#### **6. Exits**
The exit rule for profitable positions (before a stop is hit) is as follows:
* **Long Positions:** Exit when the 20-day low is broken to the downside.
* **Short Positions:** Exit when the 20-day high is broken to the upside.
*Note: This exit rule is followed only if the price has moved up by a value greater than or equal to the N value multiplied by the criterion for changing the take-profit line (the original Korean text mentions a condition based on N, which is commonly interpreted as requiring a profit before applying the channel exit).*
리처드 데니스가 앞서 "내가 지금 당장 터틀의 모든 규칙을 신문에 공표한다고 해도 아무도 '실행'하지 못할 것"라고 말했듯 40년이 흘러 모든 조건이 공개된 현대 금융시장(크립토 시장)에서도 여전히 이 전략은 놀라운 퍼포먼스를 기록하고 있습니다. 아래는 커티스 페이스가 자신의 저서 '터틀의 방식'에 공개한 오리지널 터틀 규칙과 이를 알고리즘으로 변환하여 크립토마켓에 적용한 트레이딩뷰 알고리즘 입니다.
##### 1. 시장 (Markets)
• 유동성이 풍부한 선물 시장에서 거래한다.
##### 2. 포지션 크기 (Position Sizing)
변동성 측정 단위인 N을 모든 계산의 기초로 사용한다.
**True Range (TR) 계산:** 다음 세 가지 값 중 가장 큰 값을 선택한다.
- • 현재 고가 - 현재 저가
- • |현재 고가 - 전일 종가| (절대값)
- • |현재 저가 - 전일 종가| (절대값)
**N (Average True Range, ATR) 계산:**
N = (19 × PDN + TR) / 20
- • PDN: 이전 날의 N 값
- • TR: 현재 True Range
이는 20일 지수이동평균과 유사하며, 단순이동평균으로 계산하기도 한다.
**1 유닛(Unit)의 크기 계산:**
유닛 크기 (계약 수) = 계좌 자산의 1% / (N × 틱 가치)
• 틱 가치(Dollars per Point): 1포인트 변동 시의 가치
##### 3. 진입 (Entries)
- • 진입: 55일 고가를 상향 돌파하면 매수, 55일 저가를 하향 돌파하면 매도한다.
##### 5. 손절 (Stops)
- • 모든 유닛에 대한 손절 기준은 진입 가격으로부터 2N 만큼 불리한 가격에 설정한다.
- • 유닛이 추가될 때마다 전체 포지션의 손절 가격을 1/2 N 만큼 유리한 방향으로 상향 조정한다.
- • 즉, 마지막으로 진입한 유닛의 손절 가격이 전체 포지션의 손절 가격이 된다.
##### 6. 청산 (Exits)
손절에 도달하기 전 수익 중인 포지션의 청산 규칙은 다음과 같다.
- • 매수 포지션: 20일 저가를 하향 돌파할 때 청산한다.
- • 매도 포지션: 20일 고가를 상향 돌파할 때 청산한다.
단, N값에 익절선 변경 기준을 곱한 값 이상으로 가격이 상승할 경우, 위 규칙을 따른다.

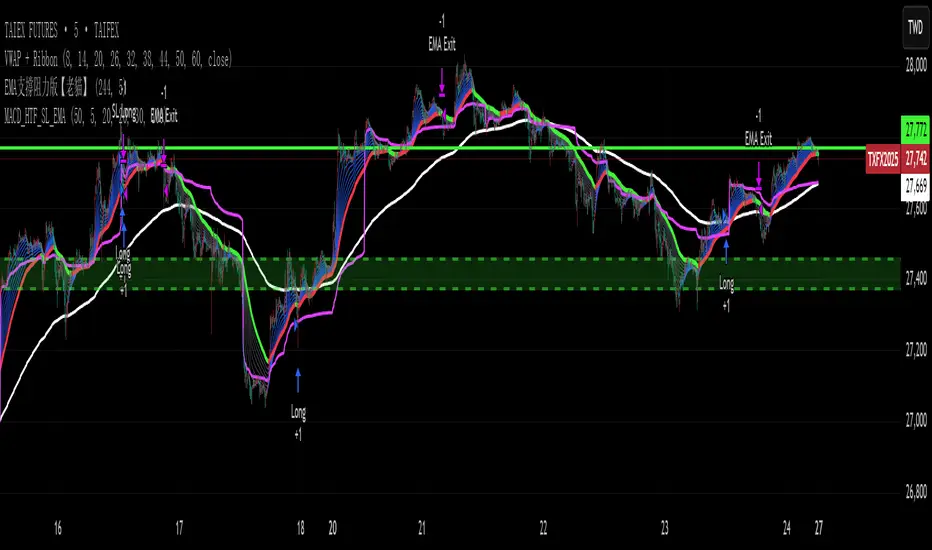
EVWMA VWAP MACD Strategy - HTF Trigger with SL & EMA ExitEVWMA VWAP MACD Strategy - HTF Trigger with SL & EMA Exit

EVWMA VWAP MACD Strategy - HTF Trigger with SL & EMA ExitRENEW TRY IT EVWMA VWAP MACD Strategy - HTF Trigger with SL & EMA Exit
Bollinger Bands Breakout StrategyHey guys check out this strategy script.
Chart plotting:
I use a classic plot of Bollinger Bands to define a consolidation zone, I also use a separate Trend Filter (SMA).
Logic:
When the price is above the SMA and above the Bollinger Upper Band the strategy goes Long. When the price is below the SMA and below the Bollinger Lower Band the strategy goes Short. Simple.
Exits:
TP and SL are a percentage of the price.
Notes: This simple strategy can be used at any timeframe (I prefer the 15min for day trading). It avoids consolidation, when the price is inside the Bollinger Bands, and has a good success rate. Adjust the Length of the BB to suit your style of trading (Lower numbers=more volatile, Higher numbers=more restrictive). Also you can adjust the Trend Filter SMA, I presonally chose the 50 SMA. Finally the SL/TP can be also adjusted from the input menu.
Test it for yourself!
Have great trades!

TriAnchor Elastic Reversion US Market SPY and QQQ adaptedSummary in one paragraph
Mean-reversion strategy for liquid ETFs, index futures, large-cap equities, and major crypto on intraday to daily timeframes. It waits for three anchored VWAP stretches to become statistically extreme, aligns with bar-shape and breadth, and fades the move. Originality comes from fusing daily, weekly, and monthly AVWAP distances into a single ATR-normalized energy percentile, then gating with a robust Z-score and a session-safe gap filter.
Scope and intent
• Markets: SPY QQQ IWM NDX large caps liquid futures liquid crypto
• Timeframes: 5 min to 1 day
• Default demo: SPY on 60 min
• Purpose: fade stretched moves only when multi-anchor context and breadth agree
• Limits: strategy uses standard candles for signals and orders only
Originality and usefulness
• Unique fusion: tri-anchor AVWAP energy percentile plus robust Z of close plus shape-in-range gate plus breadth Z of SPY QQQ IWM
• Failure mode addressed: chasing extended moves and fading during index-wide thrusts
• Testability: each component is an input and visible in orders list via L and S tags
• Portable yardstick: distances are ATR-normalized so thresholds transfer across symbols
• Open source: method and implementation are disclosed for community review
Method overview in plain language
Base measures
• Range basis: ATR(length = atr_len) as the normalization unit
• Return basis: not used directly; we use rank statistics for stability
Components
• Tri-Anchor Energy: squared distances of price from daily, weekly, monthly AVWAPs, each divided by ATR, then summed and ranked to a percentile over base_len
• Robust Z of Close: median and MAD based Z to avoid outliers
• Shape Gate: position of close inside bar range to require capitulation for longs and exhaustion for shorts
• Breadth Gate: average robust Z of SPY QQQ IWM to avoid fading when the tape is one-sided
• Gap Shock: skip signals after large session gaps
Fusion rule
• All required gates must be true: Energy ≥ energy_trig_prc, |Robust Z| ≥ z_trig, Shape satisfied, Breadth confirmed, Gap filter clear
Signal rule
• Long: energy extreme, Z negative beyond threshold, close near bar low, breadth Z ≤ −breadth_z_ok
• Short: energy extreme, Z positive beyond threshold, close near bar high, breadth Z ≥ +breadth_z_ok
What you will see on the chart
• Standard strategy arrows for entries and exits
• Optional short-side brackets: ATR stop and ATR take profit if enabled
Inputs with guidance
Setup
• Base length: window for percentile ranks and medians. Typical 40 to 80. Longer smooths, shorter reacts.
• ATR length: normalization unit. Typical 10 to 20. Higher reduces noise.
• VWAP band stdev: volatility bands for anchors. Typical 2.0 to 4.0.
• Robust Z window: 40 to 100. Larger for stability.
• Robust Z entry magnitude: 1.2 to 2.2. Higher means stronger extremes only.
• Energy percentile trigger: 90 to 99.5. Higher limits signals to rare stretches.
• Bar close in range gate long: 0.05 to 0.25. Larger requires deeper capitulation for longs.
Regime and Breadth
• Use breadth gate: on when trading indices or broad ETFs.
• Breadth Z confirm magnitude: 0.8 to 1.8. Higher avoids fighting thrusts.
• Gap shock percent: 1.0 to 5.0. Larger allows more gaps to trade.
Risk — Short only
• Enable short SL TP: on to bracket shorts.
• Short ATR stop mult: 1.0 to 3.0.
• Short ATR take profit mult: 1.0 to 6.0.
Properties visible in this publication
• Initial capital: 25000USD
• Default order size: Percent of total equity 3%
• Pyramiding: 0
• Commission: 0.03 percent
• Slippage: 5 ticks
• Process orders on close: OFF
• Bar magnifier: OFF
• Recalculate after order is filled: OFF
• Calc on every tick: OFF
• request.security lookahead off where used
Realism and responsible publication
• No performance claims. Past results never guarantee future outcomes
• Fills and slippage vary by venue
• Shapes can move during bar formation and settle on close
• Standard candles only for strategies
Honest limitations and failure modes
• Economic releases or very thin liquidity can overwhelm mean-reversion logic
• Heavy gap regimes may require larger gap filter or TR-based tuning
• Very quiet regimes reduce signal contrast; extend windows or raise thresholds
Open source reuse and credits
• None
Strategy notice
Orders are simulated by TradingView on standard candles. request.security uses lookahead off where applicable. Non-standard charts are not supported for execution.
Entries and exits
• Entry logic: as in Signal rule above
• Exit logic: short side optional ATR stop and ATR take profit via brackets; long side closes on opposite setup
• Risk model: ATR-based brackets on shorts when enabled
• Tie handling: stop first when both could be touched inside one bar
Dataset and sample size
• Test across your visible history. For robust inference prefer 100 plus trades.

Aurum DCX AVE Gold and Silver StrategySummary in one paragraph
Aurum DCX AVE is a volatility break strategy for gold and silver on intraday and swing timeframes. It aligns a new Directional Convexity Index with an Adaptive Volatility Envelope and an optional USD/DXY bias so trades appear only when direction quality and expansion agree. It is original because it fuses three pieces rarely combined in one model for metals: a convexity aware trend strength score, a percentile based envelope that widens with regime heat, and an intermarket DXY filter.
Scope and intent
• Markets. Gold and silver futures or spot, other liquid commodities, major indices
• Timeframes. Five minutes to one day. Defaults to 30min for swing pace
• Default demo used in this publication. TVC:GOLD on 30m
• Purpose. Enter confirmed volatility breaks while muting chop using regime heat and USD bias
• Limits. This is a strategy. Orders are simulated on standard candles only
Originality and usefulness
• Unique fusion. DCX combines DI strength with path efficiency and curvature. AVE blends ATR with a high TR percentile and widens with DCX heat. DXY adds an intermarket bias
• Failure mode addressed. False starts inside compression and unconfirmed breakouts during USD swings
• Testability. Each component has a named input. Entry names L and S are visible in the list of trades
• Portable yardstick. Weekly ATR for stops and R multiples for targets
• Open source. Method and implementation are disclosed for community review
Method overview in plain language
You score direction quality with DCX, size an adaptive envelope with a blend of ATR and a high TR percentile, and only allow breaks that clear the band while DCX is above a heat threshold in the same direction. An optional DXY filter favors long when USD weakens and short when USD strengthens. Orders are bracketed with a Weekly ATR stop and an R multiple target, with optional trailing to the envelope.
Base measures
• Range basis. True Range and ATR over user windows. A high TR percentile captures expansion tails used by AVE
• Return basis. Not required
Components
• Directional Convexity Index DCX. Measures directional strength with DX, multiplies by path efficiency, blends a curvature term from acceleration, scales to 0 to 100, and uses a rise window
• Adaptive Volatility Envelope AVE. Midline ALMA or HMA or EMA plus bands sized by a blend of ATR and a high TR percentile. The blend weight follows volatility of volatility. Band width widens with DCX heat
• DXY Bias optional. Daily EMA trend of DXY. Long bias when USD weakens. Short bias when USD strengthens
• Risk block. Initial stop equals Weekly ATR times a multiplier. Target equals an R multiple of the initial risk. Optional trailing to AVE band
Fusion rule
• All gates must pass. DCX above threshold and rising. Directional lead agrees. Price breaks the AVE band in the same direction. DXY bias agrees when enabled
Signal rule
• Long. Close above AVE upper and DCX above threshold and DCX rising and plus DI leads and DXY bias is bearish
• Short. Close below AVE lower and DCX above threshold and DCX falling and minus DI leads and DXY bias is bullish
• Exit and flip. Bracket exit at stop or target. Optional trailing to AVE band
Inputs with guidance
Setup
• Symbol. Default TVC:GOLD (Correlation Asset for internal logic)
• Signal timeframe. Blank follows the chart
• Confirm timeframe. Default 1 day used by the bias block
Directional Convexity Index
• DCX window. Typical 10 to 21. Higher filters more. Lower reacts earlier
• DCX rise bars. Typical 3 to 6. Higher demands continuation
• DCX entry threshold. Typical 15 to 35. Higher avoids soft moves
• Efficiency floor. Typical 0.02 to 0.06. Stability in quiet tape
• Convexity weight 0..1. Typical 0.25 to 0.50. Higher gives curvature more influence
Adaptive Volatility Envelope
• AVE window. Typical 24 to 48. Higher smooths more
• Midline type. ALMA or HMA or EMA per preference
• TR percentile 0..100. Typical 75 to 90. Higher favors only strong expansions
• Vol of vol reference. Typical 0.05 to 0.30. Controls how much the percentile term weighs against ATR
• Base envelope mult. Typical 1.4 to 2.2. Width of bands
• Regime adapt 0..1. Typical 0.6 to 0.95. How much DCX heat widens or narrows the bands
Intermarket Bias
• Use DXY bias. Default ON
• DXY timeframe. Default 1 day
• DXY trend window. Typical 10 to 50
Risk
• Risk percent per trade. Reporting field. Keep live risk near one to two percent
• Weekly ATR. Default 14. Basis for stops
• Stop ATR weekly mult. Typical 1.5 to 3.0
• Take profit R multiple. Typical 1.5 to 3.0
• Trail with AVE band. Optional. OFF by default
Properties visible in this publication
• Initial capital. 20000
• Base currency. USD
• request.security lookahead off everywhere
• Commission. 0.03 percent
• Slippage. 5 ticks
• Default order size method percent of equity with value 3% of the total capital available
• Pyramiding 0
• Process orders on close ON
• Bar magnifier ON
• Recalculate after order is filled OFF
• Calc on every tick OFF
Realism and responsible publication
• No performance claims. Past results never guarantee future outcomes
• Shapes can move while a bar forms and settle on close
• Strategies use standard candles for signals and orders only
Honest limitations and failure modes
• Economic releases and thin liquidity can break assumptions behind the expansion logic
• Gap heavy symbols may prefer a longer ATR window
• Very quiet regimes can reduce signal contrast. Consider higher DCX thresholds or wider bands
• Session time follows the exchange of the chart and can change symbol to symbol
• Symbol sensitivity is expected. Use the gates and length inputs to find stable settings
Open source reuse and credits
• None
Mode
Public open source. Source is visible and free to reuse within TradingView House Rules
Legal
Education and research only. Not investment advice. You are responsible for your decisions. Test on historical data and in simulation before any live use. Use realistic costs.

FluxGate Daily Swing StrategySummary in one paragraph
FluxGate treats long and short as different ecosystems. It runs two independent engines so the long side can be bold when the tape rewards upside persistence while the short side can stay selective when downside is messy. The core reads three directional drivers from price geometry then removes overlap before gating with clean path checks. The complementary risk module anchors stop distance to a higher timeframe ATR so a unit means the same thing on SPY and BTC. It can add take profit breakeven and an ATR trail that only activates after the trade earns it. If a stop is hit the strategy can re enter in the same direction on the next bar with a daily retry cap that you control. Add it to a clean chart. Use defaults to see the intended behavior. For conservative workflows evaluate on bar close.
Scope and intent
• Markets. Large cap equities and liquid ETFs major FX pairs US index futures and liquid crypto pairs
• Timeframes. From one minute to daily
• Default demo in this publication. SPY on one day timeframe
• Purpose. Reduce false starts without missing sustained trends by fusing independent drivers and suppressing activity when the path is noisy
• Limits. This is a strategy. Orders are simulated on standard candles. Non standard chart types are not supported for execution
Originality and usefulness
• Unique fusion. FluxGate extracts three drivers that look at price from different angles. Direction measures slope of a smoothed guide and scales by realized volatility so a point of slope does not mean a different thing on different symbols. Persistence looks at short sign agreement to reward series of closes that keep direction. Curvature measures the second difference of a local fit to wake up during convex pushes. These three are then orthonormalized so a strong reading in one does not double count through another.
• Gates that matter. Efficiency ratio prefers direct paths over treadmills. Entropy turns up versus down frequency into an information read. Light fractal cohesion punishes wrinkly paths. Together they slow the system in chop and allow it to open up when the path is clean.
• Separate long and short engines. Threshold tilts adapt to the skew of score excursions. That lets long engage earlier when upside distribution supports it and keeps short cautious where downside surprise and venue frictions are common.
• Practical risk behavior. Stops are ATR anchored on a higher timeframe so the unit is portable. Take profit is expressed in R so two R means the same concept across symbols. Breakeven and trailing only activate after a chosen R so early noise does not squeeze a good entry. Re entry after stop lets the system try again without you babysitting the chart.
• Testability. Every major window and the aggression controls live in Inputs. There is no hidden magic number.
Method overview in plain language
Base measures
• Return basis. Natural log of close over prior close for stability and easy aggregation through time. Realized volatility is the standard deviation of returns over a moving window.
• Range basis for risk. ATR computed on a higher timeframe anchor such as day week or month. That anchor is steady across venues and avoids chasing chart specific quirks.
Components
• Directional intensity. Use an EMA of typical price as a guide. Take the day to day slope as raw direction. Divide by realized volatility to get a unit free measure. Soft clip to keep outliers from dominating.
• Persistence. Encode whether each bar closed up or down. Measure short sign agreement so a string of higher closes scores better than a jittery sequence. This favors push continuity without guessing tops or bottoms.
• Curvature. Fit a short linear regression and compute the second difference of the fitted series. Strong curvature flags acceleration that slope alone may miss.
• Efficiency gate. Compare net move to path length over a gate window. Values near one indicate direct paths. Values near zero indicate treadmill behavior.
• Entropy gate. Convert up versus down frequency into a probability of direction. High entropy means coin toss. The gate narrows there.
• Fractal cohesion. A light read of path wrinkliness relative to span. Lower cohesion reduces the urge to act.
• Phase assist. Map price inside a recent channel to a small signed bias that grows with confidence. This helps entries lean toward the right half of the channel without becoming a breakout rule.
• Shock control. Compare short volatility to long volatility. When short term volatility spikes the shock gate temporarily damps activity so the system waits for pressure to normalize.
Fusion rule
• Normalize the three drivers after removing overlap
• Blend with weights that adapt to your aggression input
• Multiply by the gates to respect path quality
• Smooth just enough to avoid jitter while keeping timing responsive
• Compute an adaptive mean and deviation of the score and set separate long and short thresholds with a small tilt informed by skew sign
• The result is one long score and one short score that can cross their thresholds at different times for the same tape which is a feature not a bug
Signal rule
• A long suggestion appears when the long score crosses above its long threshold while all gates are active
• A short suggestion appears when the short score crosses below its short threshold while all gates are active
• If any required gate is missing the state is wait
• When a position is open the status is in long or in short until the complementary risk engine exits or your entry mode closes and flips
Inputs with guidance
Setup Long
• Base length Long. Master window for the long engine. Typical range twenty four to eighty. Raising it improves selectivity and reduces trade count. Lowering it reacts faster but can increase noise
• Aggression Long. Zero to one. Higher values make thresholds more permissive and shorten smoothing
Setup Short
• Base length Short. Master window for the short engine. Typical range twenty eight to ninety six
• Aggression Short. Zero to one. Lower values keep shorts conservative which is often useful on upward drifting symbols
Entries and UI
• Entry mode. Both or Long only or Short only
Complementary risk engine
• Enable risk engine. Turns on bracket exits while keeping your signal logic untouched
• ATR anchor timeframe. Day Week or Month. This sets the structural unit of stop distance
• ATR length. Default fourteen
• Stop multiple. Default one point five times the anchor ATR
• Use take profit. On by default
• Take profit in R. Default two R
• Breakeven trigger in R. Default one R
Usage recipes
Intraday trend focus
• Entry mode Both
• ATR anchor Week
• Aggression Long zero point five Aggression Short zero point three
• Stop multiple one point five Take profit two R
• Expect fewer trades that stick to directional pushes and skip treadmill noise
Intraday mean reversion focus
• Session windows optional if you add them in your copy
• ATR anchor Day
• Lower aggression both sides
• Breakeven later and trailing later so the first bounce has room
• This favors fade entries that still convert into trends when the path stays clean
Swing continuation
• Signal timeframe four hours or one day
• Confirm timeframe one day if you choose to include bias
• ATR anchor Week or Month
• Larger base windows and a steady two R target
• This accepts fewer entries and aims for larger holds
Properties visible in this publication
• Initial capital 25.000
• Base currency USD
• Default order size percent of equity value three - 3% of the total capital
• Pyramiding zero
• Commission zero point zero three percent - 0.03% of total capital
• Slippage five ticks
• Process orders on close off
• Recalculate after order is filled off
• Calc on every tick off
• Bar magnifier off
• Any request security calls use lookahead off everywhere
Realism and responsible publication
• No performance promises. Past results never guarantee future outcomes
• Fills and slippage vary by venue and feed
• Strategies run on standard candles only
• Shapes can update while a bar is forming and settle on close
• Keep risk per trade sensible. Around one percent is typical for study. Above five to ten percent is rarely sustainable
Honest limitations and failure modes
• Sudden news and thin liquidity can break assumptions behind entropy and cohesion reads
• Gap heavy symbols often behave better with a True Range basis for risk than a simple range
• Very quiet regimes can reduce score contrast. Consider longer windows or higher thresholds when markets sleep
• Session windows follow the exchange time of the chart if you add them
• If stop and target can both be inside a single bar this strategy prefers stop first to keep accounting conservative
Open source reuse and credits
• No reused open source beyond public domain building blocks such as ATR EMA and linear regression concepts
Legal
Education and research only. Not investment advice. You are responsible for your decisions. Test on history and in simulation with realistic costs

ProbRSI Adaptive SPY and QQQ Swing One Hour Strategy Summary in one paragraph
A probabilistic RSI engine for large cap ETFs and index names on intraday and swing timeframes. It converts ATR scaled returns into a 0 to 100 probability line, adapts its smoothing from path efficiency, and gates flips with simple percent levels. It is original because it fuses three pieces that traders rarely combine in one signal line: ATR normalized return probability, curvature compression, and per bar adaptive EMA. Add it to a clean chart, keep the default one hour signal on QQQ, and read the entry and exit markers generated by the strategy. For conservative alerts select on bar close.
Scope and intent
• Markets. Major ETFs and large cap equities. Index futures. Liquid crypto. Major FX pairs
• Timeframes. One minute to daily. Defaults to one hour for swing pace
• Default demo used in this publication. SPY/QQQ on one hour
• Purpose. Reduce false flips by adapting to path efficiency and by gating long and short separately
• Limits. This is a strategy. Orders are simulated on standard candles only
Originality and usefulness
• Unique fusion. Logistic probability of ATR scaled returns with arcsine pre transform, optional curvature compression, and per bar adaptive EMA steered by an efficiency ratio
• Failure mode addressed. Fast whips in congestion and late entries after spikes
• Testability. Each component has a named input and can be tuned directly. Entry names Long and Short are visible in the list of trades
• Portable yardstick. ATR scaled return is a common unit across symbols and venues
• Protected rationale. The code stays protected to preserve implementation details of the adaptive engine and curvature assist while the method and usage are fully explained here for community review
Method overview in plain language
You convert raw returns into a probability scale, adapt the smoothing to the straightness of the path, and only allow flips when a simple gate is satisfied. The probability line crosses its own EMA to generate signals. When the cross happens below a short gate or above a long gate, the flip is allowed. Otherwise it is ignored.
Base measures
• Return basis. Close minus prior close normalized by ATR, then arcsine to damp large steps. ATR window is set by ATR length. Sensitivity is adjusted by an ATR scale input
• Probability map. A logistic function maps the normalized return to 0 to 1 which becomes 0 to 100 after scaling
Components
• Probability core. Logistic probability of ATR scaled returns. Higher values imply upside pressure. Smoothed by an adaptive EMA
• Curvature assist optional. A curvature proxy compresses extreme spikes toward neutral. Useful after news bars. Weight controls strength
• Efficiency ratio. A path efficiency score from 0 to 1 extends the smoothing length during noisy paths and shortens it during directional paths
• Signal line. An EMA of the probability line creates the reference for cross up and cross down
• Gates. Two simple percent levels define when long and short flips are allowed
Fusion rule
• The adaptive EMA length is computed as a linear map between a minimum and a maximum bound based on one minus efficiency
• If curvature assist is enabled the probability is adjusted by a small counter spike term
• Final probability is compared to its EMA
Signal rule
• Long. A long entry is suggested when probability crosses above the signal line and the current probability is above the Long gate level
• Short. A short entry is suggested when probability crosses below the signal line and the current probability is below the Short gate level
• Exit and flip. When an opposite entry condition appears the current position is closed and a new position opens in the opposite direction
What you will see on the chart
• Strategy markers on suggestion bars. Orders named Long and Short
• Exit marker when the opposite signal closes the open side
• No table by design. All tuning lives in Inputs for a clean chart
Inputs with guidance
Market TF
• Symbol. Series used for oscillator computation. Use the instrument you trade or a close proxy
• Signal timeframe. Timeframe where the oscillator is evaluated. Leave blank to follow the chart
Core
• Price source. Series used for returns. Typical choice close
• Base length. Fallback EMA length used when adaptation is off. Typical range 20 to 200. Larger smooths more
• ATR length. Window for ATR that scales returns. Typical range 10 to 30. Larger normalizes more and lowers sensitivity
• Logit sharpness. Steepness of the logistic link. Typical range 1 to 8. Raising it reacts more to the same input
• ATR scale. Extra divisor on ATR. Typical range 0.5 to 2. Smaller is more sensitive
• Signal length. EMA of the probability line. Typical range 5 to 20. Larger gives fewer flips
• Long gate. Allow long flips only above this level. Typical range 20 to 40
• Short gate. Allow short flips only below this level. Typical range 20 to 40
Adaptive
• Adaptive smoothing. If on, the efficiency ratio controls the per bar EMA length
• Min effective length. Lower bound of adaptive EMA. Typical range 5 to 50
• Max effective length. Upper bound of adaptive EMA. Typical range 50 to 300
• Efficiency window. Window for efficiency ratio. Typical range 30 to 100
Shape Assist
• Curvature influence. If on, extreme spikes are nudged toward neutral
• Curvature weight. Strength of compression. Typical range 0.1 to 0.3
Properties visible in this publication
• Initial capital. 25000
• Base currency. USD
• request.security lookahead off everywhere
• Commission. 0.03 percent
• Slippage. 5 ticks
• Default order size method percent of equity with value 3 for realistic testing
• Pyramiding 0
• Process orders on close ON
• Bar magnifier OFF
• Recalculate after order is filled OFF
• Calc on every tick OFF
Realism and responsible publication
• No performance claims. Past results never guarantee future outcomes
• Shapes can move while a bar forms and settle on close
• Strategies use standard candles for signals and orders only
Honest limitations and failure modes
• Economic releases and thin liquidity can break assumptions behind the curvature assist
• Gap heavy symbols may prefer a longer ATR window
• Very quiet regimes can reduce signal contrast. Consider higher gates or longer signal length
• Session time follows the exchange of the chart and can change symbol to symbol
• Symbol sensitivity is expected. Use the gates and length inputs to find stable settings
• Past results never guarantee future outcomes
Open source reuse and credits
• None
Mode
Public protected. Source is hidden while access is free. Implementation detail remains private. Method and use are fully disclosed here
Legal
Education and research only. Not investment advice. You are responsible for your decisions. Test on historical data and in simulation before any live use. Use realistic costs.

Gold GC Renko Strategy Futures MGC MicrosRENKO SET UP FOR GC (1 CONTRACT)
TRADITIONAL
BOX SIZE 1
CHART TIMEFRAME 1 MINUTE
__________________________
REGULAR CANDLE SETUP FOR MGC (2 MICROS)
15 MIN TIMEFRAME
__________________________
This strategy trades pullbacks within a trend, using two EMAs (fast/slow) to define uptrends and downtrends. It waits for a volatility “squeeze” , then looks for momentum ignition to go long, while shorts require a cross and optional band break/downtrend confirmation. Risk is handled with fixed dollar profit target and stop-loss values (converted to ticks), with exits placed immediately after entries and an automatic flat-at-session-close (New York time). Signals and risk lines are plotted.

TEMA 20/34/55 Strategie mit Buy & SellThis indicator uses three Triple Exponential Moving Averages (TEMA) with periods 20 (green), 34 (blue), and 55 (red) to identify trend direction.
A buy signal is generated when TEMA20 crosses above TEMA34 and TEMA34 crosses above TEMA55 (bullish trend start).
A sell signal is generated when TEMA20 crosses below TEMA34 and TEMA34 crosses below TEMA55 (bearish trend start).
The strategy enters long and short positions with configurable stop loss and take profit levels.
Ideal for trend following and suitable for intraday or swing trading.

ES cuhthis strategy uses laggard rsi to compute the best parameters to go long and tp at key levels. the overall trend strength within the rsi laggard indicator is what is used to automate the calculations within the script. enjoy and paramter optimize

Universal Regime Alpha Thermocline StrategyCurrents settings adapted for BTCUSD Daily timeframe
This description is written to comply with TradingView House Rules and Script Publishing Rules. It is self contained, in English first, free of advertising, and explains originality, method, use, defaults, and limitations. No external links are included. Nothing here is investment advice.
0. Publication mode and rationale
This script is published as Protected . Anyone can add and test it from the Public Library, yet the source code is not visible.
Why Protected
The engine combines three independent lenses into one regime score and then uses an adaptive centering layer and a thermo risk unit that share a common AAR measure. The exact mapping and interactions are the result of original research and extensive validation. Keeping the implementation protected preserves that work and avoids low effort clones that would fragment feedback and confuse users.
Protection supports a single maintained build for users. It reduces accidental misuse of internal functions outside their intended context which might lead to misleading results.
1. What the strategy does in one paragraph
Universal Regime Alpha Thermocline builds a single number between zero and one that answers a practical question for any market and timeframe. How aligned is current price action with a persistent directional regime right now. To answer this the script fuses three views of the tape. Directional entropy of up versus down closes to measure unanimity.
Convexity drift that rewards true geometric compounding and penalizes drag that comes from chop where arithmetic pace is high but growth is poor.
Tail imbalance that counts decisive bursts in one direction relative to typical bar amplitude. The three channels are blended, optionally confirmed by a higher timeframe, and then adaptively centered to remove local bias. Entries fire when the score clears an entry gate. Exits occur when the score mean reverts below an exit gate or when thermo stops remove risk. Position size can scale with the certainty of the signal.
2. Why it is original and useful
It mixes orthogonal evidence instead of leaning on a single family of tools. Many regime filters depend on moving averages or volatility compression. Here we add an information view from entropy, a growth view from geometric drift, and a structural view from tail imbalance.
The drift channel separates growth from speed. Arithmetic pace can look strong in whipsaw, yet geometric growth stays weak. The engine measures both and subtracts drag so that only sequences with compounding quality rise.
Tail counting is anchored to AAR which is the average absolute return of bars in the window. This makes the threshold self scaling and portable across symbols and timeframes without hand tuned constants.
Adaptive centering prevents the score from living above or below neutral for long stretches on assets with strong skew. It recovers neutrality while still allowing persistent regimes to dominate once evidence accumulates.
The same AAR unit used in the signal also sets stop distance and trail distance. Signal and risk speak the same language which makes the method portable and easier to reason about.
3. Plain language overview of the math
Log returns . The base series is r equal to the natural log of close divided by the previous close. Log return allows clean aggregation and makes growth comparisons natural.
Directional entropy . Inside the lookback we compute the proportion p of bars where r is positive. Binary entropy of p is high when the mix of up and down closes is balanced and low when one direction dominates. Intensity is one minus entropy. Directional sign is two times p minus one. The trend channel is zero point five plus one half times sign times intensity. It lives between zero and one and grows stronger as unanimity increases.
Convexity drift with drag . Arithmetic mean of r measures pace. Geometric mean of the price ratio over the window measures compounding. Drag is the positive part of arithmetic minus geometric. Drift raw equals geometric minus drag multiplier times drag. We then map drift through an arctangent normalizer scaled by AAR and a nonlinearity parameter so the result is stable and remains between zero and one.
Tail imbalance . AAR equals the average of the absolute value of r in the window. We count up tails where r is greater than aar_mult times AAR and down tails where r is less than minus aar_mult times AAR. The imbalance is their difference over their total, mapped to zero to one. This detects directional impulse flow.
Fusion and centering . A weighted average of the three channels yields the raw score. If a higher timeframe is requested, the same function is executed on that timeframe with lookahead off and blended with a weight. Finally we subtract a fraction of the rolling mean of the score to recover neutrality. The result is clipped to the zero to one band.
4. Entries, exits, and position sizing
Enter long when score is strictly greater than the entry gate. Enter short when score is strictly less than one minus the entry gate unless direction is restricted in inputs.
Exit a long when score falls below the exit gate. Exit a short when score rises above one minus the exit gate.
Thermo stops are expressed in AAR units. A long uses the maximum of an initial stop sized by the entry price and AAR and a trail stop that references the running high since entry with a separate multiple. Shorts mirror this with the running low. If the trail is disabled the initial stop is active.
Cooldown is a simple bar counter that begins when the position returns to flat. It prevents immediate re entry in churn.
Dynamic position size is optional. When enabled the order percent of equity scales between a floor and a cap as the score rises above the gate for longs or below the symmetric gate for shorts.
5. Inputs quick guide with recommended ranges
Every input has a tooltip in the script. The same guidance appears here for fast reading.
Core window . Shared lookback for entropy, drift, and tails. Start near 80 on daily charts. Try 60 to 120 on intraday and 80 to 200 for swing.
Entry threshold . Typical range 0.55 to 0.65 for trend following. Faster entries 0.50 to 0.55.
Exit threshold . Typical range 0.35 to 0.50. Lower holds longer yet gives back more.
Weight directional entropy . Starting value 0.40. Raise on markets with clean persistence.
Weight convexity drift . Starting value 0.40. Raise when compounding quality is critical.
Weight tail imbalance . Starting value 0.20. Raise on breakout prone markets.
Tail threshold vs AAR . Typical range 1.0 to 1.5 to count decisive bursts.
Drag penalty . Typical range 0.25 to 0.75. Higher punishes chop more.
Nonlinearity scale . Typical range 0.8 to 2.0. Larger compresses extremes.
AAR floor in percent . Typical range 0.0005 to 0.002 for liquid instruments. This stabilizes the math during quiet regimes.
Adaptive centering . Keep on for most symbols. Center strength 0.40 to 0.70.
Confirm timeframe optional . Leave empty to disable. If used, try a multiple between three and five of the chart timeframe with a blend weight near 0.20.
Dynamic position size . Enable if you want size to reflect certainty. Floor and cap define the percent of equity band. A practical band for many accounts is 0.5 to 2.
Cooldown bars after exit . Start at 3 on daily or slightly higher on shorter charts.
Thermo stop multiple . Start between 1.5 and 3.0 on daily. Adjust to your tolerance and symbol behavior.
Thermo trailing stop and Trail multiple . Trail on locks gains earlier. A trail multiple near 1.0 to 2.0 is common. You can keep trail off and let the exit gate handle exits.
Background heat opacity . Cosmetic. Set to taste. Zero disables it.
6. Properties used on the published chart
The example publication uses BTCUSD on the daily timeframe. The following Properties and inputs are used so everyone can reproduce the same results.
Initial capital 100000
Base currency USD
Order size 2 percent of equity coming from our risk management inputs.
Pyramiding 0
Commission 0.05 percent
Slippage 10 ticks in the publication for clarity. Users should introduce slippage in their own research.
Recalculate after order is filled off. On every tick off.
Using bar magnifier on. On bar close on.
Risk inputs on the published chart. Dynamic position size on. Size floor percent 2. Size cap percent 2. Cooldown bars after exit 3. Thermo stop multiple 2.5. Thermo trailing stop off. Trail multiple 1.
7. Visual elements and alerts
The score is painted as a subtle dot rail near the bottom. A background heat map runs from red to green to convey regime strength at a glance. A compact HUD at the top right shows current score, the three component channels, the active AAR, and the remaining cooldown. Four alerts are included. Long Setup and Short Setup on entry gates. Exit Long by Score and Exit Short by Score on exit gates. You can disable trading and use alerts only if you want the score as a risk switch inside a discretionary plan.
8. How to reproduce the example
Open a BTCUSD daily chart with regular candles.
Add the strategy and load the defaults that match the values above.
Set Properties as listed in section 6.(they are set by default) Confirm that bar magnifier is on and process on bar close is on.
Run the Strategy Tester. Confirm that the trade count is reasonable for the sample. If the count is too low, slightly lower the entry threshold or extend history. If the count is excessively high, raise the threshold or add a small cooldown.
9. Practical tuning recipes
Trend following focus . Raise the entry threshold toward 0.60. Raise the trend weight to 0.50 and reduce tail weight to 0.15. Keep drift near 0.35 to retain the growth filter. Consider leaving the trail off and let the exit threshold manage positions.
Breakout focus . Keep entry near 0.55. Raise tail weight to 0.35. Keep aar_mult near 1.3 so only decisive bursts count. A modest cooldown near 5 can reduce immediate false flips after the first burst bar.
Chop defense . Raise drag multiplier to 0.70. Raise exit threshold toward 0.48 to recycle capital earlier. Consider a higher cooldown, for example 8 to 12 on intraday.
Higher timeframe blend . On a daily chart try a weekly confirm with a blend near 0.20. On a five minute chart try a fifteen minute confirm. This moderates transitions.
Sizing discipline . If you want constant position size, set floor equal to cap. If you want certainty scaling, set a band like 0.5 to 2 and monitor drawdown behavior before widening it.
10. Strengths and limitations
Strengths
Self scaling unit through AAR makes the tool portable across markets and timeframes.
Blends evidence that target different failure modes. Unanimity, growth quality, and impulse flow rarely agree by chance which raises confidence when they align.
Adaptive centering reduces structural bias at the score level which helps during regime flips.
Limitations
In very quiet regimes AAR becomes small even with a floor. If your symbol is thin or gap prone, raise the floor a little to keep stops and drift mapping stable.
Adaptive centering can delay early breakout acceptance. If you miss starts, lower center strength or temporarily disable centering while you evaluate.
Tail counting uses a fixed multiple of AAR. If a market alternates between very calm and very violent weeks, a single aar_mult may not capture both extremes. Sweep this parameter in research.
The engine reacts to realized structure. It does not anticipate scheduled news or liquidity shocks. Use event awareness if you trade around releases.
11. Realism and responsible publication
No promises or projections of performance are made. Past results never guarantee future outcomes.
Commission is set to 0.05 percent per round which is realistic for many crypto venues. Adjust to your own broker or exchange.
Slippage is set at 10 in the publication . Introduce slippage in your own tests or use a percent model.
Position size should respect sustainable risk envelopes. Risking more than five to ten percent per trade is rarely viable. The example uses a fixed two percent position size.
Security calls use lookahead off. Standard candles only. Non standard chart types like Heikin Ashi or Renko are not supported for strategies that submit orders.
12. Suggested research workflow
Begin with the balanced defaults. Confirm that the trade count is sensible for your timeframe and symbol. As a rough guide, aim for at least one hundred trades across a wide sample for statistical comfort. If your timeframe cannot produce that count, complement with multiple symbols or run longer history.
Sweep entry and exit thresholds on a small grid and observe stability. Stability across windows matters more than the single best value.
Try one higher timeframe blend with a modest weight. Large weights can drown the signal.
Vary aar_mult and drag_mult together. This tunes the aggression of breakouts versus defense in chop.
Evaluate whether dynamic size improves risk adjusted results for your style. If not, set floor equal to cap for constancy.
Walk forward through disjoint segments and inspect results by regime. Bootstrapping or segmented evaluation can reveal sensitivity to specific periods.
13. How to read the HUD and heat map
The HUD presents a compact view. Score is the current fused value. Trend is the directional entropy channel. Drift is the compounding quality channel. Tail is the burst flow channel. AAR is the current unit that scales stops and the drift map. CD is the cooldown counter. The background heat is a visual aid only. It can be disabled in inputs. Green zones near the upper band show alignment among the channels. Muted colors near the mid band show uncertainty.
14. Frequently asked questions
Can I use this as a pure indicator . Yes. Disable entries by restricting direction to one side you will not trade and use the alerts as a regime switch.
Will it work on intraday charts . Yes. The AAR unit scales with bar size. You will likely reduce the core window and increase cooldown slightly.
Should I enable the adaptive trail . If you wish to lock gains sooner and accept more exits, enable it. If you prefer to let the exit gate do the heavy lifting, keep it off.
Why do I sometimes see a green background without a position . Heat expresses the score. A position also depends on threshold comparisons, direction mode, and cooldown.
Why is Order size set to one hundred percent if dynamic size is on . The script passes an explicit quantity percent on each entry. That explicit quantity overrides the property. The property is kept at one hundred percent to avoid confusion when users later disable dynamic sizing.
Can I combine this with other tools on my chart . You can, yet for publication the chart is kept clean so users and moderators can see the output clearly. In your private workspace feel free to add other context.
15. Concepts glossary
AAR . Average absolute return across the lookback. Serves as a unit for tails, drift scaling, and stops.
Directional entropy . A measure of uncertainty of up versus down closes. Low entropy paired with a directional sign signals unanimity.
Geometric mean growth . Rate that preserves the effect of compounding over many bars.
Drag . The positive difference between arithmetic pace and geometric growth. Larger drag often signals churn that looks active but fails to compound.
Thermo stops . Stops expressed in the same AAR unit as the signal. They adapt with volatility and keep risk and signal on a common scale.
Adaptive centering . A bias correction that recenters the fused score around neutral so the meter does not drift due to persistent skew.
16. Educational notice and risk statement
Markets involve risk. This publication is for education and research. It does not provide financial advice and it is not a recommendation to buy or sell any instrument. Use realistic costs. Validate ideas with out of sample testing and with conservative position sizing. Past performance never guarantees future results.
17. Final notes for readers and moderators
The goal of this strategy is clarity and portability. Clarity comes from a single score that reflects three independent features of the tape. Portability comes from self scaling units that respect structure across assets and timeframes. The publication keeps the chart clean, explains the math plainly, lists defaults and Properties used, and includes warnings where care is required. The code is protected so the implementation remains consistent for the community while the description remains complete enough for users to understand its purpose and for moderators to evaluate originality and usefulness. If you explore variants, keep them self contained, explain exactly what they contribute, publish in English first, and treat others with respect in the comments.
Load the strategy on BTCUSD daily with the defaults listed above and study how the score transitions across regimes. Then adjust one lever at a time. Observe how the trend channel, the drift channel, and the tail channel interact during starts, pauses, and reversals. Use the alerts as a risk switch inside your own process or let the built in entries and exits run if you prefer an automated study. The intent is not to promise outcomes. The intent is to give you a robust meter for regime strength that travels well across markets and helps you structure decisions with more confidence.
Thank you for your time to read all of this

Fury by Tetrad Fury by Tetrad
What it is:
A rules-based Bollinger+RSI strategy that fades extremes: it looks for price stretching beyond Bollinger Bands while RSI confirms exhaustion, enters countertrend, then exits at predefined profit multipliers or optional stoploss. “Ultra Glow” visuals are purely cosmetic.
How it works — logic at a glance
Framework: Classic Bollinger Bands (SMA basis; configurable length & multiplier) + RSI (configurable length).
Long entries:
Price closes below the lower band and RSI < Long RSI threshold (default 28.3) → open LONG (subject to your “Market Direction” setting).
Short entries:
Price closes above the upper band and RSI > Short RSI threshold (default 88.4) → open SHORT.
Profit exits (price targets):
Uses simple multipliers of the strategy’s average entry price:
Long exit = `entry × Long Exit Multiplier` (default 1.14).
Short exit = `entry × Short Exit Multiplier` (default 0.915).
Risk controls:
Optional pricebased stoploss (disabled by default) via:
Long stop = `entry × Long Stop Factor` (default 0.73).
Short stop = `entry × Short Stop Factor` (default 1.05).
Directional filter:
“Market Direction” input lets you constrain entries to Market Neutral, Long Only, or Short Only.
Visuals:
“Ultra Glow” draws thin layered bands around upper/basis/lower; these do not affect signals.
> Note: Inputs exist for a timebased stop tracker in code, but this version exits via targets and (optional) price stop only.
Why it’s different / original
Explicit extreme + momentum pairing: Entries require simultaneous band breach and RSI exhaustion, aiming to avoid entries on gardenvariety volatility pokes.
Deterministic exits: Multiplier-based targets keep results auditable and reproducible across datasets and assets.
Minimal, unobtrusive visuals: Thin, layered glow preserves chart readability while communicating regime around the Bollinger structure.
Inputs you can tune
Bollinger: Length (default 205), Multiplier (default 2.2).
RSI: Length (default 23), Long/Short thresholds (28.3 / 88.4).
Targets: Long Exit Mult (1.14), Short Exit Mult (0.915).
Stops (optional): Enable/disable; Long/Short Stop Factors (0.73 / 1.05).
Market Direction: Market Neutral / Long Only / Short Only.
Visuals: Ultra Glow on/off, light bar tint, trade labels on/off.
How to use it
1. Timeframe & assets: Works on any symbol/timeframe; start with liquid majors and 60m–1D to establish baseline behavior, then adapt.
2. Calibrate thresholds:
Narrow/meanreverting markets often tolerate tighter RSI thresholds.
Fast/volatile markets may need wider RSI thresholds and stronger stop factors.
3. Pick realistic targets: The default multipliers are illustrative; tune them to reflect typical mean reversion distance for your instrument/timeframe (e.g., ATRinformed profiling).
4. Risk: If enabling stops, size positions so risk per trade ≤ 1–2% of equity (max 5–10% is a commonly cited upper bound).
5. Mode: Use Long Only or Short Only when your discretionary bias or higher timeframe model favors one side; otherwise Market Neutral.
Recommended publication properties (for backtests that don’t mislead)
When you publish, set your strategy’s Properties to realistic values and keep them consistent with this description:
Initial capital: 10,000 (typical retail baseline).
Commission: ≥ 0.05% (adjust for your venue).
Slippage: ≥ 2–3 ticks (or a conservative pertrade value).
Position sizing: Avoid risking > 5–10% equity per trade; fixedfractional sizing ≤ 10% or fixedcash sizing is recommended.
Dataset / sample size: Prefer symbols/timeframes yielding 100+ trades over the tested period for statistical relevance. If you deviate, say why.
> If you choose different defaults (e.g., capital, commission, slippage, sizing), explain and justify them here, and use the same settings in your publication.
Interpreting results & limitations
This is a countertrend approach; it can struggle in strong trends where band breaches compound.
Parameter sensitivity is real: thresholds and multipliers materially change trade frequency and expectancy.
No predictive claims: Past performance is not indicative of future results. The future is unknowable; treat outputs as decision support, not guarantees.
Suggested validation workflow
Try different assets. (TSLA, AAPL, BTC, SOL, XRP)
Run a walkforward across multiple years and market regimes.
Test several timeframes and multiple instruments. (30m Suggested)
Compare different commission/slippage assumptions.
Inspect distribution of returns, max drawdown, win/loss expectancy, and exposure.
Confirm behavior during trend vs. range segments.
Alerts & automation
This release focuses on chart execution and visualization. If you plan to automate, create alerts at your entry/exit conditions and ensure your broker/venue fills reflect your slippage/fees assumptions.
Disclaimer
This script is provided for educational and research purposes. It is not investment advice. Trading involves risk, including the possible loss of principal. © Tetrad Protocol.

ALMASTO – Pro Trend & Momentum (v1.1)ALMASTO — Pro Trend & Momentum Strategy
Description:
This strategy is designed for precision trading in both Forex (FX) and Crypto markets.
It combines multi-timeframe trend confirmation (EMA200), momentum filters (RSI, MACD, ADX), and ATR-based dynamic risk management.
ALMASTO — Pro Trend & Momentum Strategy automatically manages take-profit levels, stop-loss, and breakeven adjustments once TP1 is reached — providing a structured and emotion-free trading approach.
Optimal Use
Works best on lower timeframes (5m–15m) with strong liquidity sessions.
Optimized for pairs like EURUSD, XAUUSD, and BTCUSDT.
Built for trend-following setups and momentum reversals with high volatility confirmation.
Recommended Settings
🔹 Forex – 5m
EMA Fast = 34, EMA Slow = 200, HTF = 1H
RSI (14): Long ≥ 55 / Short ≤ 45
MACD (8 / 21 / 5), ADX Len 10 / Min 27
ATR Len 7, Stop Loss = ATR × 2.1
TP1 = 1.1 RR, TP2 = 2.3 RR
Session = 07:00–11:00 & 12:30–16:00 (Exchange Time)
Risk = 0.8% per trade
🔹 Forex – 15m
EMA Fast = 50, EMA Slow = 200, HTF = 4H
RSI (14): Long ≥ 53 / Short ≤ 47
MACD (12 / 26 / 9), ADX Min 24
ATR Len 10, SL = ATR × 1.9
TP1 = 1.2 RR, TP2 = 2.6 RR
Risk = 1.0% per trade
🔹 Crypto – 5m (BTC/USDT)
EMA Fast = 34, EMA Slow = 200, HTF = 4H
RSI (14): Long ≥ 56 / Short ≤ 44
MACD (8 / 21 / 5), ADX Min 30
ATR Len 7, SL = ATR × 2.2
TP1 = 1.0 RR, TP2 = 2.5 RR
Session = 00:00–06:00 & 12:00–22:00 (UTC)
Risk = 0.5% per trade
Core Features
✅ Auto breakeven after TP1
✅ Dual take-profit system (1:1 & 1:2 RR)
✅ ATR-based stop & trailing logic
✅ Filters for session time, volume, and volatility
✅ Candle-body vs ATR size filter to avoid noise
✅ Optional cooldown between trades
Important Notes
Use bar close confirmation only (barstate.isconfirmed) to avoid repainting on lower timeframes.
Adjust commission (0.01–0.03%) and slippage (1–2 ticks) in Strategy Tester for realistic results.
Avoid low-liquidity hours (after 21:00 UTC for FX / after midnight for crypto).
Backtest using realistic broker data (e.g., BlackBull Markets / Bybit / Binance Futures).
Best results occur during London & New York sessions with moderate volatility.
⚠️ Disclaimer
This script is for educational and research purposes only.
It does not constitute financial advice.
Use proper risk management and test thoroughly before using on live accounts.
Developed by KING FX Labs
Built and optimized by Yousef Almasto — combining advanced price-action logic, multi-timeframe EMA structure, and volatility-adaptive ATR management.
Tested across Forex, Gold, and Crypto markets to ensure consistent performance and minimal drawdown.
📈 “Precision Trading. Zero Emotion. Pure Momentum.”
