Scalping Dips On Trend (by Coinrule)Coinrule's Community is an excellent source of inspiration for our trading strategies.
In these months of Bull Market, our traders opted mostly on buy-the-dips strategies, which resulted in great returns recently. But there has been an element that turned out to be the cause for deep division among the Community.
Is it advisable or not to use a stop-loss during a Bull Market?
This strategy comes with a large stop-loss to offer a safer alternative for those that are not used to trade with a downside protection.
Entry
The strategy buys only when the price is above the Moving Average 50 , making it less risky to buy the dip, which is set to 2%.
The preferred time frame is 1-hour.
The stop-loss is set to be quite loose to increase the chances of closing the trade in profit, yet protecting from unexpected larger drawdowns that could undermine the allocation's liquidity.
Exit
Stop loss: 10%
Take Profit: 3%
In times of Bull Market, such a trading system has a very high percentage of trades closed in profit (ranging between 70% to 80%), which makes it still overall profitable to have a stop-loss three times larger than the take profit.
Pro tip: use a larger stop-loss only when you expect to close in profit most of the trades!
The strategy assumes each order to trade 30% of the available capital and opens a trade at a time. A trading fee of 0.1% is taken into account.
Bitcoin (Mata Wang Kripto)

Flawless Victory Strategy - 15min BTC Machine Learning StrategyHello everyone, I am a heavy Python programmer bringing machine learning to TradingView. This 15 minute Bitcoin Long strategy was created using a machine learning library and 1 year of historical data in Python. Every parameter is hyper optimized to bring you the most profitable buy and sell signals for Bitcoin on the 15min chart. The historical Bitcoin data was gathered from Binance API, in case you want to know the best exchange to use this long strategy. It is a simple Bollinger Band and RSI strategy with two versions included in the tradingview settings. The first version has a Sharpe Ratio of 7.5 which is amazing, and the second version includes the best stop loss and take profit positions with a Sharpe Ratio of 2.5 . Let me talk a little bit more about how the strategy works. The buy signal is triggered when close price is less than lower Bollinger Band at Std Dev 1, and the RSI is greater than a certain value. The sell signal is triggered when close price is greater than upper Bollinger Band at Std Dev 1, and the RSI is greater than a certain value. What makes this strategy interesting is the parameters the Machine Learning library found when backtesting for the best Sharpe Ratio. I left my computer on for about 28 hours to fully backtest 5000 EPOCHS and get the results. I was able to create a great strategy that might be one of TradingView's best strategies out on the website today. I will continue to apply machine learning to all my strategies from here on forward. Please Let me know if you have any questions or certain strategies you would like me to hyper optimize for you. I'm always willing to create profitable strategies!
P.S. You can always pyramid this strategy for more gains! I just don't add pyramiding when creating my strategies because I want to show you the true win/loss ratio based buying one time and one selling one time. I feel like when creating a strategy that includes pyramiding right off the bat falsifies the win rate. This is my way of being transparent with you all. Have fun trading!

Multi Moving Average Crossing (by Coinrule)Moving Averages are among the most common trading indicators. They are straightforward to interpret and effective to use.
One of the limitations of using moving averages is they can provide buy and sell signals with a relatively high lag , making it very difficult to spot the lows and tops of the trend.
Moving averages calculated with a low number of periods like the MA9 (the average of the previous nine price periods) react very fast to price moves providing prompt signals. On the other side, more signals may end up with more false-signals and more trades in a loss.
On the contrary, moving averages calculated with a higher number of periods like the MA100 (which considers the previous one hundred price periods) give more reliable signals, but with a delay.
A system catching the crossing of the MA50 over the MA100 is a good compromise for successful long-term strategies. It provides, on average, reliable buy signals.
The Multi Moving Average Crossing Strategy tries to optimize the exit without waiting for the same opposite crossing (MA50 below MA100). It uses the MA9 crossing below the MA50, instead, to spot a better time for selling.
The setup is as follows.
BUY when the Moving Average 50 crosses above the Moving Average 100
SELL when the Moving Average 9 crosses below the Moving Average 50
The higher is the time frame to calculate the Moving Averages, the better is the overall performance of the strategy. The 4-hour (or 6-hour) time frame seems to be the best, even if it results in fewer trades. If you want to trade more still with good results, the 1-hour time is a good compromise.
Advantages of the strategy
This strategy seeks to catch those that are more likely relevant uptrends and close the trade relatively quickly. More trades mean more opportunities. This is especially effective if you run the strategy on all the available coins on the market, as you could do with Coinrule.
Generally, a Multi Moving Averages approach beats the classic crossing strategy involving only two Moving Averages. We backtested a sample of twenty trading pairs to assess the benefits empirically.
The results show that the Multi Moving Average Strategy
outperforms 13 out of 20 times
has 95% higher average return
has 67% higher median return
The strategy assumes each order to trade 30% of the available capital and opens a trade at a time. A trading fee of 0.1% is taken into account.

Scalping using RSI 2 indicator with TSLThis strategy implements a simply scalping using the RSI (calculated on two periods), the slopes of two MAs ( EMA or SMA ) having different lengths (by default, I use 50 and 200).
A trailing stop loss (%) is used.
Entry conditions:
.) Fast MA > Slow MA and Price > Slow MA and RSI < Oversold Threshold ------> go Long
.) Fast MA < Slow MA and Price < Slow MA and RSI > Overbought Threshold ------> go Short
Exit conditions:
.) Long entry condition is true and (close >= TP or close <= TSL ) ----> close short position
.) Short entry condition is true and (close <= TP or close >= TSL ) ----> close long position
The strategy performed best on Bitcoin and the most liquid and capitalized Altcoins but works excellent on volatile assets, mainly if they often go trending.
Works best on 3h - 4h time frame.
There's also an optional Volatility filter, which opens the position only if the difference between the two slopes is more than a specific value, which can be set in the study inputs. The purpose is not opening positions if the price goes sideways and the noise is way > than the signal.
Note:
.) the RSI length is 2;
.) the oversold Threshold is 90%;
.) the overbought Threshold is 10%;
.) by default, the trailing stop loss per cent is 1%;
.) by default, the fast MA length is 50;
.) by default, the slow MA length is 200;
.) by default, the MA used is EMA.
Cheers.

RSI Classic Strategy (by Coinrule)One of the questions hobbyist traders more often ask is: what is the perfect trading indicator?
Every indicator is just a tool, so its efficiency is proportional to your ability to read its signals and translate them into an actionable trading strategy. The RSI is likely the most flexible and easy to use among the technical indicators.
This trading strategy tries to catch short-term swings on the coins of your choice with a simple yet profitable setup.
Buy when the RSI is lower than 30 (you can adjust it to 35 in times of steep uptrend).
Sell when the RSI is greater than 65 (the target may range between 60 and 75 depending on the volatility of the coin).
Note that the buy signal comes when the indicator crosses below 30 and not when it crosses above 30 as it happens on the built-in RSI strategy on Tradingview.
The present script overperforms the built-in strategy, even adding trading fees and using a lower amount of capital for each trade (30%). That means that the system can deliver higher net-profits with lower risk levels.
A typical example of market conditions where this strategy works perfectly is as follows.
The first initial breakout indicates that a new leg up in the trend may start. Bitcoin starts to trade within a range which you can identify when it reaches the point 3. That is the perfect time to start the rule because
- trading within a channel anticipates possible swings up and down
- the trend is on the upside, providing low downside risk in buying the dips.
This strategy works well with selected coins of your choice, and it's a great fit on leverage exchanges like Binance Futures.
If you prefer to run it across all available coins on the market, instead, you may choose an optimized version.

KAMA Strategy - Kaufman's Adaptive Moving AverageThis strategy combines Kaufman's Adaptive Moving Average for entry with optional KAMA, PSAR, and Trailing ATR stops for exits.
Kaufman's Adaptive Moving Average is, in my opinion, a gem among the plethora of indicators. It is underrated considering it offers a solution that intuitively makes a lot of sense. When I first read about it, it was a real 'aha!' moment. Look at the top, pink line. Notice how during trending times it follows the trend quickly and closely, but during choppy, non-trending periods, the KAMA stays absolutely flat? Interesting! To trade with it, we simply follow the direction the KAMA is pointing. Is it up? Go long. Is it down? Go short. Is it flat? Hold on.
How does it manage to quickly follow real trends like a fast EMA but ignore choppy conditions that would whipsaw a fast EMA back and forth? It analyses whether recent price moves are significant relative to recent noise and then adapts the length of the EMA window accordingly. If price movement is big compared to the recent noise, the EMA window gets smaller. If price movement is relatively small or average compared to the recent noise, the EMA window gets bigger. In practice it means:
The KAMA would be flat if a 20 point upwards move occurred during a period that has had, on average, regular 20 point moves BUT
the KAMA would point up if a 20 point move occurred during a period that has, on average, had moves of only around 5 points.
In other words, it's a slow EMA during choppy flat / quiet flat periods, and a fast EMA as soon as significant volatility occurs. Perfect!
-----
The Strategy
The strategy is more than just a KAMA indicator. It contains:
KAMA exit (optional)
ATR trailing stop loss exit (optional)
PSAR stop loss exit (optional)
KAMA filter for entry and exits
All features are adjustable in the strategy settings
The Technical Details:
Check out the strategy's 'Inputs' panel. The buy and sell signals are based on the 'KAMA 1' there.
KAMA 1: Length -- 14 is the default. This is the length of the window the KAMA looks back over. In this instance, it c
KAMA 1: Fast KAMA Length -- 2 is the default. This is the tightest the EMA length is allowed to get. It will tend towards this length when volatility is high.
KAMA 1: Slow KAMA Length -- 20 is the default. This is the biggest the EMA length is allowed to get. It will tend towards this length when volatility is low.
KAMA Filter
The strategy buys when the KAMA begins to point up and sells when the KAMA points down. Generally, the KAMA is very good at filtering out the noise itself - it will go flat during noisy/choppy periods. But to add another layer of safety, its author, Perry Kaufman, proposed a KAMA filter. It works by taking the standard deviation of returns over the length of the the 'KAMA 1: Length' I mentioned above and multiplying it by an 'Entry Filter' (1 by default) and 'Exit Filter' (0.5 by default). The entry condition to go long is that the KAMA is pointing up and and it moved up more than 1 x St. Dev. of Returns. The exit condition is when the KAMA is pointing down and it moved down by more than 0.5 x St. Dev. of Returns.
Thanks
Thanks to ChuckBanger, cheatcountry, millerrh, and racer8 for parts of the code. I was able to build upon their good work.
-----
I hope this strategy is helpful to you.
Do you have any thoughts, ideas, or questions? Let me know in the comments or send me a message! I'd be glad to help you out.
If you need an indicator or strategy to be built or customised for you, let me know! I'll be glad to help and it'll probably be cheaper than you think!

BTC and ETH Long strategy - version 2I wrote my first article in May 2020. See below
BTC and ETH Long strategy - version1
After 6 months, it is now time to check the result of my script for the last 6 months.
XBTUSD (4H): 14/05/2020 --> 22/11/2020 = +78% in 4 trades
ETHXBT (4H): 14/05/2020 --> 22/11/2020 = +21% in 9 trades
ETHUSD (4H): 14/05/2020 --> 22/11/2020 = +90% in 6 trades
Using the signals from this strategy to trade manually has shown that this was a bit frustrating because of the low rate of winning trades.
If you have to enter 100 trades and see 75% of them failing and 25% winning, this is frustrating. For sure the strategy makes good money but it is difficult to hold this mentality.
So, I have reviewed and modified it to get a higher winning rate.
After few days of work, tests and validation, I managed to get a wining rate close to 60%.
The key element was also to decrease the number of trades by using a higher time frame. (4H candles instead of 2H candles).
- Entry in position is based on
MACD, EMA (20), SMA (100), SMA (200) moving up
AND EMA (20) > SMA (100)
AND SMA (100) > SMA (200)
- Exit the position if: Stoploss is reached OR EMA (20) crossUnder SMA (100)
The goal of this new script is to be able to follow the signals manually and only make few trades per years.
I have also validated it against some other altcoins where some are giving very good results.
Here are some results for 2020 (from 01/01/2020 until now (22/11/2020). Those results are the one I get when using 4H candles.
ETH/USD: +144% in 8 trades.
BTC/USD: +120% in 7 trades.
ETH/BTC: +33% in 9 trades.
ICX/USD: +123% in 10 trades.
LINK/USD: +155% in 11 trades.
MLN/USD: +388% in 8 trades.
ADA/USD: +180% in 7 trades.
LINK/BTC: +97% in 10 trades.
The best is that above results are without considering compound effect. If you re-invest all gains done in each new trade, this will give you the below results :)
ETH/USD: +189% in 8 trades.
BTC/USD: +260% in 7 trades.
ETH/BTC: +29% in 9 trades.
ICX/USD: +112% in 10 trades.
LINK/USD: +222% in 11 trades.
MLN/USD: +793% in 8 trades.
ADA/USD: +319% in 7 trades.
LINK/BTC: +103% in 10 trades.
As you can see, the results are good and the number of trades for 11 months is not big, which allows the trader to place orders manually.
But still, I'm lazy :), so, I have also coded this strategy in HaasScript language which allows you to automate this strategy using the HaasOnline software specialized in automated crypto trading.
I hope that this strategy will give you ideas or will be the starting point for your own strategy.
Let me know if you need more details.

Channel Break [for free bot]I present to you a script for testing the channel breakout strategy for the Bitmex exchange.
Cryptocurrency itself is a trending tool, which is why breakout strategies generate the largest profits, and the channel breakout strategy is one of the most effective trend strategies.
The optimization result shows the result of trading on a volume of 20% of the deposit. But since Bitmex trades in futures contracts, you can use 50%, 100% and even much more, depending on your attitude to risk.
At the time of publication on the Bitmex exchange there are 12 different contracts, i.e. You can diversify your trading well (by pre-optimizing the settings for each contract).
In the script, you can set up many trading options - timeframe, periods for buying and selling, method of exiting a trade, stop loss, take profit, risk management, etc.
Thus, you create a strategy "for yourself".
Представляю Вам скрипт для тестирования стратегии пробоя канала для биржи Битмекс.
Криптовалюта, сама по себе является трендовым инструментом, именно поэтому, пробойные стратегии генерируют самую большую прибыль, а стратегия пробоя канала – является одной из самых эффективных трендовых стратегий.
На результате оптимизации показан результат торговли на объеме в 20% от депозита. Но так как на Битмекс торговля идет фьючерсными контрактами, Вы можете использовать 50%, 100% и даже намного больше, в зависимости от Вашего отношения к риску.
На момент публикации на бирже Битмекс есть 12 разных контрактов, т.е. Вы можете хороши диверсифицировать свою торговлю (предварительно оптимизируя настройки по каждый контракт).
В скрипте Вы можете настроить множество вариантов торговли - таймфрейм, периоды для покупки и продажи, метод выхода из сделки, стоп-лосс, тейк-профит, рискменеджмент и т.п.
Таким образом Вы создаете стратегию "под себя".

EMA Slope Cross Trend Follower StrategyThis strategy uses the cross of the slopes of two EMAs having different lengths to generate trend follower signals. By default, I use 130 and 400, which behave very well.
The conditions which make the strat enter the market are:
- Fast Slope > Slow Slope and price > EMA 200 : go Long
- Fast Slope < Slow Slope and price < EMA200 : go Short
The simple slopes cross in the opposite direction, closes the position.
The strategy performs best on Bitcoin and the most liquid and capitalized Altcoins, but works greatly on volatile assets as well, in particular if they often go trending.
Works best on 4h time frame.
There's also an optional Volatility filter, which opens the position only if the difference between the two slopes is more than a specific value, which can be set in the strategy inputs. The purpose is not opening positions if price is going sideways and the noise is way > than the signal.
Enjoy it!

EMA Slope Trend Follower StrategyThis strategy is based on the slope of the EMA130.
Over that slope, the script calculates two EMAs (9,21) which are used to generate the main entry and exit signal.
In particular, the strategy enters a LONG position when EMA9 > EMA21. On the contrary, it closes the LONG and opens a SHORT when EMA9 < EMA21.
When the slope of the EMA130 is rising, it means that the price is accelerating upwards, fueling an uptrend. Conversely, when the slope is falling, it means that the price is slowing down, falling into a possible downtrend.
Calculating and analyzing two EMAs (fast and slow) over the slope of a medium length EMA instead of the price anticipates a lot the signal. In this way, the strategy never miss a trend.
In order to minimize false positives (entering useless positions), I included two filters, which can be optionally turned on:
- Trend Filter: When the price is above EMA200, the strategy opens ONLY LONG positions. If price < EMA200, only shorts allowed. If the slope gives a long signal and price is below EMA200, for example, the eventual SHORT position is closed, but the LONG entry is postponed to the moment when both conditions (slope uptrending and price > ema200) are met.
I recommend always turning on this filter, as it dramatically decreases drawdown.
- Volatility Filter: When the standard deviation of the last 20 candles is below its 50 samples moving average, no positions are opened, as market is going sideways. The purpose of this filter is to prevent false positives (positions which open and close in a matter of candles due to false signals in sideways market).
I recommend turning on this filter only on low time frames.
This strategy works great on medium time frames (like 4h, 6h, daily), since it spends way less in fees, opening less positions.
It works good on low TFs too (up to 1h, didn't test lower ones), provided Volatility filter is turned on and parameters are set according to the asset.
Commission included in calculations: 0.06% (it's the taker commission on BitMEX with the 10% discount obtainable with any referral link)
Slippage included in calculations: 2 ticks (BitMEX has very liquid order books, and slippage doesn't happen very often unless a huge position size is used).

BTC and ETH Long strategy - version 1I will start with a small introduction about myself. I'm now trading cryto currencies manually for almost 2 years. I decided to start after watching a documentary on the TV showing people who made big money during the Bitcoin pump which happened at the end of 2017.
The next day, I asked myself "Why should I not give it a try and learn how to trade".
This was in February 2018 and the price of Bitcoin was around 11500USD.
I didn't know how to trade. In fact, I didn't know the trading industry at all.
So, my first step into trading was to open an account with a broken. Then I directly bought 200$ worst of BTC . At that time, I saw the graph and thought "This can only go back in the upward direction!" :)
I didn't know anything about Stop loss, Take profit and Risk management.
Today, almost 2 years after, I think that I know how to trade and can also confirm that I still hold this bag of 200$ of bitcoin from 2018 :)
I did spend the 2 last years to learn technical analysis , risk management and leverage trading.
Today (14/05/2020), I know what I'm doing and I'm happy to see that the 2 last years have been positive in terms of gains. Of course, I did not make crazy money with my saving but at least I made more than if I would have kept it in my bank account.
Even if I like trading, I have a full time job which requires my full energy and lots of focus, so, the biggest problem I had is that I didn't have enough time to look at the charts.
Also, I realized that sometimes, neither technical analysis , nor fundamentals worked with crypto currency (at least for short time trading). So, as I have a developer background I decided to try to have a look at algo trading.
The goal for me was neither to make complex algos nor to beat the market but just to automate my trading with simple bot catching the big waves.
I then started to take a look at TV pine script and played with it.
I did my first LONG script in February 2020 to Long the BTC Market. It has some limitations but works well enough for me for the time being. Even if the real trades will bring me half of what the back testing shows, this will still be a lot more than what I was used to win during the last 2 years with my manual trading.
So, here we are! Below you will find some details about my first LONG script. I'm happy to share it with you.
Feel free to play with it, give your comments and bring improvements to it.
But please note that it only works fine with the candle size and crypto pair that I have mentioned below. If you use other settings this algo might loose money!
- Crypto pairs : XBTUSD and ETHXBT
- Candle size: 2 Hours
- Indicator used: Volatility , MACD (12, 26, 7), SMA (100), SMA (200), EMA (20)
- Default StopLoss: -1.5%
- Entry in position if: Volatility < 2%
AND MACD moving up
AND AME (20) moving up
AND SMA (100) moving up
AND SMA (200) moving up
AND EMA (20) > SAM (100)
AND SMA (100) > SMA (200)
- Exit the postion if: Stoploss is reached
OR EMA (20) crossUnder SMA (100)
Here is a summary of the results for this script:
XBTUSD : 01/01/2019 --> 14/05/2020 = +107%
ETHXBT : 01/01/2019 --> 14/05/2020 = +39%
ETHUSD : 01/01/2019 --> 14/05/2020 = +112%
It is far away from being perfect. There are still plenty of things which can be done to improve it but I just wanted to share it :) .
Enjoy playing with it....

SMA Cross strategyThis is a simple strategy which is always profitable and trades better than most premium channels and I give it out for free :)
Working very good on ETHUSDT futures on binance :)

Stochastic Pop and Drop by Jake Bernstein v1 [Bitduke]I found a simple strategy by Jake Bernstein, modified it a little and created a strategy with Risk Management System (SL+TP); After that I test it on the different cryptocurrency pairs.
About the Indicator
Basically it's the strategy of 2 indicators: Stochastic Oscillator to define the bias and Average Directional Index to confirm it.
One again, It uses Stochastic Oscillator to define the trading bias. In particular, the trading bias was deemed bullish when the weekly 14-period Stochastic Oscillator was above some default value (in him paper - 50) and rising and vice versa.
Once the trading bias is established, Steckler used the Average Directional Index (ADX) to define a slowdown in the trend. ADX measures the strength of the trend and a move below 20 signals a weak trend.
Modifications
I didn't implement Average Directional Index (ADX) and test just different sources for data, oscillator periods and different levels in relation to the crypto market.
So, it shows good results with two tight thresholds at 55 and 45 level.
The bar chart below the defining the bullish and bearish periods (green and red) and gives a signal to enter the trade (purple bars).
Backtesting
Backtested on XBTUSD , BTCPERP (FTX) pairs. You may notice it shows good results on 3h timeframe.
Relatively low drawdown
~ 10% (from 2019 to date) FTX
~ 22% (4 years from 2016) Bitmex
I backtested on the different altcoin pairs as well, but the results were just not good.
Relatively good results were shown by some index pairs from the FTX exchange ( FTX:SHITPERP ), but I think there is a few data for backtesting to be asure in them.
Bitmex 3h (2017 - 2020) :
i.imgur.com
FTX 3h (2019 - 2020):
i.imgur.com
Possible Improvements
- Regarding trading algorithm it would be good to check with strategy with ADX somehow. Maybe for the better entries
- As for Risk Management system, it can be improved by adding trailing stop to the strategy.
Link: school.stockcharts.com

UT Bot Strategy with Backtesting Range [QuantNomad]UT Bot indicator was inially developer by @Yo_adriiiiaan
Idea of original code belongs @HPotter
I can't update my original UT Bot Strategy so I publishing new strategy with backtesting range included.
I just took code of Yo_adriiiiaan, cleaned it, deleted all useless pieces of code, transformet to v4 and created a strategy from it.
Also I added an input that allows you to swich to signals from Heiking Ashi. I saw that author uses HA for the indicator and on HA it look much nices then on real candles.
Do not add this strategy to HA candles, use usual candles and this checkbox.
Original script:
UT Bot

Squeeze Momentum Strategy based on Indicator [LazyBear][Bitduke]I improved Squeeze Momentum Indicator by LazyBear (momentum filter, changed data source to ohlc4) and transformed it into a strategy, adding a risk management system + ability to customize time frames for backtest.
Shortly about Squeeze Momentum Indicator:
This is a derivative of John Carter's "TTM Squeeze" volatility indicator, as discussed in his book "Mastering the Trade" (chapter 11).
Backtested on XBTUSD, ETHUSD (Bitmex). As you may notice it shows good results on 1h - 4h timeframes on these timeframes among these pairs. Relatively low drawdown ~ 12% (to date).

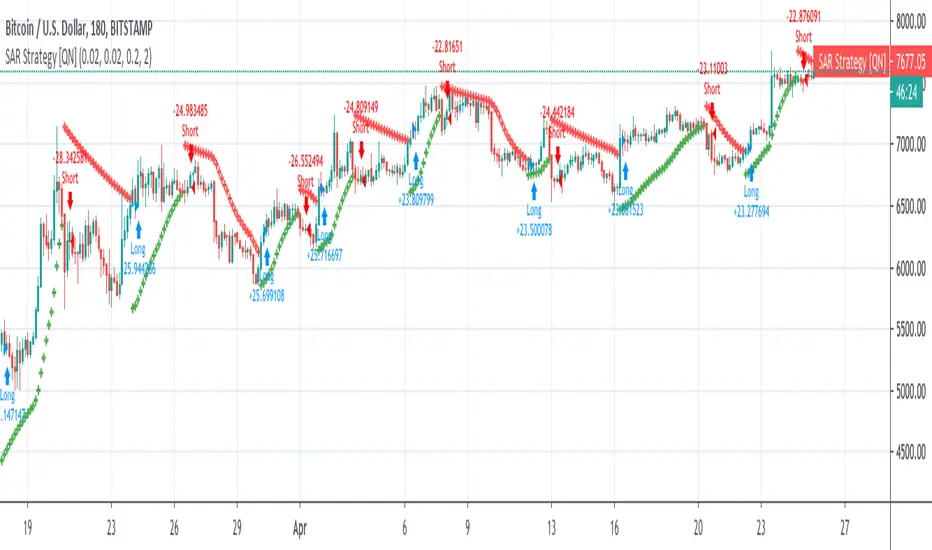
Parabolic SAR Strategy (on close) [QuantNomad]Created a Parabolic SAR strategy where price has to close under/above the level before for it to reverse. This way it should be a bit more stable and protect you from false breakouts.
It was impossible to adjust the built-in "sar" function so I implemented PSAR from scratch. So if you're interested in how it's work inside you can check the code and probably adjust to your need if you have a custom modification of PSAR in your mind.
Leverage Strategy and a few words on risk/opportunityHello traders,
I started this script as a joke for someone... finally appears it could be used for educational content
Let's talk about leverage and margin call
Margin Call
A margin call is the broker's demand that an investor deposit additional money or securities so that the account is brought up to the minimum value, known as the maintenance margin.
A margin call usually means that one or more of the securities held in the margin account has decreased in value below a certain point.
Leverage
A leverage is a system which allows the trader to open positions much larger than his own capital. ... “Leverage” usually refers to the ratio between the position value and the investment needed,
Strat
The strategy simulates long/short positions on a 4h high/low breakout based on the chart candle close.
The panel below shows the strategy equity curve. Activating the margin call option will show when the account would be margin called giving the settings
Casino
I'm not doing any financial recommendation here.
I made this strategy so that people include more risk management metrics into their strategy.
From the code, we see it's fairly easy to calculate a leveraged position size and a margin call flag - when that flag is hit, the system stops trading.
I simplified things to the extreme here but my point is that the leverage is a double-edge sword gift.
Assuming we always take the same position sizing, increasing the leverage speed up how fast a margin could be ..... called. (bad joke? feel free to tell me). Not saying it will, saying it introduces more risk by design.
Then one could say "I'll just turn off that stupid margin call option". And that's when someone starts backtesting with unrealistic market conditions.
Finally...
When I backtest I always assume the worst in every scenario possible (because I'm French), I always try to minimize the risk first (also because I'm French), keeping as close from 0 as possible (French again)
Then I add the "opportunity" component, looking to catch the maximum of opportunity while keeping the risk low.
It's like a Rubix cube puzzle - decreasing the risk is one side of the equation but whenever I try to catch more opportunity... my risks increases.
Then I update my risk... and now the opportunity decreases... (#wut #wen #simple)
Completely removing the risk from a trading strategy isn't something I wouldn't dare doing.
Trading involves risk. Being obsessed by decreasing the risk is what I do BEST :)
Dave

UT Bot StrategyUT Bot indicator was inially developer by @Yo_adriiiiaan
Idea of original code belongs @HPotter
I just took code of Yo_adriiiiaan, cleaned it, deleted all useless pieces of code, transformet to v4 and created a strategy from it.
Also I added an input that allows you to swich to signals from Heiking Ashi. I saw that author uses HA for the indicator and on HA it look much nices then on real candles.
Do not add this strategy to HA candles, use usual candles and this checkbox.
Original script:

QuantNomad - EVWMA MACD StrategyPretty simple EVWMA (Elastic Volume Weighted Moving Average ) MACD Strategy.
EVWMA is a quite interesting moving average where the period of the MA is defined from the volume itself.
It incorporates volume information in a natural and logical way. The EVWMA can be looked at as an approximation to the average price paid per share.
As a volume period, you can use sum of the last x bars volumes.
Here are other EVWMA indicators/strategies:
EVWMA indicator:
EVWMA Cross strategy:

QuantNomad - EVWMA Cross StrategyPretty simple EVWMA (Elastic Volume Weighted Moving Average) Cross Strategy. Long on bullish cross, Short on Bearish Crosss.
EVWMA is a quite interesting moving average where period of the MA is defined from volume itself.
It incorporates volume information in a natural and logical way. The eVWMA can be looked at as an approximation to the average price paid per share.
As a volume period you can use sum of the last x bars volumes.
Here is EVWMA as an indicator:

Super Trend Daily BF 🚀Super Trend is based on volatility and attempts to show the overall greater trend of a market. Thanks to everget for the idea of improving the Super Trend code. Thanks to kiasaki for ROC code.
The idea here is to enter a trade upon trend reversal (unless we have a white background - this indicates choppy/sideways market).
INSTRUCTIONS
Follow the background color for signals of a trend reversal.
Bright green = long
Bright red = short
White = no trade
We use a fixed stop loss here of 6% but I have included the option to apply an ATR based stop loss in Settings. No take profit. No re-entering until we get an opposing signal.
I use a Rate of Change function to detect when we should stay out due to choppy sideways price action.
This strategy was optimised for XBT/USD on Bitmex 1 day chart, ideal settings for other pairs will differ.

REAL STRATEGY : Dow_Factor_MFI/RSI_DVOG_StrategyI'm actually one of those who think it's more important to extract clues from indicators than strategy, but I wanted to test the data about the probability and dow factor I've shared for a long time.
Usually, Bitcoin is used as an eye stain for strategy success, since the graph has increased significantly from the beginning.
To prevent this, I used a commission and in the last lines of document I shared Bitmex's Bitcoin and Ethereum 1W test results.
I don't think there's a factor to repaint. ( Warn me if u see or observe )
I considered Bitcoin because I found working with liquid parities much more realistic.
Ethereum and Bitmex have been featured as a spot and may soon find a place at the CME , so I've evaluated the Ethereum .
But since the Ethereum Bitmex was also spot new, I deleted results that were less than 10 closed trades.
Since the Dow Theory also looks at the harmony in the indices, just try it in the Cryptocurrency market.
Use as indicator in other markets. Support with channels, trend lines with big periods and other supportive indicators.
And my personal suggestion : Use this script and indicator TF : 4H and above.
Specifications :
Commission. ( % 0.125 )
Switchable Methods ( Relative Strength Index / Money Flow Index )
Alarms. (Buy / Sell )
Position closure when horizontal market rates weighs.
Progressive gradual buy/sell alarms.
Clean code layout that will not cause repaint. (Caution : source = close )
Switchable barcolor option (I / 0 )
*****Test results :*****
drive.google.com
Summary:
It was a realistic test.
It has achieved great success in some markets, but as I mentioned earlier, use it only to gain insight into the price movements of cryptos.
Use as indicator in other markets.
This code is open source under the MIT license. If you have any improvements or corrections to suggest, please send me a pull request via the github repository : github.com
Stay tuned ! Noldo.

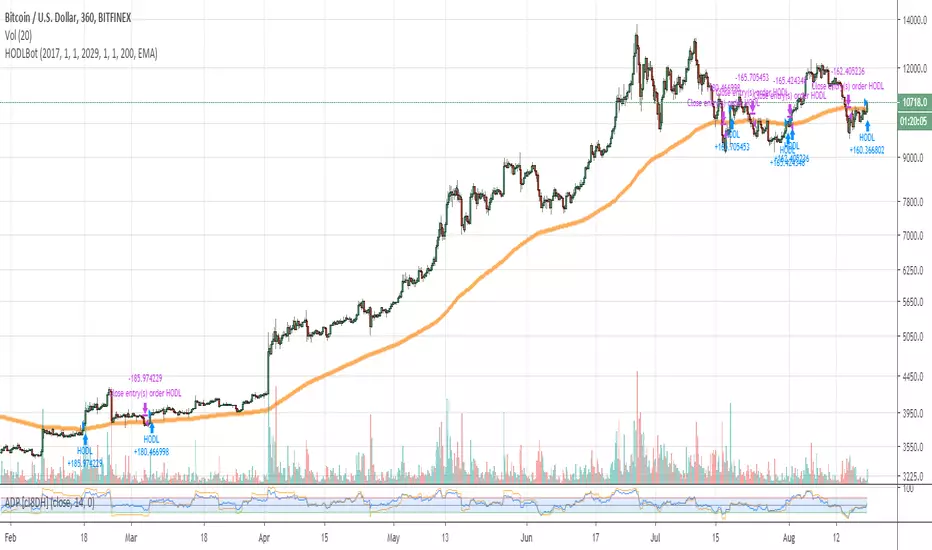
HODLBotHODLBot is a very simple script that HODLs BTC when price > 200 EMA on 6hr timeframe, and sells (closes long) when price < 200 EMA.
Designed to be used with just coins / not leveraged trading, to allow restful sleep knowing that you're not participating in brutal drawdowns like 2018 ^_^