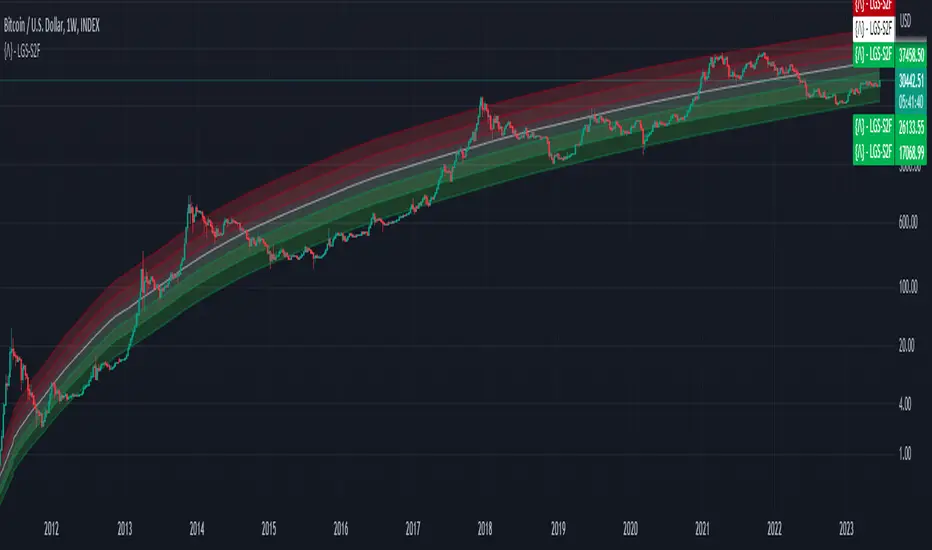
Bitcoin Limited Growth ModelThe Bitcoin Limeted Growth is a model proposed by QuantMario that offers an alternative approach to estimating Bitcoin's price based on the Stock-to-Flow (S2F) ratio. This model takes into account the limitations of the traditional S2F model and introduces refinements to enhance its analysis.
The S2F model is commonly used to analyze Bitcoin's price by considering the scarcity of the asset, measured by the stock (existing supply) relative to the flow (new supply). However, the LGS-S2F Bitcoin Price Formula recognizes the need for improvements and presents an updated perspective on Bitcoin's price dynamics.
Invalidation of the Normal S2F Model:
The normal S2F model has faced criticisms and challenges. One of the limitations is its assumption of a linear relationship between the S2F ratio and Bitcoin's price, overlooking potential nonlinearities and other market dynamics. Additionally, the normal S2F model does not account for external influences, such as market sentiment, regulatory developments, and technological advancements, which can significantly impact Bitcoin's price.
Addressing the Issues:
The LGS-S2F Bitcoin Price Formula introduces refinements to address the limitations of the traditional S2F model. These refinements aim to provide a more comprehensive analysis of Bitcoin's price dynamics:
Nonlinearity: The LGS-S2F model recognizes that the relationship between the S2F ratio and Bitcoin's price may not be linear. It incorporates a logistic growth function that considers the diminishing returns of scarcity and the saturation of market demand.
Data Analysis: The LGS-S2F model employs statistical analysis and data-driven techniques to validate its predictions. It leverages historical data and econometric modeling to support its analysis of Bitcoin's price.
Utility:
The LGS-S2F Bitcoin Price Formula offers insights for traders and investors in the cryptocurrency market. By incorporating a more refined approach to analyzing Bitcoin's price, this model provides an alternative perspective. It allows market participants to consider various factors beyond the S2F ratio alone, potentially aiding in their decision-making processes.
Key Features:
Adjustable Coefficients
Sigma calculation methods: Normal or Stdev
Credit:
The LGS-S2F Bitcoin Price Formula was developed by QuantMario, who has contributed to the field of cryptocurrency analysis through their research and modeling efforts.
Bitcoinprice
USDT Inflow TrackerUSDT INFLOW TRACKER
What does this script do? It looks for important inflow from USDT and write it below or above your chart.
Does it matter? Yes because Tether with planned USDT inflow highly manipulate the crypto market.
With this simple script you can study what and when something strange is going to happen on your favourite token.
HOW IT WORKS?
Pretty simple. It just continuosly check USDT (and USDC) Market Cap and verify if the last candle is way higher than last one. If it was way higher than expected it plot a green square and write a note with the total Inflow of USDT in the crypto market (not specifcially for your token)
Now you can see when an important inflow is done and start to plan your entry and exit strategy in the crypto market.
AUTOSET
With Autoset you can rely on standard values
5min TF : Inflow greater than of 15 mln (in 1 candle)
30min TF : Inflow greater than of 150 mln (in 1 candle)
60min TF : Inflow greater than of 300 mln (in 1 candle)
1Day TF : Inflow greater than of 900 mln (in 1 candle)
So you can check your favourite coin in no time looking for a good trading position
MANUAL SETTINGS
Otherwise you can set directly your Inflow to track based on your needs.
In the example below I've set to check everytime an Inflow of 25mln USDT or greater was done.
As you can see it highly influence the relative token.

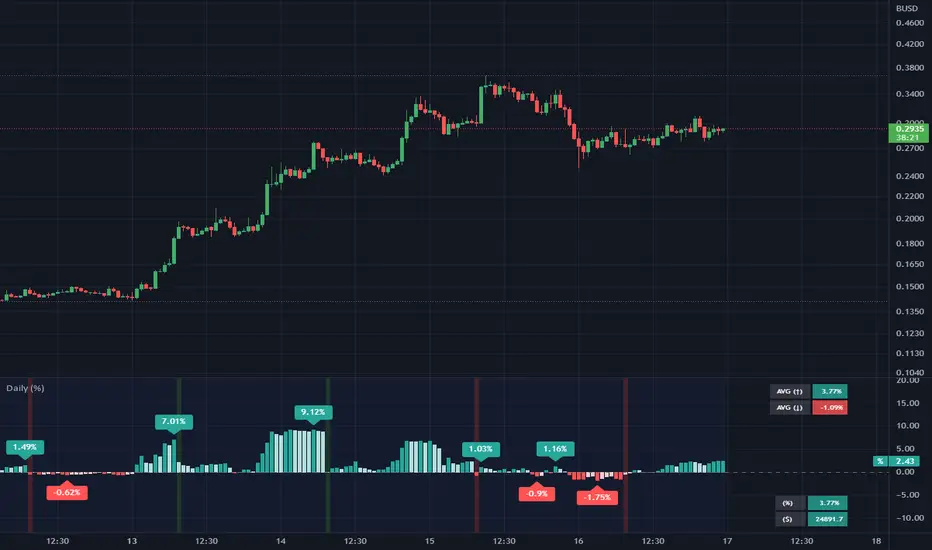
Daily (%) - Percentage Above / Below Daily [HODLER]It is a common observation in the world of cryptocurrency that the prices of most digital currencies tend to follow the price movements of Bitcoin. This means that when the price of Bitcoin increases, the prices of other cryptocurrencies usually increase as well, and when the price of Bitcoin decreases, the prices of other cryptocurrencies also tend to decrease, particularly when Bitcoin is near its daily level.
Of course, this is not unique to Bitcoin but also occurs with stocks. You can use this indicator on any asset you choose. Simply select the asset you want to track in the indicator's settings.
In the example chart, you can see CFXBUSD on a 45-minute timeframe chart with the indicator displayed below that tracks Bitcoin on a daily timeframe, as bitcoin was set as the asset in the settings of the indicator. In the lower right corner of the indicator, it will display the price of the asset "Bitcoin" and the percentage by which it is either above or below the daily price (which is calculated in the same way as on the TradingView watchlist).
This indicator can be very useful when trading other assets to closely monitor Bitcoin's (or any other chosen) activity. You can use it to check if the price is above the daily close and if it closed higher or lower than the last bar. Additionally, you can check if it closed above certain moving averages.
A useful feature of this indicator is that you can set an offset percentage for your visuals to adjust for whether the asset is up or down.
However, it is important to note that not all cryptocurrencies are directly correlated with Bitcoin's price movements, and some may even have unique factors that can cause them to behave differently in the market.
If you have any questions or suggestions regarding this indicator, I would greatly appreciate it if you could let me know in the comments.
MVRV Z Score and MVRV Free Float Z-ScoreIMPORTANT: This script needs as much historic data as possible. Please run it on INDEX:BTCUSD , BNC:BLX or another chart of sufficient length.
MVRV
The MVRV (Market Value to Realised Value Ratio) simply divides bitcoins market cap by bitcoins realized market cap. This was previously impossible on Tradingview but has now been made possible thanks to Coinmetrics providing us with the realized market cap data.
In the free float version, the free float market cap is used instead of the regular market cap.
Z-Score
The MVRV Z-score divides the difference between Market cap and realized market cap by the historic standard deviation of the market cap.
Historically, this has been insanely accurate at detecting bitcoin tops and bottoms:
A Z-Score above 7 means bitcoin is vastly overpriced and at a local top.
A Z-Score below 0.1 means bitcoin is underpriced and at a local bottom.
In the free float version, the free float market cap is used instead of the regular market cap.
The Z-Score, also known as the standard score is hugely popular in a wide range of mathematical and statistical fields and is usually used to measure the number of standard deviations by which the value of a raw score is above or below the mean value of what is being observed or measured.
Credits
MVRV Z Score initially created by aweandwonder
MVRV initially created by Murad Mahmudov and David Puell

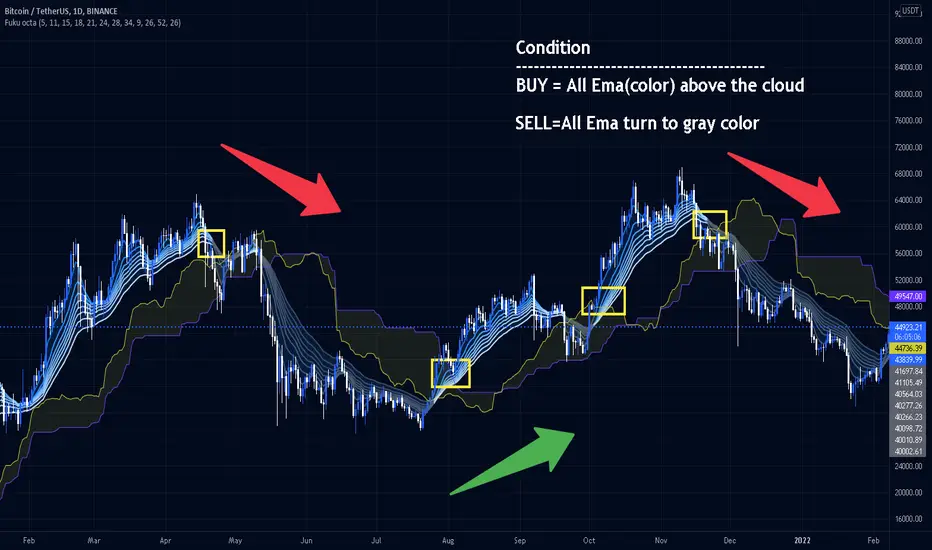
Fukuiz Octa-EMA + IchimokuThis indicator base on EMA of 8 different period and Ichimoku Cloud.
#A brief introduction to Ichimoku #
The Ichimoku Cloud is a collection of technical indicators that show support and resistance levels, as well as momentum and trend direction. It does this by taking multiple averages and plotting them on a chart. It also uses these figures to compute a “cloud” that attempts to forecast where the price may find support or resistance in the future.
#A brief introduction to EMA#
An exponential moving average (EMA) is a type of moving average (MA) that places a greater weight and significance on the most recent data points. The exponential moving average is also referred to as the exponentially weighted moving average. An exponentially weighted moving average reacts more significantly to recent price changes than a simple moving average (SMA), which applies an equal weight to all observations in the period.
I combine this together to help you reduce the false signals in Ichimoku.
#How to use#
EMA (Color) = Bullish trend
EMA (Gray) = Bearish trend
#Buy condition#
Buy = All Ema(color) above the cloud.
#Sell condition#
SELL= All Ema turn to gray color.
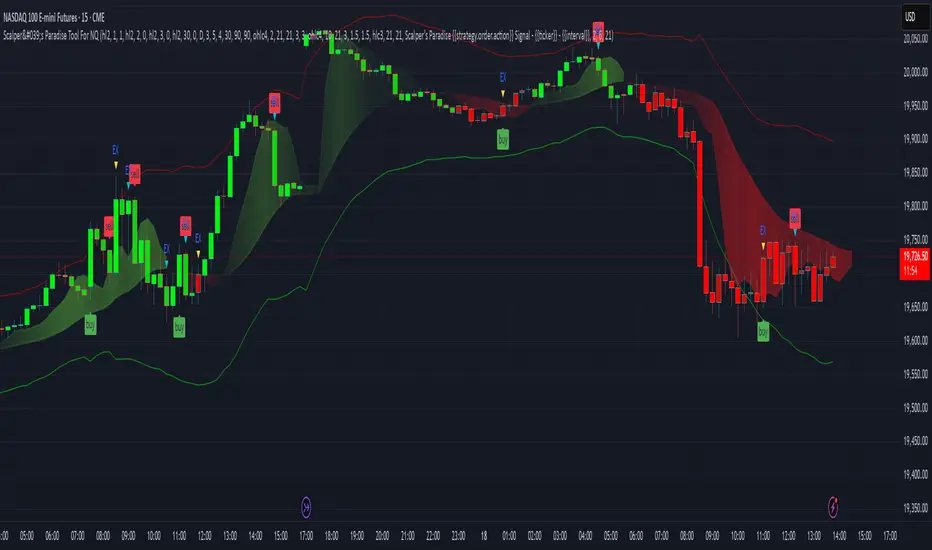
Scalper's Paradise Tool For NQThis powerful scalping tool was specifically designed for NQ and MNQ. Scalper's Paradise adds buy and sell signals to the chart using a proprietary blend of confluence trading principals that are incredibly accurate. Many of the settings can be customized for uses on higher time-frames and different markets. Along with the buy and sell signals, this indicator offers weakness signaling (seen as dots on the chart), along with potential exit points marked as 'EX' on the chart over a diamond shape.
How To Use:
This indicator is designed for intra-day scalping. When a buy or sell signal is marked on the chart, it's safe to enter a position. Exit the position when you see weakness in the trend or where the EX (exits) are marked.
The Trend Cloud offers great visibility for trend strength and overall volatility and can be used in conjunction with the entries and exits for added confidence that your trade is a worthwhile trade.
The red and green backgrounds on the chart are a filtering tool designed to save you from trades that otherwise don't carry enough momentum to be worth entering the market. This part of the indicator has 3 major adjustable settings that allow you to truly dial in your risk.
Identify momentum areas and trade with confidence using Scalper's Paradise!
Trend Cloud for momentum and confidence
Buy and Sell Signals
Marked Exits and Trend Weakness dots on the chart
ADX Based Clean Trade Filter allows for full customization of your trading risk profile. This part of the indicator will SUPPRESS any and all signals while the chart's background is red.
The Safer Trades Filtering in the settings allows further confidence by suppressing riskier trade signals
Limitations:
This script does not mark reversals. It will only identify safe trade zones during periods of strong momentum.
Disclaimer:
The information contained in my scripts/indicators/ideas does not constitute financial advice or a solicitation to buy or sell any securities of any type. I will not accept liability for any loss or damage, including without limitation any loss of profit, which may arise directly or indirectly from the use of or reliance on such information.
All investments involve risk, and the past performance of a security, industry, sector, market, financial product, trading strategy, or individual’s trading does not guarantee future results or returns. Investors are fully responsible for any investment decisions they make. Such decisions should be based solely on an evaluation of their financial circumstances, investment objectives, risk tolerance, and liquidity needs.
My scripts/indicators/strategies/ideas are only for educational purposes!
BTC Multi Exchange Perpetual PremiumThis script tracks the premium/discount of Bitcoin perpetual contracts at various exchanges.
The premium/discount is calculated against an index price. The index price is calculated from spot exchange prices and are weighted as follows:
Bitstamp:28,81%
Bittrex:5,5%
Coinbase: 38,07%
Gemini: 7,34%
Kraken: 20,28
The difference between this script and other available scripts, is that exciting script seems to only focus on one exchange. This script is also open source.

Bitcoin Comparison to GBTC!This script tells you if GBTC is overvalued or undervalued compared to Bitcoin.

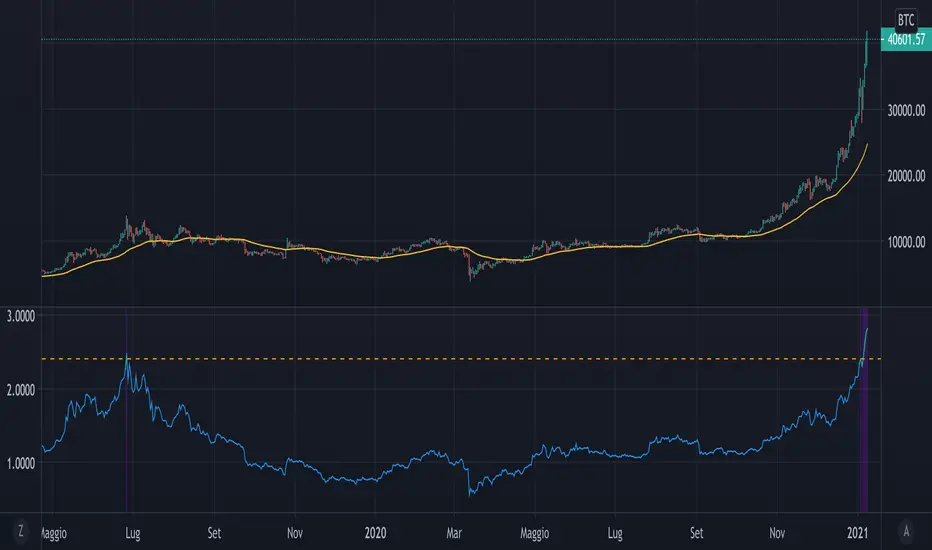
Mayer MultipleThe script implements a custom version of the Mayer multiple and it may be useful for analyzing the price of Bitcoin in a historical context.
Note n.1: Mayer multiple does not tell whether to buy, sell or hold, but highlights the best long-term area when the bitcoin price is below a threshold value (2.4).
Note n.2: the threshold value (2.4) has been determined in the past by simulations performed.
The script user may decide whether to use the shown graph or another graph for the calculation of the Mayer multiple.
The script is very easy to use and it is possible to change the following parameters:
the period of SMA (default value is 200)
the threshold (default value 2.4)
Show or not the sell area
Use or not the shown graph to calculate the Mayer multiple (default value is true)
name of exchange to use for calculation of the Mayer multiple (default value is BNC)
name of chart to use for calculation of the Mayer multiple (default value is BLX)
MAFIA CANDLESMafia Candles is a Exhaustion bar count and candle count indicator, Using the Leledc Candles and 1-3 counting candle play gives you a pretty good idea where a so called "top" will be or a so called "bottom" will be!
In this example, getting the transparent round circles ( either lime or red ) would mean that the move will be a good size move!
EXAMPLE=1 You see a down trend and then the Mafia Candles Flashes a Green Dot on the forming new red candle. This is where in theory you might want to consider going long on the market!
EXAMPLE=2 If you see a RED $ symbol, after a uptrend, this means in theory, there might be room for a short play or room for a small pullback in the price!
THE CIRCLES(RED OR LIME COLORED) ARE INDICATING BIGGER MOVES!
THE $ SYMBOLS (RED OR LIME COLORED) ARE INDICATING SMALLER PULLBACKS OR SMALLER PUMPS IN PRICE!
RED IS CONSIDERED TO BE A SELL!
LIME COLOR IS CONSIDERED TO BE A BUY!
AS MUCH IS BASED OF THE 1-3 CANDLE COUNT AND THE LEDLEC CANDLE DEVIATION STRATEGY, LET ME EXPLAIN THE THEORY ON BOTH THE 1-3 CANDLE COUNT AND THE LELEDC STRATEGY I COMBINE TO BRING YOU THIS ADDITION OF THE INDICATOR....
LELEDC THEORY USAGE...
An Exhaustion Bar is a bar which signals
the exhaustion of the trend in the current direction. In other words an
exhaustion bar is “A bar of last seller” in case of a downtrend and “A bar of
last buyer”in case of an uptrend.
Having said that when a party cannot take the price further in their direction,naturally the other party comes in , takes charge and reverses the direction of the trend.
TO EASIER UNDERSTAND I GIVE YOU A EASY EXAMPLE OF WHAT AN LELEDC EXHAUSTION BAR IS...
1. A wide range bar ( a bar with
long body!!!).
2. A long wick at the bottom of
the bar and no or negligible wick at the top of the bar in case of “Bear exhaustion bar” and
a long wick at the top and no or
negligible wick at the bottom of the bar in case of
“Bull exhuation bar”!!!
3. Extreme volume and.....
4. Bar forming at a key support or resistance
area including a Round Number (RN) and Big Round Number ( BRN ).THE PSYCHOLOGY BEHIND THIS!!!
Now let's assume that we have a group
of people,say 100 people who decides to go for a casual running. After running for few KM's few of
them will say “I am exhausted. I cannot run further”. They will quit running.
After running further, another bunch of runners will say “I am exhausted. I can’t run
further” and they also will quit running.
This goes on and on and then there will be a stage where only few will be left in the running. Now a stage will come where the last person left in the running will say “I
am exhausted” and he stops running. That means no one is left now in the
running.This means all are exhausted in the running.
The same way an exhaustion bar works and if we can figure out that
exhaustion bar with all the tools available on hand, we will be in a big trade
for sure!!.The reason is an exhaustion bar is formed at exact tops and bottoms most of the times.In forex with wide variety of pairs available at the counter ,one can trade this technique to make lifetime gains.
NOW LET ME EXPLAIN THE 1-3 CANDLE CORRECTION COUNT THEORY WHICH IS USED TO GET THE SUM UP SIGNALS FROM THIS INDICATOR FROM ITS INPUT LEVELS!!!
1-3 CANDLES....
The 1-3 Candlestick pattern is basically like sequential, aka a candle counting system!
1-3 CANDLE COUNT means you count the number of bullish=green candles or the bearish=red candles!
3 BULL/GREEN CANDLES in a row, each closing its close higher than the previous one before it is the 1-3 candle top count idea!
lets say you get 3 red bear candles, each candle after the first closes its body below the previous red candle before it, then you see 3 red candles with each closing lower bodies lower than the previous candle, THATS A POSSIBLE SIGN OF BEARISH EXHAUSTION, AND YOU MIGHT HAVE SOME BULLS STEP IN TO TAKE THE PRICE UP AFTER THE IMMEDIATE DOWNFALL OF THOSE 3 RED CANDLES!!
PLEASE IF ANYONE HAS QUESTIONS OR NEEDS ANY FURTHER EXPLANATION, DONT HESISITATE TO MESSAGE ME! CHALRES KNIGHT IS THE ORIGINAL AUTHOR OF THE 1-3 CANDLE COUNT AND THE LELEDC EXHAUSTION BAR INDICATOR ON METE-TRADER! R.IP CHARLES F KNIGHT!!! WE LOVE YOU AND MISS YOU BROTHER!
CHARLES KNIGHT PASSED DOWN ALL OF HIS INDICATORS AND SCRIPTS IN ORIGINAL CODE TO MYSELF WHEN HE PASSED AWAY AND I WILL CONTINUE TO HONOR HIS MEMORY BY ENHANCING HIS ORIGINAL SOURCE CODED SCRIPTS TO ENHANCE THE LIFE FOR ALL TRADERS!
CHARLIE LOVED WHEN I WOULD PUT MY OWN SWING ON HIS INDICATORS! HE TAUGHT ME EVERYTHING I KNOW AND I KNOW ONE DAY I WILL SEE HIM AGAIN!
TRADE IN PARADISE CHARLIE!!!
THE BEST TRADER IN THE WORLD!!!

BTC Fibonacci DMA350 TrendlinesAdapted from Tim Graham's Code.
See Original Inspiring Article from Phillip Swift at: @positivecrypto
When looking into BITSTAMP:BTCUSD 1D data in spreadsheet. Historically, BTC Highs Hit (Simple Daily Moving Average 350 Days) DMA350 in reverse Fibonacci Sequence Order
2013 Hit DMA350*8 before All Time High (ATH)
2017 Hit DMA350*5 before ATH
I expect 2021 to hit DMA350*3 ATH. When BTC hits DMA350*3 ATH, I suggest selling!

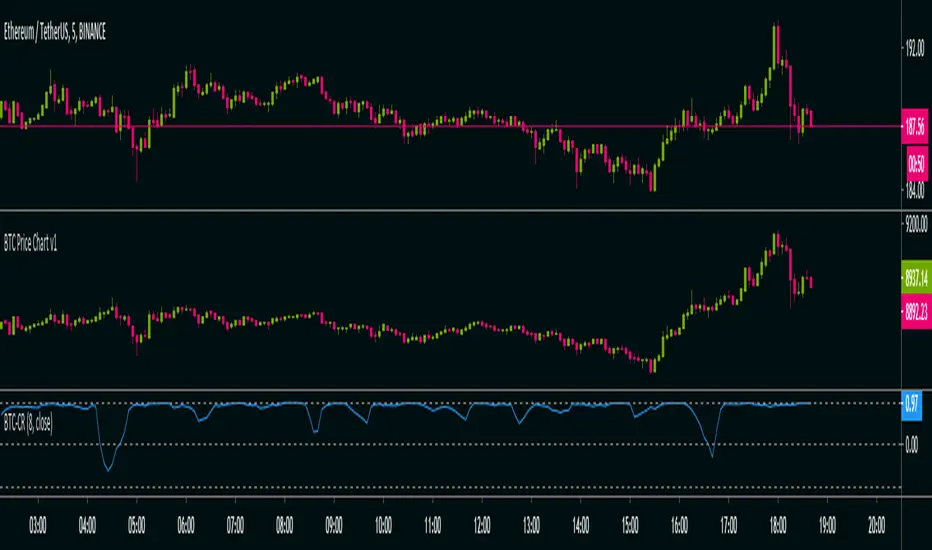
BTC Co-Relation v1Calculate Pearson-correlation-coefficient of selected cryptocurrency with Bitcoin average price of 10 different exchanges.
This is helpful in scalping(at least for me), by using this we can find co-relation between a cryptocurrency and Bitcoin .
Here we are using Bitcoin average price of 10 different exchanges.
It is an oscillator with minimum value -1 and maximum value +1.
👉-1 means current selected cryptocurrency price is completely out of relation with Bitcoin price, means Bitcoin price increasing and it's price decreasing or Bitcoin price decreasing and it's price increasing in selected time-frame.
👉+1 means current selected cryptocurrency price is completely in co-relation with Bitcoin price, means Bitcoin price increasing and it's price also increasing or Bitcoin price decreasing and it's price also decreasing in selected time-frame.
Happy trading 👍.
Cracking Cryptocurrency - Bottom FeederThe Bottom Feeder
The Bottom Feeder is designed to algorithmically detect significantly oversold conditions in price that represent profitable buying opportunities. Combining this with it’s unique Stop and Target System, the Bottom Feeder is designed to return consistent return with minimal draw down. Whether used as a Market Bottom Detector or as a system for executing safe, profitable mean reversion trades, the Bottom Feeder is a powerful tool in any trader’s arsenal.
Bottom Feeder was designed to be used on BTCUSD , however it is also effective on other USD/USDT pairs. One will have to check the individual pair they wish to trade with the Strategy Tester to simulate performance.
Options
Let’s go through the input options one by one, so that you are able to comfortably navigate all that this indicator has to offer. The link below will display a picture of the layout of the settings for your convenience.
For the sake of simplicity, let’s note now that all settings marked **Conservative Mode** will not work in Aggressive Mode.
Mode: Determines how aggressively Bottom Feeder generates a buy signal. In Conservative Mode, trades can only be opened once per candle and the stop and target will update as new signals appear. In Aggressive Mode, a separate trade is opened each time Bottom Feeder signals, which may be multiple times within one Daily candle.
Plot Target and Stop Loss: Toggles on/off the visualized take profit and stop losses on the chart.
**Conservative Mode** TP Multiplier: This is an input box, it requires a float value. That is, it can accept either a whole number integer or a number with a decimal. This number will determine your Take Profit target. It will take whatever number is entered into this box and multiply the Average True Range against it to determine your Take Profit.
**Conservative Mode** SL Multiplier: See above - this will modify your Stop Loss Value.
**Conservative Mode** Average or Median True Range: This is a drop-down option, the two options are Average True Range or Median True Range. If Average True Range is selected, then this indicator will use the Average True Range calculation, that is, the average of a historical set of True Range values to determine the Average True Range value for Target and Stop Loss calculation. If Median True Range is selected, it will not take an average and will instead take the Median value of your historical look back period.
**Conservative Mode** True Range Length: This is an input that requires an integer. This will represent your historical look back period for Average/Median True Range calculation.
**Conservative Mode** True Range Smoothing: This is a drop-down with the following options: Exponential Moving Average ( EMA ), Simple Moving Average ( SMA ), Weighted Moving Average ( WMA ), Relative Moving Average (RMA). This will determine the smoothing type for calculating the Average True Range if it is selected. Note: if Median True Range is selected above, this option will not have any effect as there is no smoothing for a Median value.
**Conservative Mode** Custom True Range Value?: This is a true/false option that is false by default. If enabled, it will override the Average/Median True Range calculation in favor of a users custom True Range value to be input below.
**Conservative Mode** Custom True Range Value: This is an input box that requires a float value. If Custom True Range is enabled this is where a user will input their desired custom True Range value for Target and Stop Loss calculation.
Stop and Target Description
Because Bottom Feeder is designed only to scalp the various market bottoms that can appear over time in the market and not to identify trends or to trade ranges, it’s imperative that the indicator notify us not just to when to enter our trades, but when to exit! In the service of that, CC Bottom Feeder has a built in Stop and Target system that tracks and displays the stop loss and take profit levels of each individual open trade, whether in Aggressive or Conservative Mode.
Conservative Mode Targeting: In Conservative Mode, Bottom Feeder signals are aggregated into a compound trade. The signal will appear as a green label pointing up below a candle, and will appear upon a candle close. If Bottom Feeder then generates another signal the stop loss and target price will be updated. The process will continue until the aggregated trade completes in either direction. On a trade with multiple signals, a larger position is slowly entered into upon each buy signal.
Aggressive Mode Targeting: In Aggressive Mode, Bottom Feeder signals are individually displayed as they are generated, regardless of how many signals are generated on any single candle. If Bottom Feeder continues to signal, each individual open trade will have their own stop loss and target that will be displayed on the chart until the individual trade completes in either direction. As opposed to a large compound position, aggressive mode represents a higher number of independent signals with their own stop and target levels.
Stop losses and targets are designed to be hard, not soft. That is, they are intended to be stop market orders, not mental stop losses. If price wicks through the target or stop, it will activate.

Cracking Cryptocurrency - Bottom Feeder Strategy TesterBottom Feeder - Strategy Tester
The Bottom Feeder is designed to algorithmically detect significantly oversold conditions in price that represent profitable buying opportunities. Combining this with it’s unique Stop and Target System, the Bottom Feeder is designed to return consistent return with minimal draw down. Whether used as a Market Bottom Detector or as a system for executing safe, profitable mean reversion trades, the Bottom Feeder is a powerful tool in any trader’s arsenal.
Bottom Feeder was designed to be used on BTCUSD, however it is also effective on other USD/USDT pairs. One will have to check the individual pair they wish to trade with the Strategy Tester to simulate performance.
Strategy displayed is from 2018-2021 on **Conservative Mode** with Percent of Equity (30%) enabled.
Options
Let’s go through the input options one by one, so that you are able to comfortably navigate all that this indicator has to offer. The link below will display a picture of the layout of the settings for your convenience.
For the sake of simplicity, let’s note now that all settings marked **Conservative Mode** will not work in Aggressive Mode.
Mode : Determines how aggressively Bottom Feeder generates a buy signal. In Conservative Mode, trades can only be opened once per candle and the stop and target will update as new signals appear. In Aggressive Mode, a separate trade is opened each time Bottom Feeder signals, which may be multiple times within one Daily candle.
Position Sizing Strategy : Determines what Risk Management system you will deploy when trading Bottom Feeder. Your options are “Percent of Equity” and “Distance to Stop Loss”. If Percent of Equity is selected, a trade size will be equal to a percentage of your equity, pursuant to the value in the ‘Percent of Equity’ box. If Distance to Stop Loss is selected, then your Position Size will be determined based off the distance to your stop loss and the value in the ‘Risk Percentage’ box.
Percent Of Equity : Determines what percentage of your equity will be allocated to each trade when ‘Position Sizing Strategy’ is enabled.
Risk Percentage : Determines the size of each trade if ‘Distance to Stop Loss’ strategy is enabled. This value reflects what percent of your account you will lose per trade if the trade hits your stop loss.
Plot Target and Stop Loss : Toggles on/off the visualized take profit and stop losses on the chart.
**Conservative Mode** TP Multiplier : This is an input box, it requires a float value. That is, it can accept either a whole number integer or a number with a decimal. This number will determine your Take Profit target. It will take whatever number is entered into this box and multiply the Average True Range against it to determine your Take Profit.
**Conservative Mode** SL Multiplier : See above - this will modify your Stop Loss Value.
**Conservative Mode** Average or Median True Range : This is a drop-down option, the two options are Average True Range or Median True Range. If Average True Range is selected, then this indicator will use the Average True Range calculation, that is, the average of a historical set of True Range values to determine the Average True Range value for Target and Stop Loss calculation. If Median True Range is selected, it will not take an average and will instead take the Median value of your historical look back period.
**Conservative Mode** True Range Length : This is an input that requires an integer. This will represent your historical lookback period for Average/Median True Range calculation.
**Conservative Mode** True Range Smoothing : This is a drop-down with the following options: Exponential Moving Average ( EMA ), Simple Moving Average ( SMA ), Weighted Moving Average ( WMA ), Relative Moving Average (RMA). This will determine the smoothing type for calculating the Average True Range if it is selected. Note: if Median True Range is selected above, this option will not have any effect as there is no smoothing for a Median value.
**Conservative Mode** Custom True Range Value? : This is a true/false option that is false by default. If enabled, it will override the Average/Median True Range calculation in favor of a users custom True Range value to be input below.
**Conservative Mode** Custom True Range Value : This is an input box that requires a float value. If Custom True Range is enabled this is where a user will input their desired custom True Range value for Target and Stop Loss calculation.
From Month/Day/Year to Month/Day/Year : This sets the Time Frame of your backtest for the Bottom Feeder Strategy. It will run FROM the date selected TO the date selected.
Stop and Target Description
Because Bottom Feeder is designed only to scalp the various market bottoms that can appear over time in the market and not to identify trends or to trade ranges, it’s imperative that the indicator notify us not just to when to enter our trades, but when to exit! In the service of that, CC Bottom Feeder has a built in Stop and Target system that tracks and displays the stop loss and take profit levels of each individual open trade, whether in Aggressive or Conservative Mode.
Conservative Mode Targeting: In Conservative Mode, Bottom Feeder signals are aggregated into a compound trade. The signal will appear as a green label pointing up below a candle, and will appear upon a candle close. If Bottom Feeder then generates another signal the stop loss and target price will be updated. The process will continue until the aggregated trade completes in either direction. On a trade with multiple signals, a larger position is slowly entered into upon each buy signal.
Aggressive Mode Targeting: In Aggressive Mode, Bottom Feeder signals are individually displayed as they are generated, regardless of how many signals are generated on any single candle. If Bottom Feeder continues to signal, each individual open trade will have their own stop loss and target that will be displayed on the chart until the individual trade completes in either direction. As opposed to a large compound position, aggressive mode represents a higher number of independent signals with their own stop and target levels.
Stop losses and targets are designed to be hard, not soft. That is, they are intended to be stop market orders, not mental stop losses. If price wicks through the target or stop, it will activate.

Bitcoin Risk Indicator v2Based on the work of Ben Cowen on Youtube. I can't link to the video due to TradingView promotion rules.

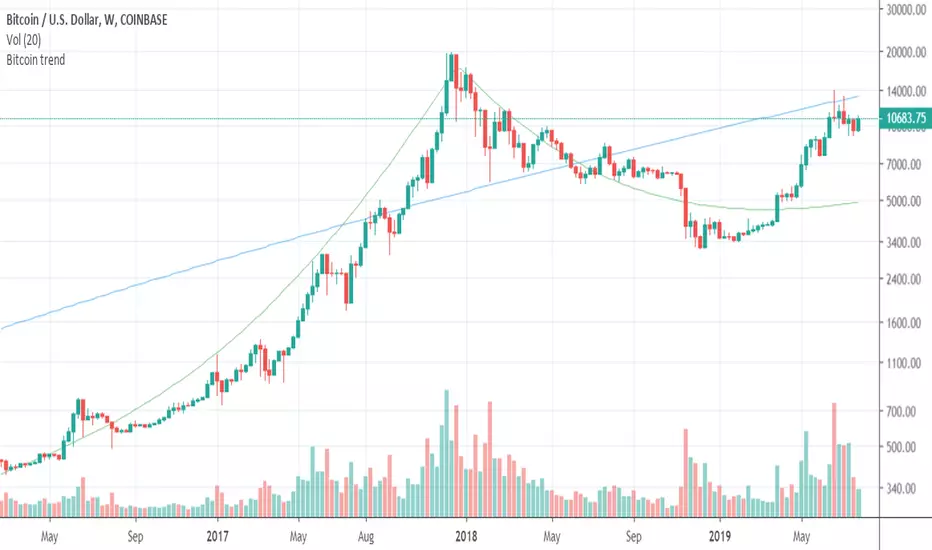
Bitcoin long term trendsThis script shows the long term trends in Bitcoin price.
It is based on my mathematical formula for the long term trends.
The blue line is a long term trend as a power function B = (t/693)^5.526
And the green line is a more sophisticated trend, which models the wave behavior over the whole history of bitcoin.
This script is only applicable to BTCUSD price. The trend lines are calculated as the functions of time only.
BITFINEX:BTCUSD
Bitcoin Price User Correlation [aamonkey]You can only use this for BTC.
Bitcoin over time tends to be priced at 7000 times the number of users (in terms of market cap).
Calculation:
Number of Wallets*7000/(Circulating Supply or 21,000,000)
Settings:
You can decide whether you want to use the Circulating Supply or 21,000,000 as a reference.
The default settings are using 21,000,000 because it seems to be more accurate.
You can easily switch between both versions by checking the box in the settings.
Interesting Findings:
Using circulating supply:
- Most of the time we are under the estimated ("PUC") line
- Once we break above the PUC line we are in the parabolic phase of the Bullrun
- In history, we broke only 4 times above the PUC
- Once we are above the PUC we see crazy growth (parabolic phase)
- We don't spend much time above the PUC
- From breaking the PUC to the new All-Time High of the cycle we took in order: 3 Days, 7 Days, 22 Days, 30 Days
- So the trend is increasing (We are taking more and more time until we see the ATH)
- Currently, we are about to break the PUC
- Then I expect the parabolic phase to begin
- I expect the run to last about 30 days

Creating long term bitcoin data
One of the problems, with bitcoin, is that we miss long term bitcoin data. There is not a single source from which to gather the value of bitcoin in any moment from it's inception. Or at least from when it was first exchanged into exchanges. If you look at coinmarketcap the data go back to the 28 apr 2013. But mtgox started in July 2010. If you go to yahoo, you will be able to gather data, but once you start working with this data you soon find out how poor is it. Basically it follows mtgox data while mtgox was alive, and then switched to some other exchange. But this means that we see a sudden jump in data which makes any indicator go wild. Basically it's really difficult to gather long term data on bitcoin. Also consider that mtgox did not just "go away" when it stopped trading. But in the database here it is still present with the fixed exchange rate of when it stopped.
So I tried to create the data we need. How? By taking three exchanges, and taking the median between them. The three exchanges I took were MTGOX: , BITFINEX: and KRAKEN: XBTUSD . We cannot avoid mtgox because it's the only source of data for the first years. But then as soon as the other exchanges come in we are going to use the median between them.
The indicator must be overlaid on another chart. And I use the forex usdeur which I then hide (If someone has a better idea, maybe something which is open 24/7, I would be happy to hear it).

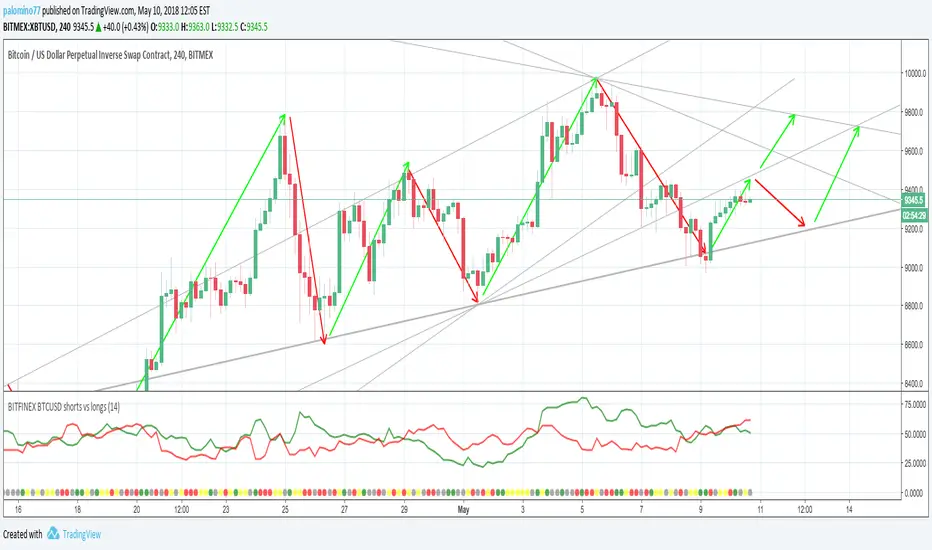
BITFINEX BTCUSD shorts vs longsA simple script to get an RSI of BTCUSD SHORTS and LONGS on Bitfinex.
(Forked from an open sourced script)
BTC Mass profit alarmThis is a modified version of my "BTC Mass profit" strategy so that you can add alerts when a signal is produced
