BTC longs n' shortsA indicator that neatly shows you BitFinex margin longs and shorts that can be put on any chart!
Bitfinex

ShortSqueeze StochasticOscillatorHey!
I made a StochasticOscillator with BITFINEX:BTCUSDLONG & BITFINEX:BTCUSDSHOTS
Hope you enjoy it, and remember it's not about the asset's price, but about the asset's interest with these finantial tools.

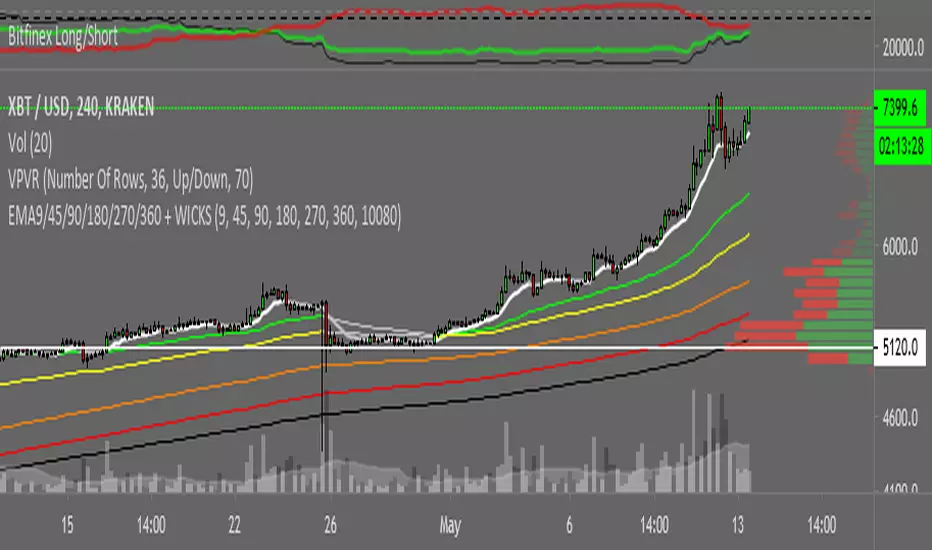
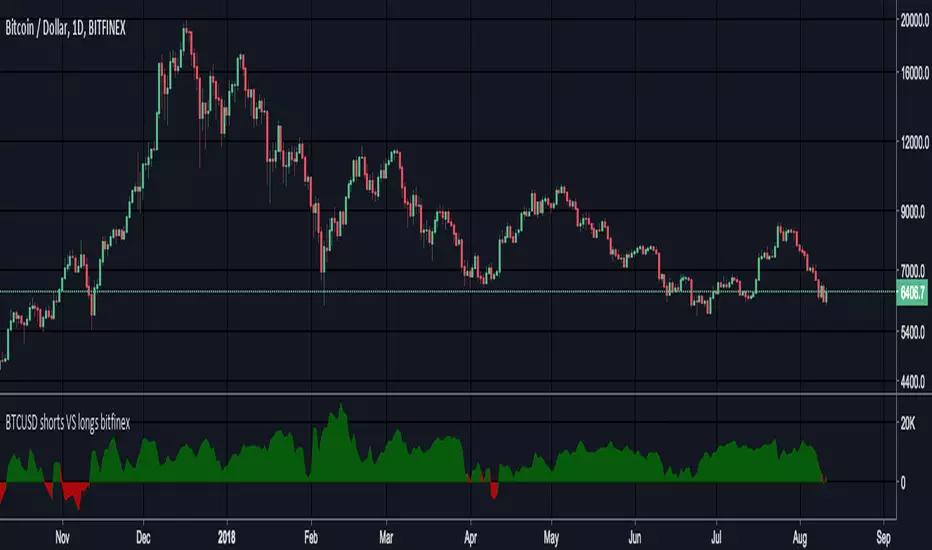
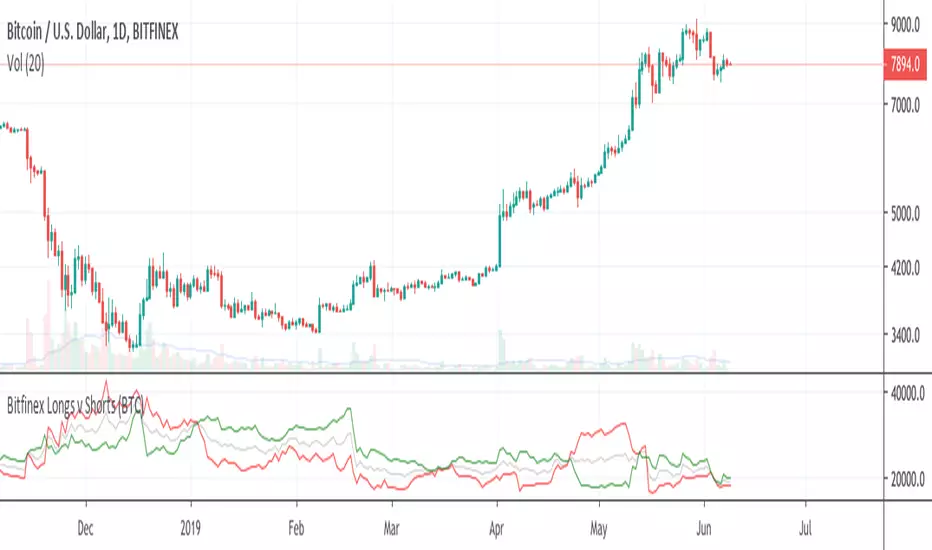
Bitfinex BTC longs vs Short & RatioSince the last BTC Short Squeeze on Bitmex maintenance I decided to made a Indicator plotting Long:Short ratio, and their respective graphs.
Green = Longs
Red = Shorts
Black = Ratio (Longs:Shorts)*Close <= Close price just for chart normalization!
I hope you find it useful.
NOTE: It isn't a prospective indicator, but try to find out who's bitching the market and when ;p
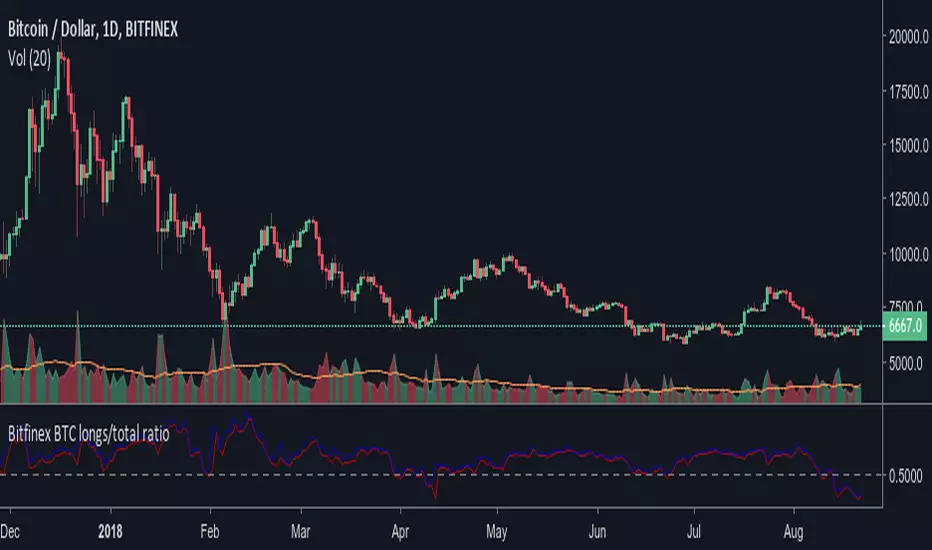
Bitfinex BTC longs/total ratioRatio of bitfinex longs versus the total btc in positions. Maybe a good indicator of market sentiment. It allows you to see too where were people taking profit or closing positions. Remember that ratio going up doesn't necesarily mean more longs positions are being added. It could mean shorts are closing position massively. The conversely is also true.
The rate above 0.5 doesn't necesarily bullish, though, and the indicator is "timeframe" agnostic. So take into account that there could be tons of longs positions that were opened since back before summer 2017, It seems to be too of positions opened at prices below 4.000$. That's why the average seems to be around 0.6.
The blue lines indicates current ratio (or on close for past bars). The red line is the max ratio (higher shorts versus lowest longs).
Bitfinex Leveraged Positions Over Time [NB]This presents an EMA of:
Green: (opened longs + closed shorts)
Red: (opened shorts + closed longs)
White/blue: The difference of those two
This should represent longs/shorts better than the ratio or longs/shorts by themselves because it is weighted more towards recent actions instead of pre-existing positions and includes closed positions as well.

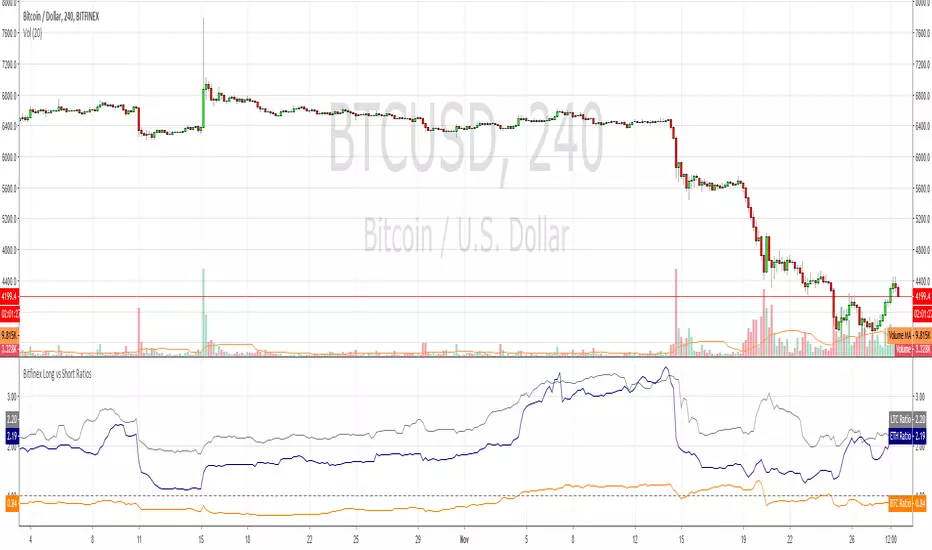
Bitfinex Long vs Short RatiosWas impressed with the 'Longs vs Shorts Ratio' idea from the tweet below so I coded an indicator, enjoy.
twitter.com
BTC Avarage Volume Indicator 2This indicator shows that volume and candle color of "BTC" pairs on one of the top 4 "BTC" exchanges.
You can easily see the volumes and candle color for "BTC" trading.
* Currently, this indicator can be used by selected people in order to complete private beta test.
* Once testing is completed, this indicator can be purchased.
* If you'd like to use this, please "DM" me and I will provide PayPal information.
About Inputs
* Default Ticker IDs are set as "BITMEX:XBT", "BITFINEX:BTCUSD", "BITFLYER:BTCJPY" and "BINANCE:BTCUSDT".
* Ticker ID can be changed.
* Ticker Label Color can be changed.
* Scale Value Of Sum Of Other Volume can be changed. See the following Important Notice.
* Ticker Label Color can be changed depending on theme color.
* Show/Hide warning(Show=0, Hide=100) can be changed. See the following Important Notice.
* Interval (Timeframe) can be changed depending on timeframe of current chart.
Specification
* barmerge is set as barmerge.gaps_off and barmerge.lookahead_off for every calculation.
Important Notice
* Volume of some exchange is over 100x times compared to other volumes. In this case, value of column chars is manipulated since other column chars come to be invisible and warning will be displayed on the right side of last chart.
* Manipulated column charts is calculated as sum of other volumes by scale which can be changed from "Scale Value Of Sum Of Other Volume" on Inputs


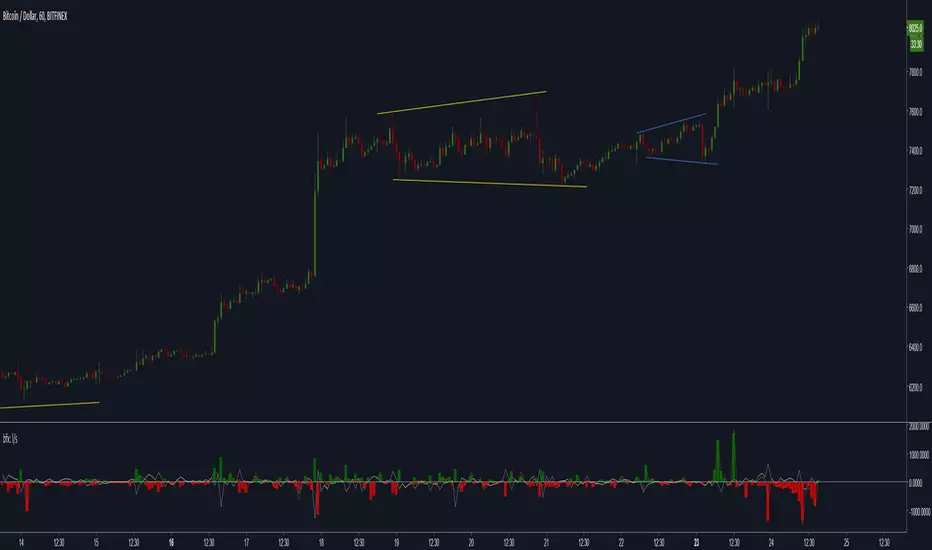
Bitfinex(bfx) Shorts, Longs, Combined Numbers (all crypto pairs)Pretty much Self-explanatory :)
The columns (green and red) are difference in long and short positions during that period. Positive number suggests more number of long positions and vice-versa.
Works for all allowed crypto-pairs.
A similar indicator was published by another user, but sadly he closed the source code
Happy Trading!
Longs Shorts & Divergence (LSD) (Ratio, Diff, Total) [cI8DH]This indicator automatically identifies the ticker for the current chart and shows margins at Bitfinex (or any other exchange if listed on Tradingview). So if your chart is reading EOSUSD at Kraken, this indicator will show EOSUSDSHORTS and EOSUSDLONGS at Bitfinex.
Features:
- Total of longs + shorts ("could" be an indicator of market attractiveness)
- Difference between longs and shorts (good if you want to have only one chart)
- Longs to total margin ratio in percentage
- Highlighting of indicator background when margins diverge too much from price (sensitivity of divergence is adjustable, divergence can be applied to longs, -shorts, longs+shorts, longs-shorts)
- Price factoring (gives a consistent metric when switching between different coins)
- Tickers can be set to a fixed value or automatically extracted from the current chart (fixed is useful for hybrid tickers)
- Margin exchange can be modified (default is Bitfinex)
- Offset for longs (helps with scaling)
Read the description in the TA below for getting access to this script.

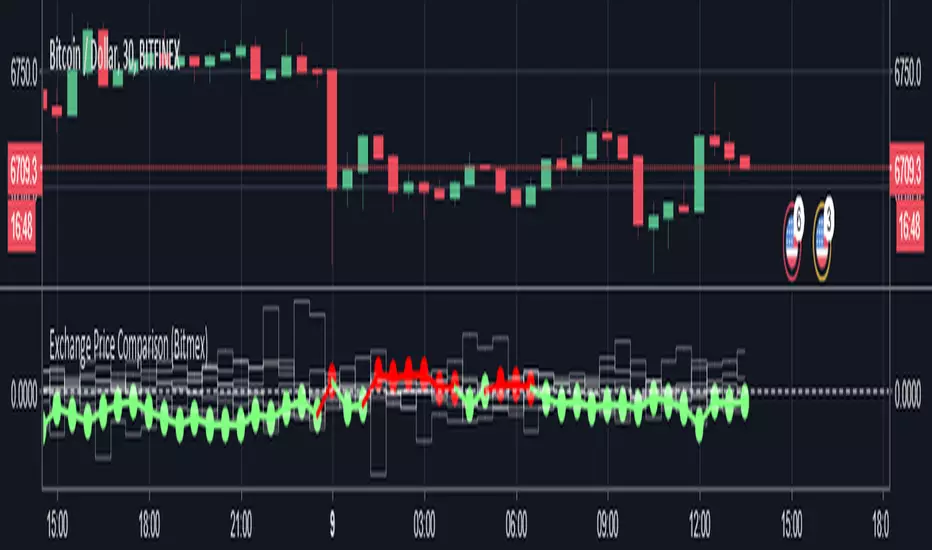
Exchange Price ComparisonCompare the BTC price at your preferred exchange against 7 other exchanges. Avoid trades at poor market value, target trades at good market value.
Average price across 8 exchanges is the 0 line, with your selected exchange displayed green if it's below the average price, red if it's above the average price. Values are displayed as distance from the average, positive or negative.
Useful for evaluating your exchange price vs average market price, to avoid poor market value trades, target good value trades, shop around exchanges for best value, potential to be adapted for arbitrage opportunities.
8 Exchanges used:
Bitfinex
Bitmex
Poloniex
Binance
Coinbase
Bitstamp
Bittrex
Kraken
Requested by Mister_Pocketlint on discord. Inspired by anise.
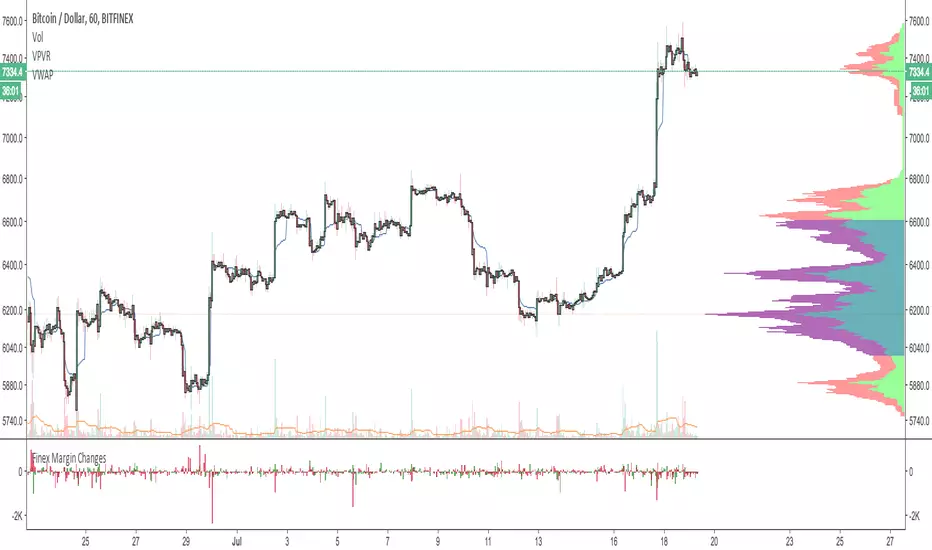
Bitfinex Open Interest ChangeThe script shows changes in Bitfinex open interest from the previous candle.
Key:
Positive green bar = Open interest increase, predominantly longs opening.
Positive red bar = Open interest increase, predominantly shorts opening.
Negative green bar = Open interest decrease, predominantly longs closing.
Negative red bar = Open interest decrease, predominantly shorts closing.
Token selection between top trading pairs is in the options.

Bitfinex Longs v Shorts - Token Selectorimgur.com
The script enables you to easily switch between the top trading pairs on Bitfinex to show the long vs. short data.
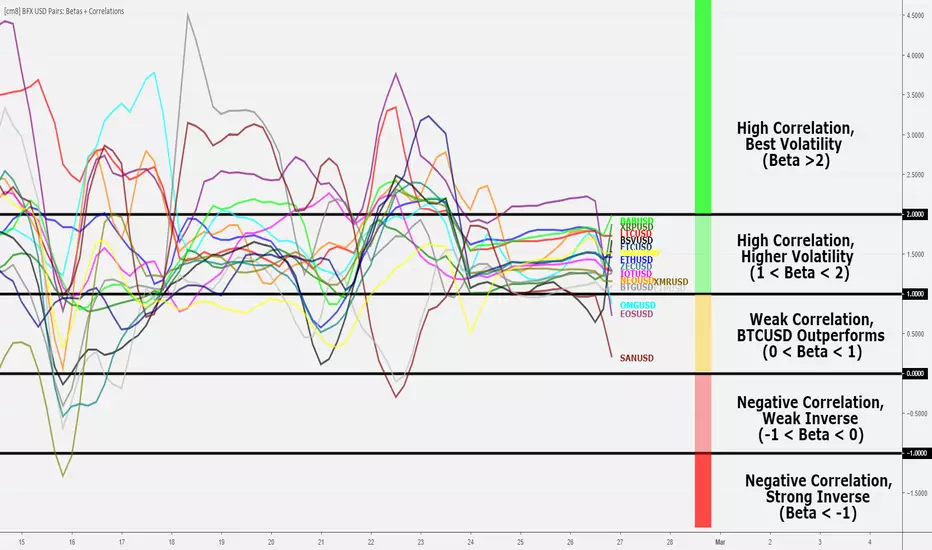
Bitfinex USD Pairs: Betas and Correlations [checkm8]Hello and welcome to my beta and correlation indicator!
This indicator is meant to be used to assess trading alternatives to BTCUSD on Bitfinex, examining alt-USD pairs that can be traded on margin. This list is as follows:
ETHUSD
LTCUSD
EOSUSD
NEOUSD
OMGUSD
XRPUSD
IOTUSD
BCHUSD
SANUSD
ETPUSD
ETCUSD
XMRUSD
ZECUSD
DSHUSD
Before dwelling further on the script, let's revisit the definitions of beta and correlation:
Beta is a statistical measure of a %-change in an asset relative to a 1% change in a benchmark. In our case - this is BTCUSD. For example, if the beta is 1.5, it means that the particular asset moves 1.5% in the same direction as the 1% change of the benchmark. If the beta is negative, the asset is moving in opposite direction of the benchmark. Note: beta is not confined to any range.
Correlation is a statistical measure of the relationship between two assets, from a range of +1 to -1, where a score of +1 implies perfect positive correlation (prices move in the same direction), -1 implies perfect negative correlation (inverse relationship), and 0 implies no relationship in price changes.
For the calculations, BITFINEX:BTCUSD is used as the benchmark.
Through the script's settings:
You can select whether to plot betas or the correlations
You can select the desired length to be used in the measure of beta and correlations
You can enable smoothing for less choppy results. This is accompanied by options to modify the smoothing length and the smoothing method, where SMA, EMA, RMA, and WMA are available.
You can enable and disable individual alt pairs from being displayed (ie. if you do not want LTCUSD plotted, you can turn it off)
Below is an example of the correlation setting.
I would recommend using a smoothing input of 3-6, on SMA, and the 4-hour timeframe for good results. I use this indicator for help in deciding what alt pairs to trade on a particular day, where you will want to trade alts with the highest correlations. Note: be weary of less liquid markets, such as ETP and SAN.
Also note: the labels shown in the snapshot are for presentation purposes only. You can enable Indicator Labels by right clicking the oscillator -> "Price Scale" -> "Indicator Labels".
Please let me know if you have any questions, suggestions, or concerns.
Happy trading!
For additional information as to why you should be using this indicator and trading alts instead of BTCUSD, please refer to my study:
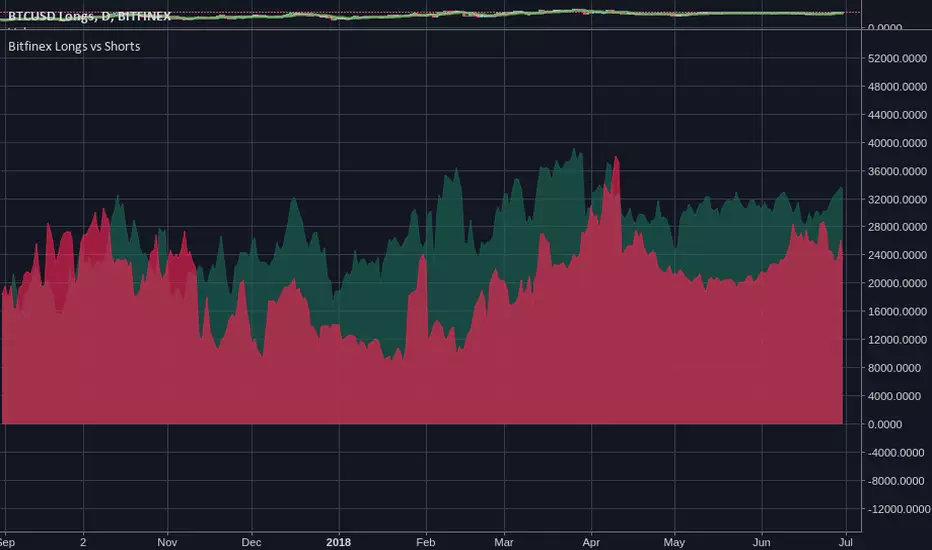
Bitfinex Longs vs Shortssexy view of the current long/short positions on Bitfinex. I saw some pay-for, hidden-source-code version of this and thought: "oh man."
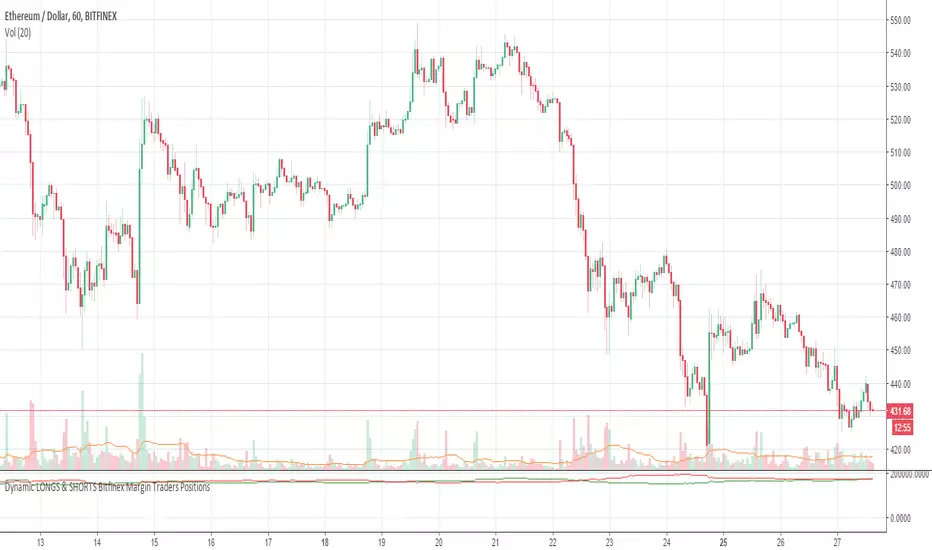
Dynamic LONGS & SHORTS Bitfinex Margin Traders PositionsA script that will show the current margin longs and shorts for the active Bitfinex pair, as long as the pair is margin enabled.