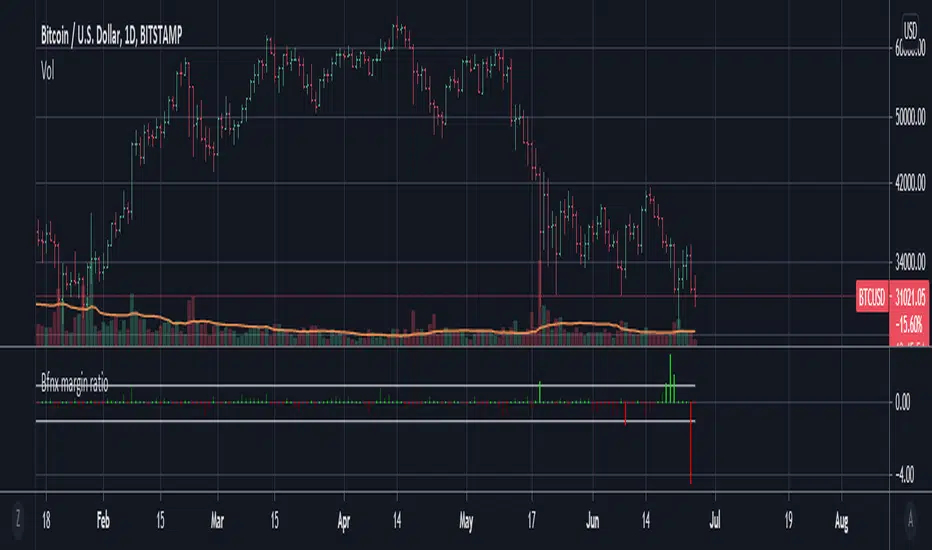
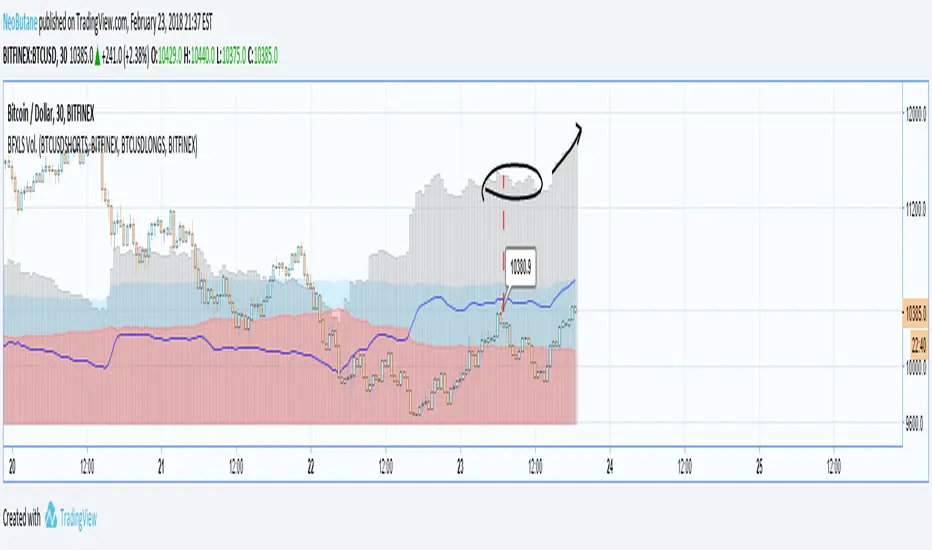
Bitfinex margin change / total volumeThis script tracks the net Bitfinex margin sizes from candle to candle (longs - shorts), and divide it by the total volume from the previous candle. This should give you a ratio of net margin trading volume over total volume on Bitfinex.
Note that assuming the delay is not severe, this ratio should never exceed 1 or -1 (since margin traded volume should strictly be lower than total traded volume during any time interval). As you can see clearly however, the ratio exceeds 1 and -1 quite frequently. Thanks to @CryptoTrendy on Twitter for bringing this issue to attention. Our trading group has noticed this issue ever since they introduced the tickers, and we suspect there are severe inaccuracies in either one, or both of the margin and total volume tickers.
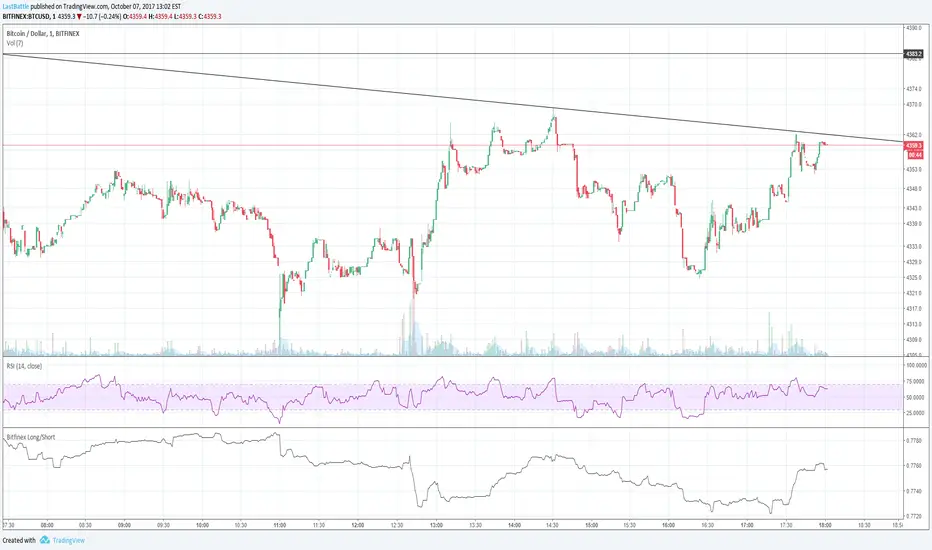
Bitfinex
Bitfinex dominionThis indicator will show you which gang is dominating the market : the bearish gang (short masters),
or the bullish gang (long masters).
The bearish gang is drawn in red and the Bullish one is in green color.
If red is above green, that means we have a bearish tendency on the market.
if green goes above red, that means the market is going the bullish way.
It's nice to use it on 1H or 30 minutes intervals.
Here's what I do : When the dominion is changing hands (=a shift in color), then that mean the market
is moving in another direction. I then use my other indicators to make a decision so to create a trade
at the very moment of the dominance change or not...
NB1: make sure you know what you do before using this "what I do" strategy. It can be not suited to
everyone. Trading is a risky business. So don't take words as granted from people like me or others.
The best thing to do is : testing,testing then re-testing while having a good money management.
I've burnt myself many times before.
NB2: Margin trading can be really risky if you use this "what I do" strategy. Because price can go far in
counter direction before getting back to our target price. So you can risk a margin call. So it's better
using this "what I do" strategy on market trading only.

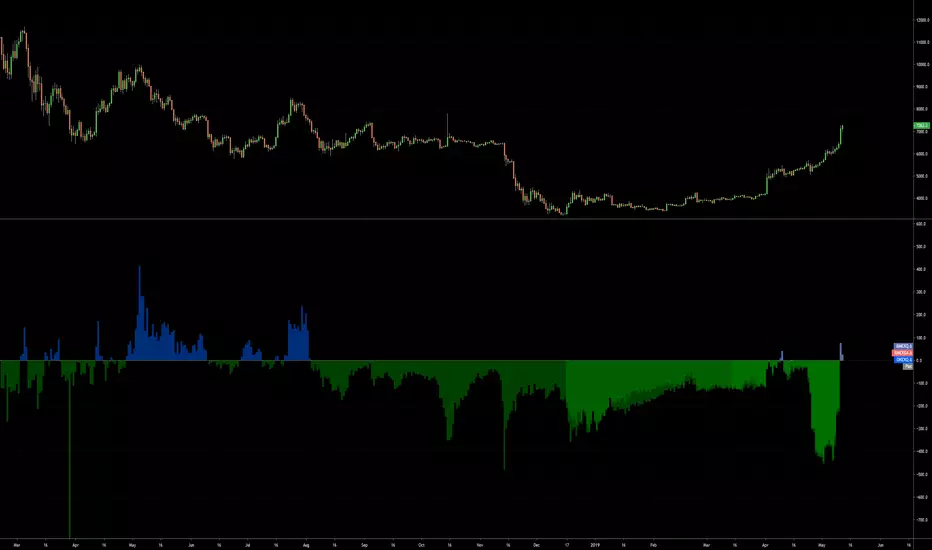
Bitfinex BTCUSD long vs short sizesThis displays the long and short margin sizes of BTCUSD on Bitfinex. When longs are higher volume, difference is filled with green color; when shorts are higher, the fill is red. Also at the bottom the total volume change vs the SMA20 is displayed. Green bars means net change is favoring longs, red the opposite. Let me know if you would like to see other additions/changes.

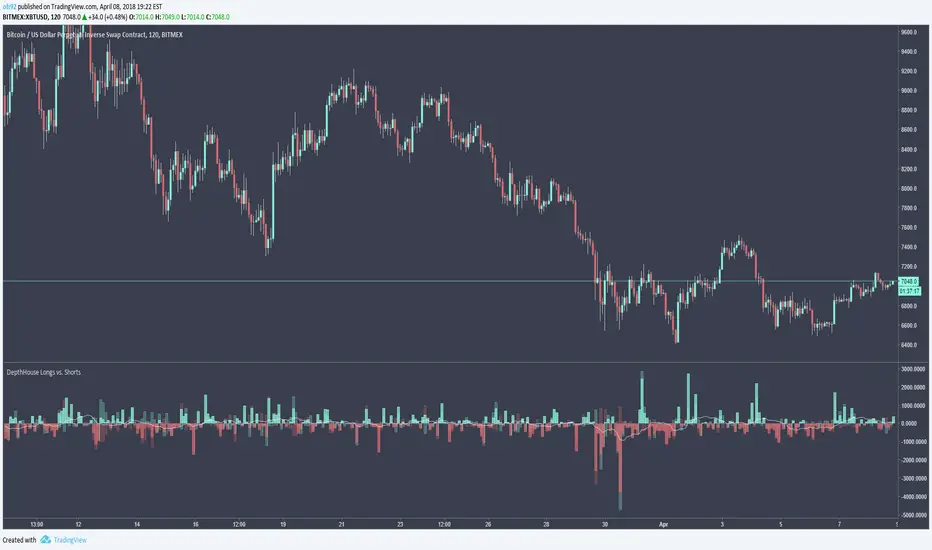
Bitfinex Longs vs. ShortsBitfinex Long vs. Short indicator takes the current bar value of Bitfinex longs and shorts and calculates the difference between the two.
The shadow bars shown behind the difference bars represent the actual amount of longs and shorts added or removed from the market.
This could be a tool used to help determine current market sentiment.
Note: the amount of shorts added/removed market is actually inverted to help get a better sense of possible market direction.
My original Bitfinex Longs vs. Shorts Indicator:
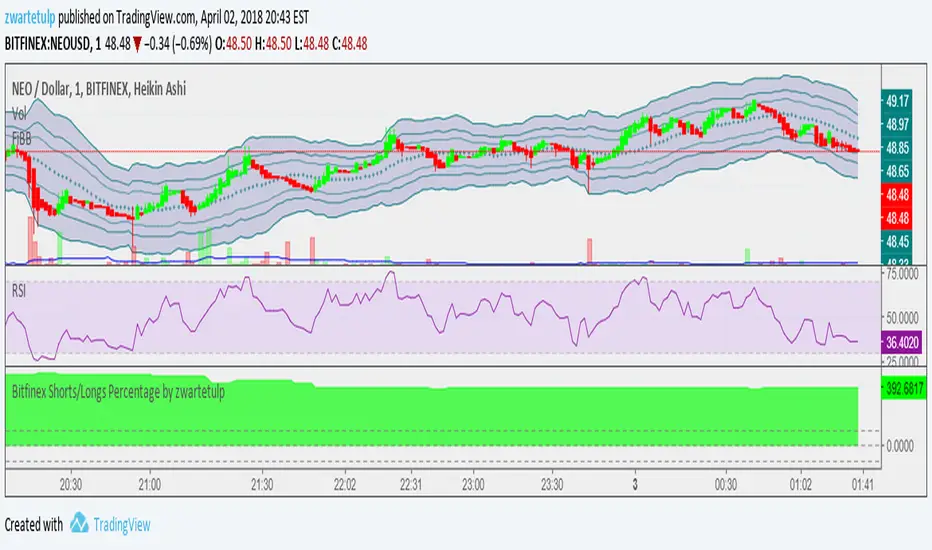
Bitfinex (BFX) Shorts/Longs Percentage by zwartetulpShows the percentage of longs vs shorts on Bitfinex (BFX).
Green area = longs > shorts
Red area = shorts > longs
ETHUSD LONGS & SHORTS Bitfinex (margin traders)It is the interpretation of margin positions ETHUSD. Data — Bitfinex

% Δ, BTC Futures vs. BTC Spot By @Cipher_ScienceAlternative Version to my previous script:
I had fellow traders ask for a delta% version instead of using the delta$!
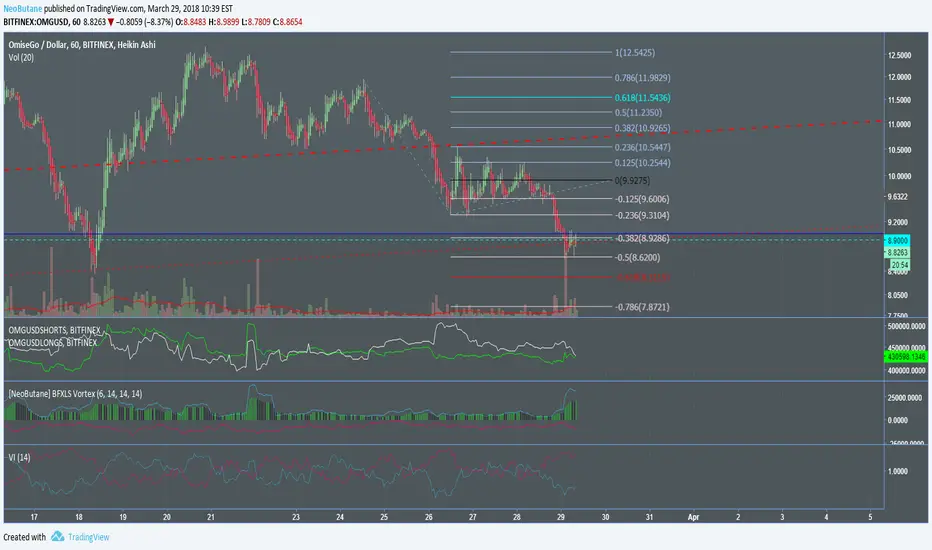
NeoButane Bitfinex BFXLS Vortex IndicatorScripted longs and shorts to the vortex indicator. It doesn't work like Vortex due to the two plots never crossing to congest.
Blue line: longs
Red line: shorts
Histogram: net volume, ohlc4 of both. Green if previous candle close had lower net volume, black if the previous candle close had more.
Deviance from the histogram: increased volume for the long or short side
Optional ADX line with customizable lookback; it can be difficult to understand due to it being completely horizontal unless you turn off the other plots.
BTC Futures vs. BTC Spot By @Cipher_ScienceThis indicator has 3 options in the "Format" settings area for each of the three major futures contracts. It is built this way because Tradingview does not allow you to build multiple indicators into one script. The best way to use this tool is to apply this indicator three times, check the box for each exchange/market, add labels, and then save it as one of your chart layouts.
If you want a more compact indicator check out my combined version here:
Please let me know if you have any issues, feature recommendations, or other script ideas.
-CS

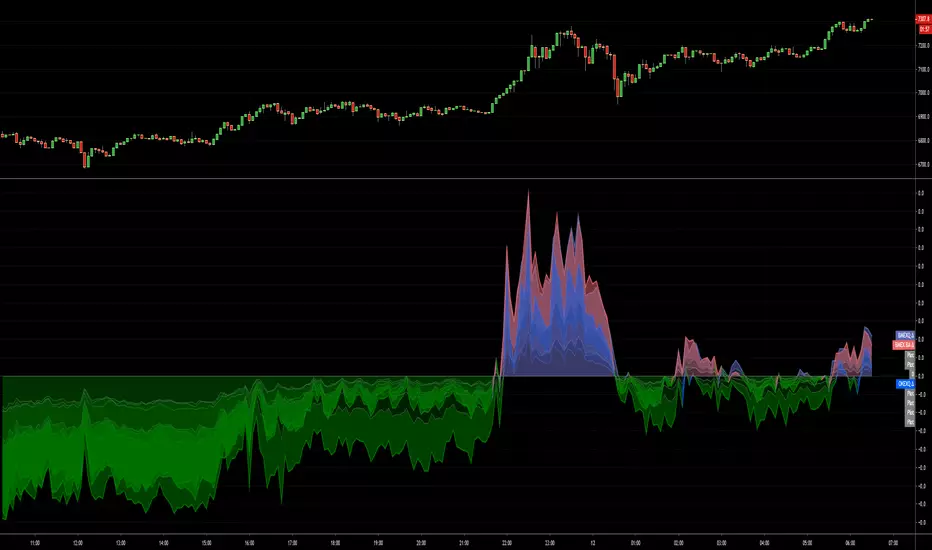
Combined BTC Futures vs. Spot {C_S}I built a baseline histogram chart that allows you to quickly view OKEX, BITMEX Quarts, and BITMEX Bi-Annuals versus spot. Colors are all editable, and you can change to area/line if youd like!
Let me know if you have any questions or suggestions!
BFX:BTC Long/Short Δ [C_S] (Delta Only)This is the interior of my other script: .
The original doesnt scale well on larger time frames due to the massive amount of longs and shorts we currently have. I am also experimenting with some other methods to better scale the data. Regardless, the delta chart with candle tops is an extremely important and useful tool.

BFX:BTC Long/Short Δ & Net [C_S]Indicator displaying long/short data for BTCUSD on Bitfinex. The delta(Δ) is shown on the interior and the net is shown on the exterior. The candles and used to display the changes in the data. Total shorts are represented as a negative number even though they are a positive value.

[nb]BFXLS Overlay 2.0Shorts = Red
Longs = Blue
Line = Triple EMA of net volume (used as an easier way to view how the volume is trending since the columns don't show it as well)
Columns = Net volume

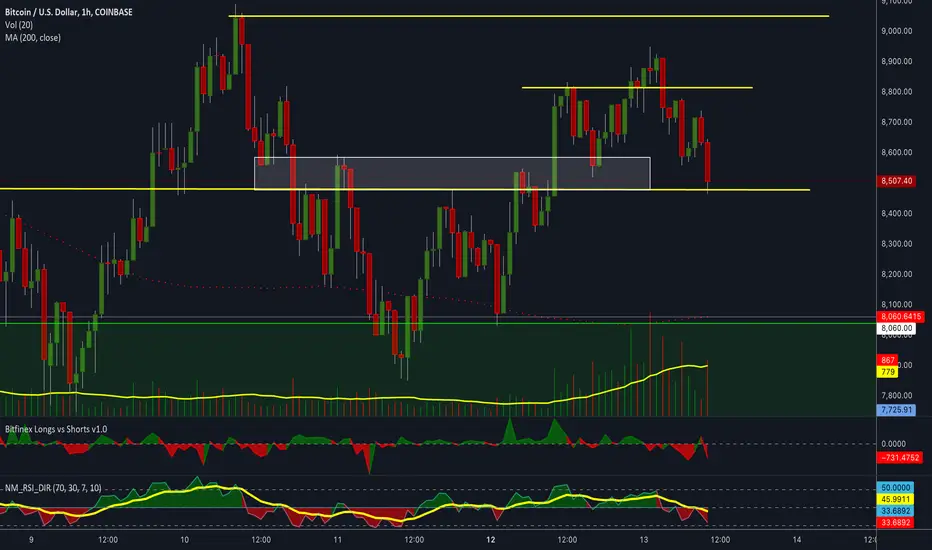
Bitfinex Longs vs Shorts v1.0
Created by Nico Muselle - 2018
This script uses the number of margin trades on Bitfinex exchange
and substracts the shorts from the longs to give a net result. The number represents the NET number of coins margin traded.
Consequently, a positive number means that there are more long trades than shorts, a negative number means there are more short trades.
The smooth option uses the 3-period SMA.
[PW] BITFINEX Shorts ChangeA very simple indicator to show the change of longs between the previous period and the current period on bitfinex, this works for any margin pair on Bitfinex but can also be locked to BITFINEX:BTCUSD, works hand in hand with my "Longs Change" indicator
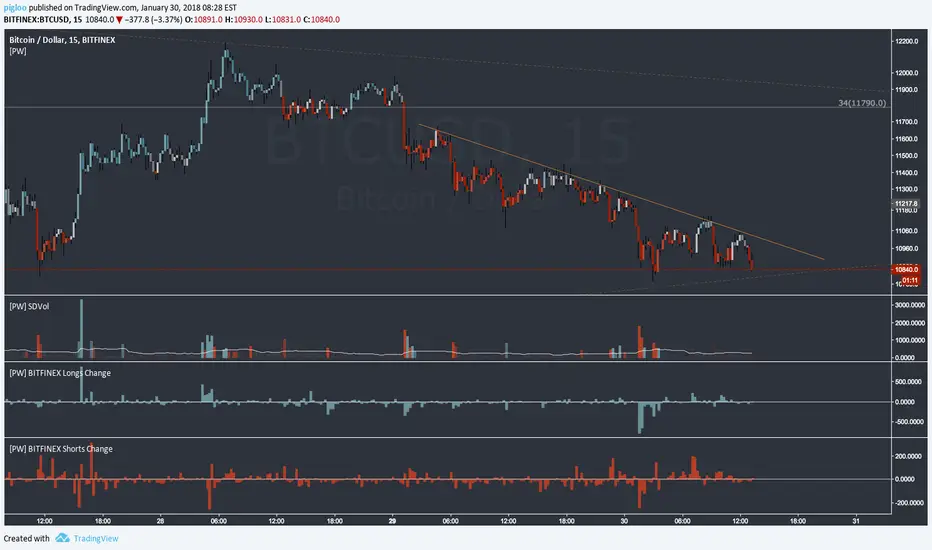
[PW] BITFINEX Longs ChangeA very simple indicator to show the change of longs between the previous period and the current period on bitfinex, this works for any margin pair on Bitfinex but can also be locked to BITFINEX:BTCUSD, works hand in hand with my "Shorts Change" indicator

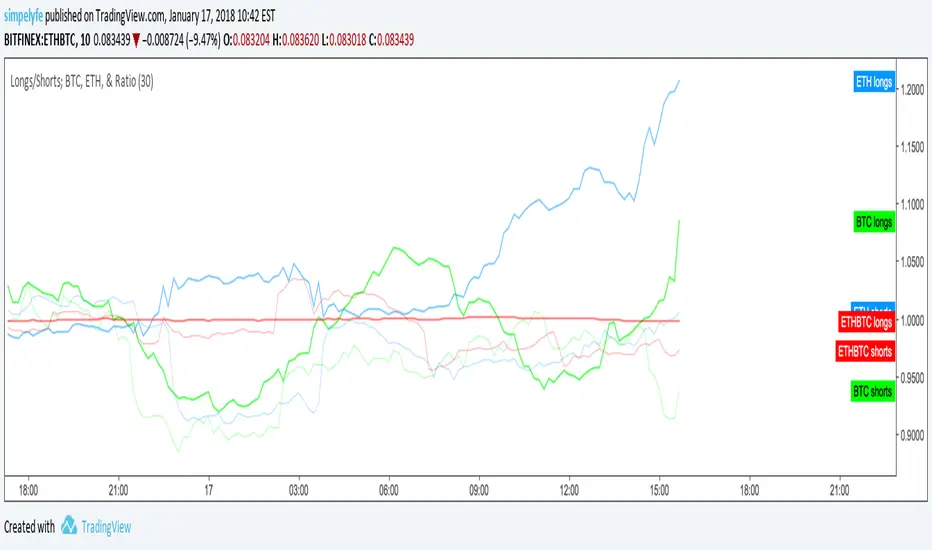
Longs vs. Shorts; BTC, ETH, & RatioLongs vs. Shorts for the following normalized as a ratio of desired period (editable).
ETHUSD
BTCUSD
ETHBTC
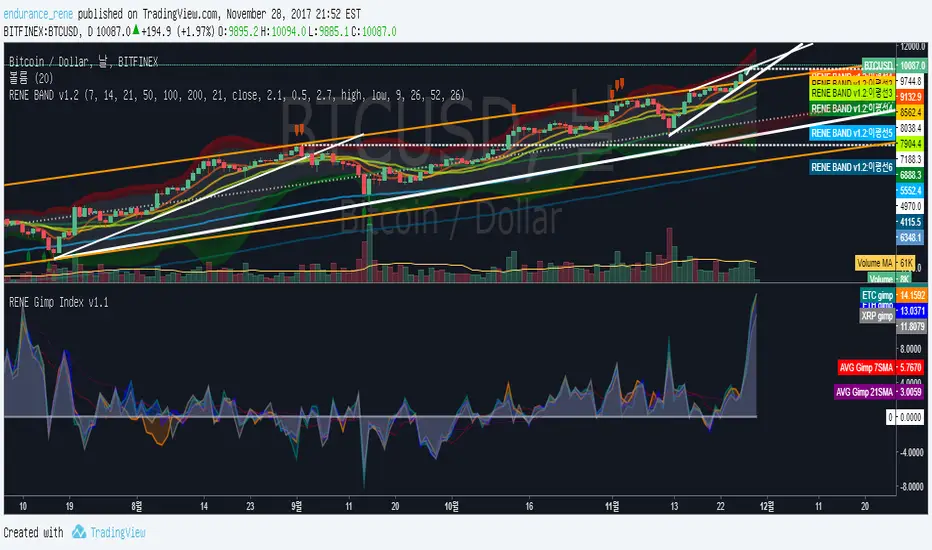
RENE Gimp Index v1.1RENE Gimp Index v1.1
1. 서 Intro
르네지표 2번째 RENE_Gimp Index v1.1을 공개합니다.
많은 분들의 요청이 있어 다음과 같은 지표를 공개하게 되었습니다.
2nd RENE indicator, RENE_Gimp Index v1.1 has released. (Gimp means 'Kimchi Premium')
Due to popular demand, I open this indicator to public.
2. 데이터 소스 Data source
4대 메이저 코인을 넣었으며, 데이터 소스는 다음과 같습니다
BTC : 빗썸 - 비트파이넥스
ETH : 코빗 - 비트파이넥스
ETC : 코빗 - 비트파이넥스
XRP : 코빗 - 비트파이넥스
(거래량기준으로 볼땐 빗썸을 사용하는게 더 적합하겠으나,
빗썸데이터가 비트에만 국한되어있어 부득이하게 다음과 같이 사용하였습니다.)
It shows four major coins, and the data sources are as follows
BTC: Bithumb - Bitfinex
ETH: Korbit - Bitfinex
ETC: Korbit - Bitfinex
XRP: Korbit - Bitfinex
(It's better to use bithumb data because of the high volume,
however the Bithumb data is limited to bitcoin only, I inevitably used Korbit data.
3. 계산법 Calculations
산식은 다음과 같습니다.
BTC 김프(%) = (BTC원화 - BTC미화*달러/원환율) / (BTC미화*달러/원환율) * 100
또한 7일 21일 단순이동평균선을 넣어 평균수치에 대해 인지할 수 있도록 하였습니다.
The formula is calculated as follows
BTC GIMP (%) = (BTC won-BTC US dollar * USD / WON) / (BTC US dollor * USD/ WON) * 100
I also added a simple moving average line on the 7th and 21st so that we can recognize the average figures.
4. 사용권한 Authorizations
개인적으로 김프를 보는데 사용하다가 르네밴드의 많은 성원에 감사하는 차원에서 무료로 공개하게 되었습니다.
따라서 별도의 권한부여는 필요하지 않으며
하단의 Add to favorite script 추가하신후, 지표- 즐겨찾기에서 사용하시면 됩니다.
혹은 퍼블릭 스크립트에서 "RENE Gimp Index"로 검색하실 수 있습니다.
I was personally used this indicator to see GIMP
and I decided to release to public for free to express my gratitude to many supports to the René Band.
Therefore, no authorization is required
Add to favorite script at the bottom and use it in Indicator - Favorites.
Or, you can search for "RENE Gimp Index" in public scripts.
5. 도움이 되었다면? Satisfied?
사용해 보시고 마음에 드신다면 RENE BAND v1.2 구매로 저에게도 도움을 주시면 감사하겠습니다.
(그림을 클릭하시면 해당 글로 이동합니다)
이미 많은 판매량을 기록하고 있으며 체험3일 이후 구매율이 높은것으로 보아 이용자분들은 만족하시고 계십니다.
이 지표사용으로 수익내는데 도움이 되셨으면 좋겠습니다.
If you would like to use it, please help me by purchasing RENE BAND v1.2.
(Click on the picture above to go to the Rene Band page)
It already sold a lot, and since the purchase rate is high after 3 days of experience, users are satisfied.
I hope this index will help you earn Profit.
글이 도움되셨다면 좋아요 눌러주시고
의견이 있으시다면 코멘트를 달아주세요. 피드백은 언제나 환영입니다 :)
If the article was helpful, Please press Favorite button below,
If you have any questions or thoughts, please leave a comment. Feedback is always welcome :)
BCH / BTC Domination Correlation - FINEXBlue Line shows the BCH dominance of a particular BTC price move.
Blue is fast, orange is slow
This version is the oscillator script of a 2-in-1 overlay + oscillator depending on which plots are enabled.
Use with "Actualized BCH+BTC Price Persistence BITFINEX" - the overlay version of this script.
SNOW_CITY

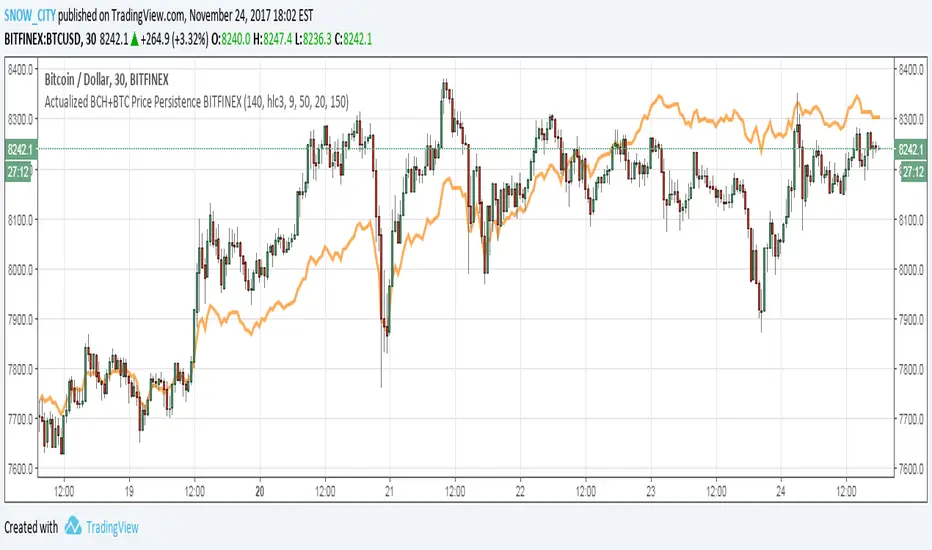
Actualized BCH+BTC Price Persistence BITFINEX
Price Line overlay shows combined BCH+BTC price normalized to the price of BTC, which is the realtime combined price (BCH+BTC) averaged over the SMA of BTC - SMA of BCH.
This indicator is a 2-in-1 overlay + oscillator depending on which plots are enabled.
This version is the overlay script, this is why there are maths that are not used by the plot.
NEED to adjust the SMA Persistence normalization depending on chart resolution.
Use with BCH "Domination Correlation" - the oscillator version of this script.
SNOW_CITY
Bitfinex BTC longs vs Short ratioSelf explanatory...
Shows the long / short ratio of trader's positioning in bitfinex exchange.
The higher the ratio, it means there are more longs. The lower the ratio, the more shorts are currently being opened,.
BFXLS - Compare styleDisplays BitFinex longs and shorts on your chart in the same was as if you add them by using TradingView's "compare" function - major advantage is that this works for all pairs that BitFinex supports without having to manually set up your chart each time.
