[blackcat] L5 Hercules SARLevel: 5
Background
The parabolic SAR is a technical indicator used to determine the price direction of an asset, as well as draw attention to when the price direction is changing. Sometimes known as the "stop and reversal system," the parabolic SAR was developed by J. Welles Wilder Jr., creator of the relative strength index (RSI).
In fact, I am also very interested in SAR and have developed some new SARs to further improve its performance. These SARs are an important part of my private script, and I hope to provide some feedback and suggestions on these variants through the use of these SARs by the TradingView community.
Function
Hercules SAR is an important one in my private library. It was designed to tracking true range of price and then filter out fluctuations of price movement and make it more robust than the traditional SAR. I make a comparison between Hercules SAR (Red Cross) and traditional SAR (Blue Cross) in TV built-in SAR function. The input parameters are the same as traditional SAR with which you can comapre it with different SAR with the same baseline.
Remarks
My first L5 SAR published
Closed-source
Free to use
Blackcat1402

[blackcat] L5 Taurus SARLevel: 5
Background
The parabolic SAR is a technical indicator used to determine the price direction of an asset, as well as draw attention to when the price direction is changing. Sometimes known as the "stop and reversal system," the parabolic SAR was developed by J. Welles Wilder Jr., creator of the relative strength index (RSI).
In fact, I am also very interested in SAR and have developed some new SARs to further improve its performance. These SARs are an important part of my private script, and I hope to provide some feedback and suggestions on these variants through the use of these SARs by the TradingView community.
Function
Taurus SAR is an important one in my private library. It was designed to filter out fluctuations of price movement and make it more robust than the traditional SAR. I make a comparison between Taurus SAR (Yellow Cross) and traditional SAR (Blue Cross) in TV built-in SAR function. The input parameters are the same as traditional SAR with which you can comapre it with different SAR with the same baseline.
Remarks
My first L5 SAR published
Closed-source
Free to use

[Sextan] Your Indicator Source PINE v5 MTFLevel: 1
NOTE1: As requested, this is a multiple time frame(MTF) version of input signal source, which enable you to backtest any indicator/strategy MTF with "{Sextan} PINEv4 Sextans Backtest Framework". Courtesy of cheatcountry for his request.security() wrapper in PINE v5 to avoid repainting caused by request.security() function.
NOTE2: Many request this indicator template to support PINE v5. Now, here it is .This is ONLY an PINE v5 EXAMPLE on HOW-TO produce a customized "{Sextan} PINEv4 Sextans Backtest Framework" (for bactest framework it does not need to be written by PINE v5)intput signal source, you can define your own indicator in the highlighted area in compliance with the uniform format, which guarantee when you use "Indicator on Indicator" function, it would not produce any error.
I use two simple moving average crossings to produce long and short entry signal with SMA3 and SMA8 in the example.
Background
Backtesting of technical indicators and strategies is the most common way to understand a quantitative strategy. However, the complicated configuration and adaptation work of backtesting many quantitative tools makes many traders who do not understand the code daunted. Moreover, although I have written a lot of strategies, I am still not very satisfied with the backtest configuration and writing efficiency. Therefore, I have been thinking about how to build a backtesting framework that can quickly and easily evaluate the backtesting performance of any indicator with a "long/short entry" indicator, that is, a "simple backtesting tool for dummies". The performance requirements should be stable, and the operation should be simple and convenient. It is best to "copy", "paste", and "a few mouse clicks" to complete the quick backtest and evaluation of a new indicator.
Luckily, I recently realized that TradingView provides an "Indicator on Indicator" feature, which is the perfect foundation for doing "hot swap" backtesting. My basic idea is to use a two-layer design. The first layer is the technical indicator signal source that needs to be embedded, which is only used to provide buy and sell signals of custom strategies; the second layer is the trading system, which is used to receive the output signals of the first layer, and filter the signals according to the agreed specifications. , Take Profit, Stop Loss, draw buy and sell signals and cost lines, define and send custom buy and sell alert messages to mobile phones, social software or trading interfaces. In general, this two-layer design is a flexible combination of "death and alive", which can meet the needs of most traders to quickly evaluate the performance of a certain technical indicator. The first layer here is flexible. Users can insert their own strategy codes according to my template, and they can draw buy and sell signals and output them to the second layer. The second layer is fixed, and the overall framework is solidified to ensure the stability and unity of the trading system. It is convenient to compare different or similar strategies under the same conditions. Finally, all trading signals are drawn on the chart, and the output strategy returns. test report.
The main function:
The first layer: "{Sextan} Your Indicator Source", the script provides a template for personalized strategy input, and the signal and definition interfaces ensure full compatibility with the second layer. Backtesting is performed stably in the backtesting framework of the layer. The first layer of this script is also relatively simple: enter your script in the highlighted custom script area, and after ensuring the final buy and sell signals long = bool condition, short = bool condition, the design of the first layer is considered complete. Input it into the PINE script editor of TradingView, save it and add it to the chart, you can see the pulse sequence in yellow (buy) and purple (sell) on the sub-picture, corresponding to the main picture, you can subjectively judge that the quality of the trading point of the strategy is good Bad.
The second layer: "{Sextan} PINEv4 Sextans Backtest Framework". This script is the standardized trading system strategy execution and alarm, used to generate the final report of the strategy backtest and some key indicators that I have customized that I find useful, such as: winning rate , Odds, Winning Surface, Kelly Ratio, Take Profit and Stop Loss Thresholds, Trading Frequency, etc. are evaluated according to the Kelly formula. To use the second layer, first load it into the TrainingView chart, no markers will appear on the chart, since you have not specified any strategy source signals, click on the gear-shaped setting next to the "{Sextan} PINEv4 Sextans BTFW" header button, you can open the backtest settings, the first item is to select your custom strategy source. Because we have added the strategy source to the chart in the previous step, you can easily find an option "{Sextan} Your Indicator Source: Signal" at the bottom of the list, this is the strategy source input we need, select and confirm , you can see various markers on the main graph, and quickly generate a backtesting profit graph and a list of backtesting reports. You can generate files and download the backtesting reports locally. You can also click the gear on the backtest chart interface to customize some conditions of the backtest, including: initial capital amount, currency type, percentage of each order placed, amount of pyramid additions, commission fees, slippage, etc. configuration. Note: The configuration in the interface dialog overrides the same configuration implemented by the code in the backtest script.
How to output charts:
The first layer: "{Sextan} Your Indicator Source", the output of this script is the pulse value of yellow and purple, yellow +1 means buy, purple -1 means sell.
The second layer: PINEv4 Sextans Backtest Framework". The output of this script is a bit complicated. After all, it is the entire trading system with a lot of information:
1. Blue and red arrows. The blue upward arrow indicates long position, the red downward arrow indicates short position, and the horizontal bar at the end of the purple arrow indicates take profit or stop loss exit.
2. Red and green lines. This is the holding cost line of the strategy, green represents the cost of holding a long position, and red represents the cost of holding a short position. The cost line is a continuous solid line and the price action is relatively close.
3. Green and yellow long take profit and stop loss area and green and yellow long take profit and stop loss fork. Once a long position is held, there is a conditional order for take profit and stop loss. The green horizontal line is the long take profit ratio line, and the yellow is the long stop loss ratio line; the green cross indicates the long take profit price, and the yellow cross indicates the long position. Stop loss price. It's worth noting that the prongs and wires don't necessarily go together. Because of the optimization of the algorithm, for a strong market, the take profit will occur after breaking the take profit line, and the profit will not be taken until the price falls.
4. The purple and red short take profit and stop loss area and the purple red short stop loss fork. Once a short position is held, there will be a take profit and stop loss conditional order, the red is the short take profit ratio line, and the purple is the short stop loss ratio line; the red cross indicates the short take profit price, and the purple cross indicates the short stop loss price.
5. In addition to the above signs, there are also text and numbers indicating the profit and loss values of long and short positions. "L" means long; "S" means short; "XL" means close long; "XS" means close short.
TradingView Strategy Tester Panel:
The overview graph is an intuitive graph that plots the blue (gain) and red (loss) curves of all backtest periods together, and notes: the absolute value and percentage of net profit, the number of all closed positions, the winning percentage, the profit factor, The maximum trading loss, the absolute value and ratio of the average trading profit and loss, and the average number of K-lines held in all trades.
Another is the performance summary. This is to display all long and short statistical indicators of backtesting in the form of a list, such as: net profit, gross profit, Sharpe ratio, maximum position, commission, times of profit and loss, etc.
Finally, the transaction list is a table indexed by the transaction serial number, showing the signal direction, date and time, price, profit and loss, accumulated profit and loss, maximum transaction profit, transaction loss and other values.
Remarks
Finally, I will explain that this is just the beginning of this model. I will continue to optimize the trading system of the second layer. Various optimization feedback and suggestions are welcome. For valuable feedback, I am willing to provide some L4/L5 technical indicators as rewards for free subscription rights.

[Sextan] Your Indicator Source PINE v4 MTFLevel: 1
NOTE1: As requested, this is a multiple time frame(MTF) version of input signal source, which enable you to backtest any indicator/strategy MTF with "{Sextan} PINEv4 Sextans Backtest Framework". Courtesy of cheatcountry for his security() wrapper to avoid repainting caused by security() function.
NOTE2: This is ONLY an EXAMPLE on HOW-TO produce a customized "{Sextan} PINEv4 Sextans Backtest Framework" intput signal source, you can define your own indicator in the highlighted area in compliance with the uniform format, which guarantee when you use "Indicator on Indicator" function, it would not produce any error.
I use two simple moving average crossings to produce long and short entry signal with SMA3 and SMA8 in the example.
Background
Backtesting of technical indicators and strategies is the most common way to understand a quantitative strategy. However, the complicated configuration and adaptation work of backtesting many quantitative tools makes many traders who do not understand the code daunted. Moreover, although I have written a lot of strategies, I am still not very satisfied with the backtest configuration and writing efficiency. Therefore, I have been thinking about how to build a backtesting framework that can quickly and easily evaluate the backtesting performance of any indicator with a "long/short entry" indicator, that is, a "simple backtesting tool for dummies". The performance requirements should be stable, and the operation should be simple and convenient. It is best to "copy", "paste", and "a few mouse clicks" to complete the quick backtest and evaluation of a new indicator.
Luckily, I recently realized that TradingView provides an "Indicator on Indicator" feature, which is the perfect foundation for doing "hot swap" backtesting. My basic idea is to use a two-layer design. The first layer is the technical indicator signal source that needs to be embedded, which is only used to provide buy and sell signals of custom strategies; the second layer is the trading system, which is used to receive the output signals of the first layer, and filter the signals according to the agreed specifications. , Take Profit, Stop Loss, draw buy and sell signals and cost lines, define and send custom buy and sell alert messages to mobile phones, social software or trading interfaces. In general, this two-layer design is a flexible combination of "death and alive", which can meet the needs of most traders to quickly evaluate the performance of a certain technical indicator. The first layer here is flexible. Users can insert their own strategy codes according to my template, and they can draw buy and sell signals and output them to the second layer. The second layer is fixed, and the overall framework is solidified to ensure the stability and unity of the trading system. It is convenient to compare different or similar strategies under the same conditions. Finally, all trading signals are drawn on the chart, and the output strategy returns. test report.
The main function:
The first layer: "{Sextan} Your Indicator Source", the script provides a template for personalized strategy input, and the signal and definition interfaces ensure full compatibility with the second layer. Backtesting is performed stably in the backtesting framework of the layer. The first layer of this script is also relatively simple: enter your script in the highlighted custom script area, and after ensuring the final buy and sell signals long = bool condition, short = bool condition, the design of the first layer is considered complete. Input it into the PINE script editor of TradingView, save it and add it to the chart, you can see the pulse sequence in yellow (buy) and purple (sell) on the sub-picture, corresponding to the main picture, you can subjectively judge that the quality of the trading point of the strategy is good Bad.
The second layer: "{Sextan} PINEv4 Sextans Backtest Framework". This script is the standardized trading system strategy execution and alarm, used to generate the final report of the strategy backtest and some key indicators that I have customized that I find useful, such as: winning rate , Odds, Winning Surface, Kelly Ratio, Take Profit and Stop Loss Thresholds, Trading Frequency, etc. are evaluated according to the Kelly formula. To use the second layer, first load it into the TrainingView chart, no markers will appear on the chart, since you have not specified any strategy source signals, click on the gear-shaped setting next to the "{Sextan} PINEv4 Sextans BTFW" header button, you can open the backtest settings, the first item is to select your custom strategy source. Because we have added the strategy source to the chart in the previous step, you can easily find an option "{Sextan} Your Indicator Source: Signal" at the bottom of the list, this is the strategy source input we need, select and confirm , you can see various markers on the main graph, and quickly generate a backtesting profit graph and a list of backtesting reports. You can generate files and download the backtesting reports locally. You can also click the gear on the backtest chart interface to customize some conditions of the backtest, including: initial capital amount, currency type, percentage of each order placed, amount of pyramid additions, commission fees, slippage, etc. configuration. Note: The configuration in the interface dialog overrides the same configuration implemented by the code in the backtest script.
How to output charts:
The first layer: "{Sextan} Your Indicator Source", the output of this script is the pulse value of yellow and purple, yellow +1 means buy, purple -1 means sell.
The second layer: PINEv4 Sextans Backtest Framework". The output of this script is a bit complicated. After all, it is the entire trading system with a lot of information:
1. Blue and red arrows. The blue upward arrow indicates long position, the red downward arrow indicates short position, and the horizontal bar at the end of the purple arrow indicates take profit or stop loss exit.
2. Red and green lines. This is the holding cost line of the strategy, green represents the cost of holding a long position, and red represents the cost of holding a short position. The cost line is a continuous solid line and the price action is relatively close.
3. Green and yellow long take profit and stop loss area and green and yellow long take profit and stop loss fork. Once a long position is held, there is a conditional order for take profit and stop loss. The green horizontal line is the long take profit ratio line, and the yellow is the long stop loss ratio line; the green cross indicates the long take profit price, and the yellow cross indicates the long position. Stop loss price. It's worth noting that the prongs and wires don't necessarily go together. Because of the optimization of the algorithm, for a strong market, the take profit will occur after breaking the take profit line, and the profit will not be taken until the price falls.
4. The purple and red short take profit and stop loss area and the purple red short stop loss fork. Once a short position is held, there will be a take profit and stop loss conditional order, the red is the short take profit ratio line, and the purple is the short stop loss ratio line; the red cross indicates the short take profit price, and the purple cross indicates the short stop loss price.
5. In addition to the above signs, there are also text and numbers indicating the profit and loss values of long and short positions. "L" means long; "S" means short; "XL" means close long; "XS" means close short.
TradingView Strategy Tester Panel:
The overview graph is an intuitive graph that plots the blue (gain) and red (loss) curves of all backtest periods together, and notes: the absolute value and percentage of net profit, the number of all closed positions, the winning percentage, the profit factor, The maximum trading loss, the absolute value and ratio of the average trading profit and loss, and the average number of K-lines held in all trades.
Another is the performance summary. This is to display all long and short statistical indicators of backtesting in the form of a list, such as: net profit, gross profit, Sharpe ratio, maximum position, commission, times of profit and loss, etc.
Finally, the transaction list is a table indexed by the transaction serial number, showing the signal direction, date and time, price, profit and loss, accumulated profit and loss, maximum transaction profit, transaction loss and other values.
Remarks
Finally, I will explain that this is just the beginning of this model. I will continue to optimize the trading system of the second layer. Various optimization feedback and suggestions are welcome. For valuable feedback, I am willing to provide some L4/L5 technical indicators as rewards for free subscription rights.

[Sextan] B-Xtrender BacktestLevel: 1
NOTE: This is a request by @scantor516 to backtest B-Xtrender @PuppyTherapy by QuantTherapy with my Sextan framework. You can backtest many of my indicators in minutes now! Of course,you can define your own indicator in the highlighted area in compliance with the uniform format, which guarantee when you use "Indicator on Indicator" function, it would not produce any error.
Courtesy of QuantTherapy for his B-Xtrender @PuppyTherapy
Background
Backtesting of technical indicators and strategies is the most common way to understand a quantitative strategy. However, the complicated configuration and adaptation work of backtesting many quantitative tools makes many traders who do not understand the code daunted. Moreover, although I have written a lot of strategies, I am still not very satisfied with the backtest configuration and writing efficiency. Therefore, I have been thinking about how to build a backtesting framework that can quickly and easily evaluate the backtesting performance of any indicator with a "long/short entry" indicator, that is, a "simple backtesting tool for dummies". The performance requirements should be stable, and the operation should be simple and convenient. It is best to "copy", "paste", and "a few mouse clicks" to complete the quick backtest and evaluation of a new indicator.
Luckily, I recently realized that TradingView provides an "Indicator on Indicator" feature, which is the perfect foundation for doing "hot swap" backtesting. My basic idea is to use a two-layer design. The first layer is the technical indicator signal source that needs to be embedded, which is only used to provide buy and sell signals of custom strategies; the second layer is the trading system, which is used to receive the output signals of the first layer, and filter the signals according to the agreed specifications. , Take Profit, Stop Loss, draw buy and sell signals and cost lines, define and send custom buy and sell alert messages to mobile phones, social software or trading interfaces. In general, this two-layer design is a flexible combination of "death and alive", which can meet the needs of most traders to quickly evaluate the performance of a certain technical indicator. The first layer here is flexible. Users can insert their own strategy codes according to my template, and they can draw buy and sell signals and output them to the second layer. The second layer is fixed, and the overall framework is solidified to ensure the stability and unity of the trading system. It is convenient to compare different or similar strategies under the same conditions. Finally, all trading signals are drawn on the chart, and the output strategy returns. test report.
The main function:
The first layer: "{Sextan} Your Indicator Source", the script provides a template for personalized strategy input, and the signal and definition interfaces ensure full compatibility with the second layer. Backtesting is performed stably in the backtesting framework of the layer. The first layer of this script is also relatively simple: enter your script in the highlighted custom script area, and after ensuring the final buy and sell signals long = bool condition, short = bool condition, the design of the first layer is considered complete. Input it into the PINE script editor of TradingView, save it and add it to the chart, you can see the pulse sequence in yellow (buy) and purple (sell) on the sub-picture, corresponding to the main picture, you can subjectively judge that the quality of the trading point of the strategy is good Bad.
The second layer: "{Sextan} PINEv4 Sextans Backtest Framework". This script is the standardized trading system strategy execution and alarm, used to generate the final report of the strategy backtest and some key indicators that I have customized that I find useful, such as: winning rate , Odds, Winning Surface, Kelly Ratio, Take Profit and Stop Loss Thresholds, Trading Frequency, etc. are evaluated according to the Kelly formula. To use the second layer, first load it into the TrainingView chart, no markers will appear on the chart, since you have not specified any strategy source signals, click on the gear-shaped setting next to the "{Sextan} PINEv4 Sextans BTFW" header button, you can open the backtest settings, the first item is to select your custom strategy source. Because we have added the strategy source to the chart in the previous step, you can easily find an option "{Sextan} Your Indicator Source: Signal" at the bottom of the list, this is the strategy source input we need, select and confirm , you can see various markers on the main graph, and quickly generate a backtesting profit graph and a list of backtesting reports. You can generate files and download the backtesting reports locally. You can also click the gear on the backtest chart interface to customize some conditions of the backtest, including: initial capital amount, currency type, percentage of each order placed, amount of pyramid additions, commission fees, slippage, etc. configuration. Note: The configuration in the interface dialog overrides the same configuration implemented by the code in the backtest script.
How to output charts:
The first layer: "{Sextan} Your Indicator Source", the output of this script is the pulse value of yellow and purple, yellow +1 means buy, purple -1 means sell.
The second layer: PINEv4 Sextans Backtest Framework". The output of this script is a bit complicated. After all, it is the entire trading system with a lot of information:
1. Blue and red arrows. The blue upward arrow indicates long position, the red downward arrow indicates short position, and the horizontal bar at the end of the purple arrow indicates take profit or stop loss exit.
2. Red and green lines. This is the holding cost line of the strategy, green represents the cost of holding a long position, and red represents the cost of holding a short position. The cost line is a continuous solid line and the price action is relatively close.
3. Green and yellow long take profit and stop loss area and green and yellow long take profit and stop loss fork. Once a long position is held, there is a conditional order for take profit and stop loss. The green horizontal line is the long take profit ratio line, and the yellow is the long stop loss ratio line; the green cross indicates the long take profit price, and the yellow cross indicates the long position. Stop loss price. It's worth noting that the prongs and wires don't necessarily go together. Because of the optimization of the algorithm, for a strong market, the take profit will occur after breaking the take profit line, and the profit will not be taken until the price falls.
4. The purple and red short take profit and stop loss area and the purple red short stop loss fork. Once a short position is held, there will be a take profit and stop loss conditional order, the red is the short take profit ratio line, and the purple is the short stop loss ratio line; the red cross indicates the short take profit price, and the purple cross indicates the short stop loss price.
5. In addition to the above signs, there are also text and numbers indicating the profit and loss values of long and short positions. "L" means long; "S" means short; "XL" means close long; "XS" means close short.
TradingView Strategy Tester Panel:
The overview graph is an intuitive graph that plots the blue (gain) and red (loss) curves of all backtest periods together, and notes: the absolute value and percentage of net profit, the number of all closed positions, the winning percentage, the profit factor, The maximum trading loss, the absolute value and ratio of the average trading profit and loss, and the average number of K-lines held in all trades.
Another is the performance summary. This is to display all long and short statistical indicators of backtesting in the form of a list, such as: net profit, gross profit, Sharpe ratio, maximum position, commission, times of profit and loss, etc.
Finally, the transaction list is a table indexed by the transaction serial number, showing the signal direction, date and time, price, profit and loss, accumulated profit and loss, maximum transaction profit, transaction loss and other values.
Remarks
Finally, I will explain that this is just the beginning of this model. I will continue to optimize the trading system of the second layer. Various optimization feedback and suggestions are welcome. For valuable feedback, I am willing to provide some L4/L5 technical indicators as rewards for free subscription rights.

[Sextan] Haos Vieual BacktestLevel: 1
NOTE: This is a request by @scantor516 to backtest Haos Visual @PuppyTherapy by QuantTherapy with my Sextan framework. You can backtest many of my indicators in minutes now! Of course,you can define your own indicator in the highlighted area in compliance with the uniform format, which guarantee when you use "Indicator on Indicator" function, it would not produce any error.
Courtesy of QuantTherapy for his Haos Visual @PuppyTherapy
Background
Backtesting of technical indicators and strategies is the most common way to understand a quantitative strategy. However, the complicated configuration and adaptation work of backtesting many quantitative tools makes many traders who do not understand the code daunted. Moreover, although I have written a lot of strategies, I am still not very satisfied with the backtest configuration and writing efficiency. Therefore, I have been thinking about how to build a backtesting framework that can quickly and easily evaluate the backtesting performance of any indicator with a "long/short entry" indicator, that is, a "simple backtesting tool for dummies". The performance requirements should be stable, and the operation should be simple and convenient. It is best to "copy", "paste", and "a few mouse clicks" to complete the quick backtest and evaluation of a new indicator.
Luckily, I recently realized that TradingView provides an "Indicator on Indicator" feature, which is the perfect foundation for doing "hot swap" backtesting. My basic idea is to use a two-layer design. The first layer is the technical indicator signal source that needs to be embedded, which is only used to provide buy and sell signals of custom strategies; the second layer is the trading system, which is used to receive the output signals of the first layer, and filter the signals according to the agreed specifications. , Take Profit, Stop Loss, draw buy and sell signals and cost lines, define and send custom buy and sell alert messages to mobile phones, social software or trading interfaces. In general, this two-layer design is a flexible combination of "death and alive", which can meet the needs of most traders to quickly evaluate the performance of a certain technical indicator. The first layer here is flexible. Users can insert their own strategy codes according to my template, and they can draw buy and sell signals and output them to the second layer. The second layer is fixed, and the overall framework is solidified to ensure the stability and unity of the trading system. It is convenient to compare different or similar strategies under the same conditions. Finally, all trading signals are drawn on the chart, and the output strategy returns. test report.
The main function:
The first layer: "{Sextan} Your Indicator Source", the script provides a template for personalized strategy input, and the signal and definition interfaces ensure full compatibility with the second layer. Backtesting is performed stably in the backtesting framework of the layer. The first layer of this script is also relatively simple: enter your script in the highlighted custom script area, and after ensuring the final buy and sell signals long = bool condition, short = bool condition, the design of the first layer is considered complete. Input it into the PINE script editor of TradingView, save it and add it to the chart, you can see the pulse sequence in yellow (buy) and purple (sell) on the sub-picture, corresponding to the main picture, you can subjectively judge that the quality of the trading point of the strategy is good Bad.
The second layer: "{Sextan} PINEv4 Sextans Backtest Framework". This script is the standardized trading system strategy execution and alarm, used to generate the final report of the strategy backtest and some key indicators that I have customized that I find useful, such as: winning rate , Odds, Winning Surface, Kelly Ratio, Take Profit and Stop Loss Thresholds, Trading Frequency, etc. are evaluated according to the Kelly formula. To use the second layer, first load it into the TrainingView chart, no markers will appear on the chart, since you have not specified any strategy source signals, click on the gear-shaped setting next to the "{Sextan} PINEv4 Sextans BTFW" header button, you can open the backtest settings, the first item is to select your custom strategy source. Because we have added the strategy source to the chart in the previous step, you can easily find an option "{Sextan} Your Indicator Source: Signal" at the bottom of the list, this is the strategy source input we need, select and confirm , you can see various markers on the main graph, and quickly generate a backtesting profit graph and a list of backtesting reports. You can generate files and download the backtesting reports locally. You can also click the gear on the backtest chart interface to customize some conditions of the backtest, including: initial capital amount, currency type, percentage of each order placed, amount of pyramid additions, commission fees, slippage, etc. configuration. Note: The configuration in the interface dialog overrides the same configuration implemented by the code in the backtest script.
How to output charts:
The first layer: "{Sextan} Your Indicator Source", the output of this script is the pulse value of yellow and purple, yellow +1 means buy, purple -1 means sell.
The second layer: PINEv4 Sextans Backtest Framework". The output of this script is a bit complicated. After all, it is the entire trading system with a lot of information:
1. Blue and red arrows. The blue upward arrow indicates long position, the red downward arrow indicates short position, and the horizontal bar at the end of the purple arrow indicates take profit or stop loss exit.
2. Red and green lines. This is the holding cost line of the strategy, green represents the cost of holding a long position, and red represents the cost of holding a short position. The cost line is a continuous solid line and the price action is relatively close.
3. Green and yellow long take profit and stop loss area and green and yellow long take profit and stop loss fork. Once a long position is held, there is a conditional order for take profit and stop loss. The green horizontal line is the long take profit ratio line, and the yellow is the long stop loss ratio line; the green cross indicates the long take profit price, and the yellow cross indicates the long position. Stop loss price. It's worth noting that the prongs and wires don't necessarily go together. Because of the optimization of the algorithm, for a strong market, the take profit will occur after breaking the take profit line, and the profit will not be taken until the price falls.
4. The purple and red short take profit and stop loss area and the purple red short stop loss fork. Once a short position is held, there will be a take profit and stop loss conditional order, the red is the short take profit ratio line, and the purple is the short stop loss ratio line; the red cross indicates the short take profit price, and the purple cross indicates the short stop loss price.
5. In addition to the above signs, there are also text and numbers indicating the profit and loss values of long and short positions. "L" means long; "S" means short; "XL" means close long; "XS" means close short.
TradingView Strategy Tester Panel:
The overview graph is an intuitive graph that plots the blue (gain) and red (loss) curves of all backtest periods together, and notes: the absolute value and percentage of net profit, the number of all closed positions, the winning percentage, the profit factor, The maximum trading loss, the absolute value and ratio of the average trading profit and loss, and the average number of K-lines held in all trades.
Another is the performance summary. This is to display all long and short statistical indicators of backtesting in the form of a list, such as: net profit, gross profit, Sharpe ratio, maximum position, commission, times of profit and loss, etc.
Finally, the transaction list is a table indexed by the transaction serial number, showing the signal direction, date and time, price, profit and loss, accumulated profit and loss, maximum transaction profit, transaction loss and other values.
Remarks
Finally, I will explain that this is just the beginning of this model. I will continue to optimize the trading system of the second layer. Various optimization feedback and suggestions are welcome. For valuable feedback, I am willing to provide some L4/L5 technical indicators as rewards for free subscription rights.

[Sextan] Delta-RSI Oscillator BacktestLevel: 1
NOTE: This is a request by @scantor516 to backtest Delta-RSI Oscillator by tbiktag with my Sextan framework. You can backtest many of my indicators in minutes now! Of course,you can define your own indicator in the highlighted area in compliance with the uniform format, which guarantee when you use "Indicator on Indicator" function, it would not produce any error.
Courtesy of tbiktag for his Delta-RSI Oscillator Strategy
Background
Backtesting of technical indicators and strategies is the most common way to understand a quantitative strategy. However, the complicated configuration and adaptation work of backtesting many quantitative tools makes many traders who do not understand the code daunted. Moreover, although I have written a lot of strategies, I am still not very satisfied with the backtest configuration and writing efficiency. Therefore, I have been thinking about how to build a backtesting framework that can quickly and easily evaluate the backtesting performance of any indicator with a "long/short entry" indicator, that is, a "simple backtesting tool for dummies". The performance requirements should be stable, and the operation should be simple and convenient. It is best to "copy", "paste", and "a few mouse clicks" to complete the quick backtest and evaluation of a new indicator.
Luckily, I recently realized that TradingView provides an "Indicator on Indicator" feature, which is the perfect foundation for doing "hot swap" backtesting. My basic idea is to use a two-layer design. The first layer is the technical indicator signal source that needs to be embedded, which is only used to provide buy and sell signals of custom strategies; the second layer is the trading system, which is used to receive the output signals of the first layer, and filter the signals according to the agreed specifications. , Take Profit, Stop Loss, draw buy and sell signals and cost lines, define and send custom buy and sell alert messages to mobile phones, social software or trading interfaces. In general, this two-layer design is a flexible combination of "death and alive", which can meet the needs of most traders to quickly evaluate the performance of a certain technical indicator. The first layer here is flexible. Users can insert their own strategy codes according to my template, and they can draw buy and sell signals and output them to the second layer. The second layer is fixed, and the overall framework is solidified to ensure the stability and unity of the trading system. It is convenient to compare different or similar strategies under the same conditions. Finally, all trading signals are drawn on the chart, and the output strategy returns. test report.
The main function:
The first layer: "{Sextan} Your Indicator Source", the script provides a template for personalized strategy input, and the signal and definition interfaces ensure full compatibility with the second layer. Backtesting is performed stably in the backtesting framework of the layer. The first layer of this script is also relatively simple: enter your script in the highlighted custom script area, and after ensuring the final buy and sell signals long = bool condition, short = bool condition, the design of the first layer is considered complete. Input it into the PINE script editor of TradingView, save it and add it to the chart, you can see the pulse sequence in yellow (buy) and purple (sell) on the sub-picture, corresponding to the main picture, you can subjectively judge that the quality of the trading point of the strategy is good Bad.
The second layer: "{Sextan} PINEv4 Sextans Backtest Framework". This script is the standardized trading system strategy execution and alarm, used to generate the final report of the strategy backtest and some key indicators that I have customized that I find useful, such as: winning rate , Odds, Winning Surface, Kelly Ratio, Take Profit and Stop Loss Thresholds, Trading Frequency, etc. are evaluated according to the Kelly formula. To use the second layer, first load it into the TrainingView chart, no markers will appear on the chart, since you have not specified any strategy source signals, click on the gear-shaped setting next to the "{Sextan} PINEv4 Sextans BTFW" header button, you can open the backtest settings, the first item is to select your custom strategy source. Because we have added the strategy source to the chart in the previous step, you can easily find an option "{Sextan} Your Indicator Source: Signal" at the bottom of the list, this is the strategy source input we need, select and confirm , you can see various markers on the main graph, and quickly generate a backtesting profit graph and a list of backtesting reports. You can generate files and download the backtesting reports locally. You can also click the gear on the backtest chart interface to customize some conditions of the backtest, including: initial capital amount, currency type, percentage of each order placed, amount of pyramid additions, commission fees, slippage, etc. configuration. Note: The configuration in the interface dialog overrides the same configuration implemented by the code in the backtest script.
How to output charts:
The first layer: "{Sextan} Your Indicator Source", the output of this script is the pulse value of yellow and purple, yellow +1 means buy, purple -1 means sell.
The second layer: PINEv4 Sextans Backtest Framework". The output of this script is a bit complicated. After all, it is the entire trading system with a lot of information:
1. Blue and red arrows. The blue upward arrow indicates long position, the red downward arrow indicates short position, and the horizontal bar at the end of the purple arrow indicates take profit or stop loss exit.
2. Red and green lines. This is the holding cost line of the strategy, green represents the cost of holding a long position, and red represents the cost of holding a short position. The cost line is a continuous solid line and the price action is relatively close.
3. Green and yellow long take profit and stop loss area and green and yellow long take profit and stop loss fork. Once a long position is held, there is a conditional order for take profit and stop loss. The green horizontal line is the long take profit ratio line, and the yellow is the long stop loss ratio line; the green cross indicates the long take profit price, and the yellow cross indicates the long position. Stop loss price. It's worth noting that the prongs and wires don't necessarily go together. Because of the optimization of the algorithm, for a strong market, the take profit will occur after breaking the take profit line, and the profit will not be taken until the price falls.
4. The purple and red short take profit and stop loss area and the purple red short stop loss fork. Once a short position is held, there will be a take profit and stop loss conditional order, the red is the short take profit ratio line, and the purple is the short stop loss ratio line; the red cross indicates the short take profit price, and the purple cross indicates the short stop loss price.
5. In addition to the above signs, there are also text and numbers indicating the profit and loss values of long and short positions. "L" means long; "S" means short; "XL" means close long; "XS" means close short.
TradingView Strategy Tester Panel:
The overview graph is an intuitive graph that plots the blue (gain) and red (loss) curves of all backtest periods together, and notes: the absolute value and percentage of net profit, the number of all closed positions, the winning percentage, the profit factor, The maximum trading loss, the absolute value and ratio of the average trading profit and loss, and the average number of K-lines held in all trades.
Another is the performance summary. This is to display all long and short statistical indicators of backtesting in the form of a list, such as: net profit, gross profit, Sharpe ratio, maximum position, commission, times of profit and loss, etc.
Finally, the transaction list is a table indexed by the transaction serial number, showing the signal direction, date and time, price, profit and loss, accumulated profit and loss, maximum transaction profit, transaction loss and other values.
Remarks
Finally, I will explain that this is just the beginning of this model. I will continue to optimize the trading system of the second layer. Various optimization feedback and suggestions are welcome. For valuable feedback, I am willing to provide some L4/L5 technical indicators as rewards for free subscription rights.

[Sextan] Supertrend - Ladder ATR BacktestLevel: 1
NOTE: This is a request by @upslidedown to backtest Supertrend - Ladder ATR by HeWhoMustNotBeNamed with my Sextan framework. You can backtest many of my indicators in minutes now! Of course,you can define your own indicator in the highlighted area in compliance with the uniform format, which guarantee when you use "Indicator on Indicator" function, it would not produce any error.
Courtesy of HeWhoMustNotBeNamed for his Supertrend - Ladder ATR indicator
Background
Backtesting of technical indicators and strategies is the most common way to understand a quantitative strategy. However, the complicated configuration and adaptation work of backtesting many quantitative tools makes many traders who do not understand the code daunted. Moreover, although I have written a lot of strategies, I am still not very satisfied with the backtest configuration and writing efficiency. Therefore, I have been thinking about how to build a backtesting framework that can quickly and easily evaluate the backtesting performance of any indicator with a "long/short entry" indicator, that is, a "simple backtesting tool for dummies". The performance requirements should be stable, and the operation should be simple and convenient. It is best to "copy", "paste", and "a few mouse clicks" to complete the quick backtest and evaluation of a new indicator.
Luckily, I recently realized that TradingView provides an "Indicator on Indicator" feature, which is the perfect foundation for doing "hot swap" backtesting. My basic idea is to use a two-layer design. The first layer is the technical indicator signal source that needs to be embedded, which is only used to provide buy and sell signals of custom strategies; the second layer is the trading system, which is used to receive the output signals of the first layer, and filter the signals according to the agreed specifications. , Take Profit, Stop Loss, draw buy and sell signals and cost lines, define and send custom buy and sell alert messages to mobile phones, social software or trading interfaces. In general, this two-layer design is a flexible combination of "death and alive", which can meet the needs of most traders to quickly evaluate the performance of a certain technical indicator. The first layer here is flexible. Users can insert their own strategy codes according to my template, and they can draw buy and sell signals and output them to the second layer. The second layer is fixed, and the overall framework is solidified to ensure the stability and unity of the trading system. It is convenient to compare different or similar strategies under the same conditions. Finally, all trading signals are drawn on the chart, and the output strategy returns. test report.
The main function:
The first layer: "{Sextan} Your Indicator Source", the script provides a template for personalized strategy input, and the signal and definition interfaces ensure full compatibility with the second layer. Backtesting is performed stably in the backtesting framework of the layer. The first layer of this script is also relatively simple: enter your script in the highlighted custom script area, and after ensuring the final buy and sell signals long = bool condition, short = bool condition, the design of the first layer is considered complete. Input it into the PINE script editor of TradingView, save it and add it to the chart, you can see the pulse sequence in yellow (buy) and purple (sell) on the sub-picture, corresponding to the main picture, you can subjectively judge that the quality of the trading point of the strategy is good Bad.
The second layer: "{Sextan} PINEv4 Sextans Backtest Framework". This script is the standardized trading system strategy execution and alarm, used to generate the final report of the strategy backtest and some key indicators that I have customized that I find useful, such as: winning rate , Odds, Winning Surface, Kelly Ratio, Take Profit and Stop Loss Thresholds, Trading Frequency, etc. are evaluated according to the Kelly formula. To use the second layer, first load it into the TrainingView chart, no markers will appear on the chart, since you have not specified any strategy source signals, click on the gear-shaped setting next to the "{Sextan} PINEv4 Sextans BTFW" header button, you can open the backtest settings, the first item is to select your custom strategy source. Because we have added the strategy source to the chart in the previous step, you can easily find an option "{Sextan} Your Indicator Source: Signal" at the bottom of the list, this is the strategy source input we need, select and confirm , you can see various markers on the main graph, and quickly generate a backtesting profit graph and a list of backtesting reports. You can generate files and download the backtesting reports locally. You can also click the gear on the backtest chart interface to customize some conditions of the backtest, including: initial capital amount, currency type, percentage of each order placed, amount of pyramid additions, commission fees, slippage, etc. configuration. Note: The configuration in the interface dialog overrides the same configuration implemented by the code in the backtest script.
How to output charts:
The first layer: "{Sextan} Your Indicator Source", the output of this script is the pulse value of yellow and purple, yellow +1 means buy, purple -1 means sell.
The second layer: PINEv4 Sextans Backtest Framework". The output of this script is a bit complicated. After all, it is the entire trading system with a lot of information:
1. Blue and red arrows. The blue upward arrow indicates long position, the red downward arrow indicates short position, and the horizontal bar at the end of the purple arrow indicates take profit or stop loss exit.
2. Red and green lines. This is the holding cost line of the strategy, green represents the cost of holding a long position, and red represents the cost of holding a short position. The cost line is a continuous solid line and the price action is relatively close.
3. Green and yellow long take profit and stop loss area and green and yellow long take profit and stop loss fork. Once a long position is held, there is a conditional order for take profit and stop loss. The green horizontal line is the long take profit ratio line, and the yellow is the long stop loss ratio line; the green cross indicates the long take profit price, and the yellow cross indicates the long position. Stop loss price. It's worth noting that the prongs and wires don't necessarily go together. Because of the optimization of the algorithm, for a strong market, the take profit will occur after breaking the take profit line, and the profit will not be taken until the price falls.
4. The purple and red short take profit and stop loss area and the purple red short stop loss fork. Once a short position is held, there will be a take profit and stop loss conditional order, the red is the short take profit ratio line, and the purple is the short stop loss ratio line; the red cross indicates the short take profit price, and the purple cross indicates the short stop loss price.
5. In addition to the above signs, there are also text and numbers indicating the profit and loss values of long and short positions. "L" means long; "S" means short; "XL" means close long; "XS" means close short.
TradingView Strategy Tester Panel:
The overview graph is an intuitive graph that plots the blue (gain) and red (loss) curves of all backtest periods together, and notes: the absolute value and percentage of net profit, the number of all closed positions, the winning percentage, the profit factor, The maximum trading loss, the absolute value and ratio of the average trading profit and loss, and the average number of K-lines held in all trades.
Another is the performance summary. This is to display all long and short statistical indicators of backtesting in the form of a list, such as: net profit, gross profit, Sharpe ratio, maximum position, commission, times of profit and loss, etc.
Finally, the transaction list is a table indexed by the transaction serial number, showing the signal direction, date and time, price, profit and loss, accumulated profit and loss, maximum transaction profit, transaction loss and other values.
Remarks
Finally, I will explain that this is just the beginning of this model. I will continue to optimize the trading system of the second layer. Various optimization feedback and suggestions are welcome. For valuable feedback, I am willing to provide some L4/L5 technical indicators as rewards for free subscription rights.

[Sextan] Your Indicator Source for PINE v5Level: 1
NOTE: Many request this indicator template to support PINE v5. Now, here it is .This is ONLY an PINE v5 EXAMPLE on HOW-TO produce a customized "{Sextan} PINEv4 Sextans Backtest Framework" (for bactest framework it does not need to be written by PINE v5)intput signal source, you can define your own indicator in the highlighted area in compliance with the uniform format, which guarantee when you use "Indicator on Indicator" function, it would not produce any error.
I use two simple moving average crossings to produce long and short entry signal with SMA3 and SMA8 in the example.
Background
Backtesting of technical indicators and strategies is the most common way to understand a quantitative strategy. However, the complicated configuration and adaptation work of backtesting many quantitative tools makes many traders who do not understand the code daunted. Moreover, although I have written a lot of strategies, I am still not very satisfied with the backtest configuration and writing efficiency. Therefore, I have been thinking about how to build a backtesting framework that can quickly and easily evaluate the backtesting performance of any indicator with a "long/short entry" indicator, that is, a "simple backtesting tool for dummies". The performance requirements should be stable, and the operation should be simple and convenient. It is best to "copy", "paste", and "a few mouse clicks" to complete the quick backtest and evaluation of a new indicator.
Luckily, I recently realized that TradingView provides an "Indicator on Indicator" feature, which is the perfect foundation for doing "hot swap" backtesting. My basic idea is to use a two-layer design. The first layer is the technical indicator signal source that needs to be embedded, which is only used to provide buy and sell signals of custom strategies; the second layer is the trading system, which is used to receive the output signals of the first layer, and filter the signals according to the agreed specifications. , Take Profit, Stop Loss, draw buy and sell signals and cost lines, define and send custom buy and sell alert messages to mobile phones, social software or trading interfaces. In general, this two-layer design is a flexible combination of "death and alive", which can meet the needs of most traders to quickly evaluate the performance of a certain technical indicator. The first layer here is flexible. Users can insert their own strategy codes according to my template, and they can draw buy and sell signals and output them to the second layer. The second layer is fixed, and the overall framework is solidified to ensure the stability and unity of the trading system. It is convenient to compare different or similar strategies under the same conditions. Finally, all trading signals are drawn on the chart, and the output strategy returns. test report.
The main function:
The first layer: "{Sextan} Your Indicator Source", the script provides a template for personalized strategy input, and the signal and definition interfaces ensure full compatibility with the second layer. Backtesting is performed stably in the backtesting framework of the layer. The first layer of this script is also relatively simple: enter your script in the highlighted custom script area, and after ensuring the final buy and sell signals long = bool condition, short = bool condition, the design of the first layer is considered complete. Input it into the PINE script editor of TradingView, save it and add it to the chart, you can see the pulse sequence in yellow (buy) and purple (sell) on the sub-picture, corresponding to the main picture, you can subjectively judge that the quality of the trading point of the strategy is good Bad.
The second layer: "{Sextan} PINEv4 Sextans Backtest Framework". This script is the standardized trading system strategy execution and alarm, used to generate the final report of the strategy backtest and some key indicators that I have customized that I find useful, such as: winning rate , Odds, Winning Surface, Kelly Ratio, Take Profit and Stop Loss Thresholds, Trading Frequency, etc. are evaluated according to the Kelly formula. To use the second layer, first load it into the TrainingView chart, no markers will appear on the chart, since you have not specified any strategy source signals, click on the gear-shaped setting next to the "{Sextan} PINEv4 Sextans BTFW" header button, you can open the backtest settings, the first item is to select your custom strategy source. Because we have added the strategy source to the chart in the previous step, you can easily find an option "{Sextan} Your Indicator Source: Signal" at the bottom of the list, this is the strategy source input we need, select and confirm , you can see various markers on the main graph, and quickly generate a backtesting profit graph and a list of backtesting reports. You can generate files and download the backtesting reports locally. You can also click the gear on the backtest chart interface to customize some conditions of the backtest, including: initial capital amount, currency type, percentage of each order placed, amount of pyramid additions, commission fees, slippage, etc. configuration. Note: The configuration in the interface dialog overrides the same configuration implemented by the code in the backtest script.
How to output charts:
The first layer: "{Sextan} Your Indicator Source", the output of this script is the pulse value of yellow and purple, yellow +1 means buy, purple -1 means sell.
The second layer: PINEv4 Sextans Backtest Framework". The output of this script is a bit complicated. After all, it is the entire trading system with a lot of information:
1. Blue and red arrows. The blue upward arrow indicates long position, the red downward arrow indicates short position, and the horizontal bar at the end of the purple arrow indicates take profit or stop loss exit.
2. Red and green lines. This is the holding cost line of the strategy, green represents the cost of holding a long position, and red represents the cost of holding a short position. The cost line is a continuous solid line and the price action is relatively close.
3. Green and yellow long take profit and stop loss area and green and yellow long take profit and stop loss fork. Once a long position is held, there is a conditional order for take profit and stop loss. The green horizontal line is the long take profit ratio line, and the yellow is the long stop loss ratio line; the green cross indicates the long take profit price, and the yellow cross indicates the long position. Stop loss price. It's worth noting that the prongs and wires don't necessarily go together. Because of the optimization of the algorithm, for a strong market, the take profit will occur after breaking the take profit line, and the profit will not be taken until the price falls.
4. The purple and red short take profit and stop loss area and the purple red short stop loss fork. Once a short position is held, there will be a take profit and stop loss conditional order, the red is the short take profit ratio line, and the purple is the short stop loss ratio line; the red cross indicates the short take profit price, and the purple cross indicates the short stop loss price.
5. In addition to the above signs, there are also text and numbers indicating the profit and loss values of long and short positions. "L" means long; "S" means short; "XL" means close long; "XS" means close short.
TradingView Strategy Tester Panel:
The overview graph is an intuitive graph that plots the blue (gain) and red (loss) curves of all backtest periods together, and notes: the absolute value and percentage of net profit, the number of all closed positions, the winning percentage, the profit factor, The maximum trading loss, the absolute value and ratio of the average trading profit and loss, and the average number of K-lines held in all trades.
Another is the performance summary. This is to display all long and short statistical indicators of backtesting in the form of a list, such as: net profit, gross profit, Sharpe ratio, maximum position, commission, times of profit and loss, etc.
Finally, the transaction list is a table indexed by the transaction serial number, showing the signal direction, date and time, price, profit and loss, accumulated profit and loss, maximum transaction profit, transaction loss and other values.
Remarks
Finally, I will explain that this is just the beginning of this model. I will continue to optimize the trading system of the second layer. Various optimization feedback and suggestions are welcome. For valuable feedback, I am willing to provide some L4/L5 technical indicators as rewards for free subscription rights.

[Sextan] Hull MA BacktestLevel: 1
NOTE: This is a request by @babaa to backtest Hull suite by InSilico with my Sextan framework. You can backtest many of my indicators in minutes now! Of course,you can define your own indicator in the highlighted area in compliance with the uniform format, which guarantee when you use "Indicator on Indicator" function, it would not produce any error.
Courtesy of InSilico for his Hull suite indicator
Background
Backtesting of technical indicators and strategies is the most common way to understand a quantitative strategy. However, the complicated configuration and adaptation work of backtesting many quantitative tools makes many traders who do not understand the code daunted. Moreover, although I have written a lot of strategies, I am still not very satisfied with the backtest configuration and writing efficiency. Therefore, I have been thinking about how to build a backtesting framework that can quickly and easily evaluate the backtesting performance of any indicator with a "long/short entry" indicator, that is, a "simple backtesting tool for dummies". The performance requirements should be stable, and the operation should be simple and convenient. It is best to "copy", "paste", and "a few mouse clicks" to complete the quick backtest and evaluation of a new indicator.
Luckily, I recently realized that TradingView provides an "Indicator on Indicator" feature, which is the perfect foundation for doing "hot swap" backtesting. My basic idea is to use a two-layer design. The first layer is the technical indicator signal source that needs to be embedded, which is only used to provide buy and sell signals of custom strategies; the second layer is the trading system, which is used to receive the output signals of the first layer, and filter the signals according to the agreed specifications. , Take Profit, Stop Loss, draw buy and sell signals and cost lines, define and send custom buy and sell alert messages to mobile phones, social software or trading interfaces. In general, this two-layer design is a flexible combination of "death and alive", which can meet the needs of most traders to quickly evaluate the performance of a certain technical indicator. The first layer here is flexible. Users can insert their own strategy codes according to my template, and they can draw buy and sell signals and output them to the second layer. The second layer is fixed, and the overall framework is solidified to ensure the stability and unity of the trading system. It is convenient to compare different or similar strategies under the same conditions. Finally, all trading signals are drawn on the chart, and the output strategy returns. test report.
The main function:
The first layer: "{Sextan} Your Indicator Source", the script provides a template for personalized strategy input, and the signal and definition interfaces ensure full compatibility with the second layer. Backtesting is performed stably in the backtesting framework of the layer. The first layer of this script is also relatively simple: enter your script in the highlighted custom script area, and after ensuring the final buy and sell signals long = bool condition, short = bool condition, the design of the first layer is considered complete. Input it into the PINE script editor of TradingView, save it and add it to the chart, you can see the pulse sequence in yellow (buy) and purple (sell) on the sub-picture, corresponding to the main picture, you can subjectively judge that the quality of the trading point of the strategy is good Bad.
The second layer: "{Sextan} PINEv4 Sextans Backtest Framework". This script is the standardized trading system strategy execution and alarm, used to generate the final report of the strategy backtest and some key indicators that I have customized that I find useful, such as: winning rate , Odds, Winning Surface, Kelly Ratio, Take Profit and Stop Loss Thresholds, Trading Frequency, etc. are evaluated according to the Kelly formula. To use the second layer, first load it into the TrainingView chart, no markers will appear on the chart, since you have not specified any strategy source signals, click on the gear-shaped setting next to the "{Sextan} PINEv4 Sextans BTFW" header button, you can open the backtest settings, the first item is to select your custom strategy source. Because we have added the strategy source to the chart in the previous step, you can easily find an option "{Sextan} Your Indicator Source: Signal" at the bottom of the list, this is the strategy source input we need, select and confirm , you can see various markers on the main graph, and quickly generate a backtesting profit graph and a list of backtesting reports. You can generate files and download the backtesting reports locally. You can also click the gear on the backtest chart interface to customize some conditions of the backtest, including: initial capital amount, currency type, percentage of each order placed, amount of pyramid additions, commission fees, slippage, etc. configuration. Note: The configuration in the interface dialog overrides the same configuration implemented by the code in the backtest script.
How to output charts:
The first layer: "{Sextan} Your Indicator Source", the output of this script is the pulse value of yellow and purple, yellow +1 means buy, purple -1 means sell.
The second layer: PINEv4 Sextans Backtest Framework". The output of this script is a bit complicated. After all, it is the entire trading system with a lot of information:
1. Blue and red arrows. The blue upward arrow indicates long position, the red downward arrow indicates short position, and the horizontal bar at the end of the purple arrow indicates take profit or stop loss exit.
2. Red and green lines. This is the holding cost line of the strategy, green represents the cost of holding a long position, and red represents the cost of holding a short position. The cost line is a continuous solid line and the price action is relatively close.
3. Green and yellow long take profit and stop loss area and green and yellow long take profit and stop loss fork. Once a long position is held, there is a conditional order for take profit and stop loss. The green horizontal line is the long take profit ratio line, and the yellow is the long stop loss ratio line; the green cross indicates the long take profit price, and the yellow cross indicates the long position. Stop loss price. It's worth noting that the prongs and wires don't necessarily go together. Because of the optimization of the algorithm, for a strong market, the take profit will occur after breaking the take profit line, and the profit will not be taken until the price falls.
4. The purple and red short take profit and stop loss area and the purple red short stop loss fork. Once a short position is held, there will be a take profit and stop loss conditional order, the red is the short take profit ratio line, and the purple is the short stop loss ratio line; the red cross indicates the short take profit price, and the purple cross indicates the short stop loss price.
5. In addition to the above signs, there are also text and numbers indicating the profit and loss values of long and short positions. "L" means long; "S" means short; "XL" means close long; "XS" means close short.
TradingView Strategy Tester Panel:
The overview graph is an intuitive graph that plots the blue (gain) and red (loss) curves of all backtest periods together, and notes: the absolute value and percentage of net profit, the number of all closed positions, the winning percentage, the profit factor, The maximum trading loss, the absolute value and ratio of the average trading profit and loss, and the average number of K-lines held in all trades.
Another is the performance summary. This is to display all long and short statistical indicators of backtesting in the form of a list, such as: net profit, gross profit, Sharpe ratio, maximum position, commission, times of profit and loss, etc.
Finally, the transaction list is a table indexed by the transaction serial number, showing the signal direction, date and time, price, profit and loss, accumulated profit and loss, maximum transaction profit, transaction loss and other values.
Remarks
Finally, I will explain that this is just the beginning of this model. I will continue to optimize the trading system of the second layer. Various optimization feedback and suggestions are welcome. For valuable feedback, I am willing to provide some L4/L5 technical indicators as rewards for free subscription rights.

[Sextan] Fisher Transform BacktestLevel: 1
NOTE: This is a request by @Uni_ve12se to backtest Ehlers Fisher Transform by cheatcountry with my Sextan framework. I ONLY take 5 minutes to perform it and how much time would you cost for this work? You can backtest many of my indicators in minutes now! Of course,you can define your own indicator in the highlighted area in compliance with the uniform format, which guarantee when you use "Indicator on Indicator" function, it would not produce any error.
Courtesy of cheatcountry for his Ehlers Fisher Transform indicator
Background
Backtesting of technical indicators and strategies is the most common way to understand a quantitative strategy. However, the complicated configuration and adaptation work of backtesting many quantitative tools makes many traders who do not understand the code daunted. Moreover, although I have written a lot of strategies, I am still not very satisfied with the backtest configuration and writing efficiency. Therefore, I have been thinking about how to build a backtesting framework that can quickly and easily evaluate the backtesting performance of any indicator with a "long/short entry" indicator, that is, a "simple backtesting tool for dummies". The performance requirements should be stable, and the operation should be simple and convenient. It is best to "copy", "paste", and "a few mouse clicks" to complete the quick backtest and evaluation of a new indicator.
Luckily, I recently realized that TradingView provides an "Indicator on Indicator" feature, which is the perfect foundation for doing "hot swap" backtesting. My basic idea is to use a two-layer design. The first layer is the technical indicator signal source that needs to be embedded, which is only used to provide buy and sell signals of custom strategies; the second layer is the trading system, which is used to receive the output signals of the first layer, and filter the signals according to the agreed specifications. , Take Profit, Stop Loss, draw buy and sell signals and cost lines, define and send custom buy and sell alert messages to mobile phones, social software or trading interfaces. In general, this two-layer design is a flexible combination of "death and alive", which can meet the needs of most traders to quickly evaluate the performance of a certain technical indicator. The first layer here is flexible. Users can insert their own strategy codes according to my template, and they can draw buy and sell signals and output them to the second layer. The second layer is fixed, and the overall framework is solidified to ensure the stability and unity of the trading system. It is convenient to compare different or similar strategies under the same conditions. Finally, all trading signals are drawn on the chart, and the output strategy returns. test report.
The main function:
The first layer: "{Sextan} Your Indicator Source", the script provides a template for personalized strategy input, and the signal and definition interfaces ensure full compatibility with the second layer. Backtesting is performed stably in the backtesting framework of the layer. The first layer of this script is also relatively simple: enter your script in the highlighted custom script area, and after ensuring the final buy and sell signals long = bool condition, short = bool condition, the design of the first layer is considered complete. Input it into the PINE script editor of TradingView, save it and add it to the chart, you can see the pulse sequence in yellow (buy) and purple (sell) on the sub-picture, corresponding to the main picture, you can subjectively judge that the quality of the trading point of the strategy is good Bad.
The second layer: "{Sextan} PINEv4 Sextans Backtest Framework". This script is the standardized trading system strategy execution and alarm, used to generate the final report of the strategy backtest and some key indicators that I have customized that I find useful, such as: winning rate , Odds, Winning Surface, Kelly Ratio, Take Profit and Stop Loss Thresholds, Trading Frequency, etc. are evaluated according to the Kelly formula. To use the second layer, first load it into the TrainingView chart, no markers will appear on the chart, since you have not specified any strategy source signals, click on the gear-shaped setting next to the "{Sextan} PINEv4 Sextans BTFW" header button, you can open the backtest settings, the first item is to select your custom strategy source. Because we have added the strategy source to the chart in the previous step, you can easily find an option "{Sextan} Your Indicator Source: Signal" at the bottom of the list, this is the strategy source input we need, select and confirm , you can see various markers on the main graph, and quickly generate a backtesting profit graph and a list of backtesting reports. You can generate files and download the backtesting reports locally. You can also click the gear on the backtest chart interface to customize some conditions of the backtest, including: initial capital amount, currency type, percentage of each order placed, amount of pyramid additions, commission fees, slippage, etc. configuration. Note: The configuration in the interface dialog overrides the same configuration implemented by the code in the backtest script.
How to output charts:
The first layer: "{Sextan} Your Indicator Source", the output of this script is the pulse value of yellow and purple, yellow +1 means buy, purple -1 means sell.
The second layer: PINEv4 Sextans Backtest Framework". The output of this script is a bit complicated. After all, it is the entire trading system with a lot of information:
1. Blue and red arrows. The blue upward arrow indicates long position, the red downward arrow indicates short position, and the horizontal bar at the end of the purple arrow indicates take profit or stop loss exit.
2. Red and green lines. This is the holding cost line of the strategy, green represents the cost of holding a long position, and red represents the cost of holding a short position. The cost line is a continuous solid line and the price action is relatively close.
3. Green and yellow long take profit and stop loss area and green and yellow long take profit and stop loss fork. Once a long position is held, there is a conditional order for take profit and stop loss. The green horizontal line is the long take profit ratio line, and the yellow is the long stop loss ratio line; the green cross indicates the long take profit price, and the yellow cross indicates the long position. Stop loss price. It's worth noting that the prongs and wires don't necessarily go together. Because of the optimization of the algorithm, for a strong market, the take profit will occur after breaking the take profit line, and the profit will not be taken until the price falls.
4. The purple and red short take profit and stop loss area and the purple red short stop loss fork. Once a short position is held, there will be a take profit and stop loss conditional order, the red is the short take profit ratio line, and the purple is the short stop loss ratio line; the red cross indicates the short take profit price, and the purple cross indicates the short stop loss price.
5. In addition to the above signs, there are also text and numbers indicating the profit and loss values of long and short positions. "L" means long; "S" means short; "XL" means close long; "XS" means close short.
TradingView Strategy Tester Panel:
The overview graph is an intuitive graph that plots the blue (gain) and red (loss) curves of all backtest periods together, and notes: the absolute value and percentage of net profit, the number of all closed positions, the winning percentage, the profit factor, The maximum trading loss, the absolute value and ratio of the average trading profit and loss, and the average number of K-lines held in all trades.
Another is the performance summary. This is to display all long and short statistical indicators of backtesting in the form of a list, such as: net profit, gross profit, Sharpe ratio, maximum position, commission, times of profit and loss, etc.
Finally, the transaction list is a table indexed by the transaction serial number, showing the signal direction, date and time, price, profit and loss, accumulated profit and loss, maximum transaction profit, transaction loss and other values.
Remarks
Finally, I will explain that this is just the beginning of this model. I will continue to optimize the trading system of the second layer. Various optimization feedback and suggestions are welcome. For valuable feedback, I am willing to provide some L4/L5 technical indicators as rewards for free subscription rights.

[Sextan] M-Oscillator BacktestLevel: 1
NOTE: This is a request by @scantor516 to backtest M-Oscillator by Mango2Juice with my Sextan framework. I ONLY take 5 minutes to perform it and how much time would you cost for this work?
Courtesy of Mango2Juice for M-Oscillator script.
You can backtest many of my indicators in minutes now! Of course,you can define your own indicator in the highlighted area in compliance with the uniform format, which guarantee when you use "Indicator on Indicator" function, it would not produce any error.
Background
Backtesting of technical indicators and strategies is the most common way to understand a quantitative strategy. However, the complicated configuration and adaptation work of backtesting many quantitative tools makes many traders who do not understand the code daunted. Moreover, although I have written a lot of strategies, I am still not very satisfied with the backtest configuration and writing efficiency. Therefore, I have been thinking about how to build a backtesting framework that can quickly and easily evaluate the backtesting performance of any indicator with a "long/short entry" indicator, that is, a "simple backtesting tool for dummies". The performance requirements should be stable, and the operation should be simple and convenient. It is best to "copy", "paste", and "a few mouse clicks" to complete the quick backtest and evaluation of a new indicator.
Luckily, I recently realized that TradingView provides an "Indicator on Indicator" feature, which is the perfect foundation for doing "hot swap" backtesting. My basic idea is to use a two-layer design. The first layer is the technical indicator signal source that needs to be embedded, which is only used to provide buy and sell signals of custom strategies; the second layer is the trading system, which is used to receive the output signals of the first layer, and filter the signals according to the agreed specifications. , Take Profit, Stop Loss, draw buy and sell signals and cost lines, define and send custom buy and sell alert messages to mobile phones, social software or trading interfaces. In general, this two-layer design is a flexible combination of "death and alive", which can meet the needs of most traders to quickly evaluate the performance of a certain technical indicator. The first layer here is flexible. Users can insert their own strategy codes according to my template, and they can draw buy and sell signals and output them to the second layer. The second layer is fixed, and the overall framework is solidified to ensure the stability and unity of the trading system. It is convenient to compare different or similar strategies under the same conditions. Finally, all trading signals are drawn on the chart, and the output strategy returns. test report.
The main function:
The first layer: "{Sextan} Your Indicator Source", the script provides a template for personalized strategy input, and the signal and definition interfaces ensure full compatibility with the second layer. Backtesting is performed stably in the backtesting framework of the layer. The first layer of this script is also relatively simple: enter your script in the highlighted custom script area, and after ensuring the final buy and sell signals long = bool condition, short = bool condition, the design of the first layer is considered complete. Input it into the PINE script editor of TradingView, save it and add it to the chart, you can see the pulse sequence in yellow (buy) and purple (sell) on the sub-picture, corresponding to the main picture, you can subjectively judge that the quality of the trading point of the strategy is good Bad.
The second layer: "{Sextan} PINEv4 Sextans Backtest Framework". This script is the standardized trading system strategy execution and alarm, used to generate the final report of the strategy backtest and some key indicators that I have customized that I find useful, such as: winning rate , Odds, Winning Surface, Kelly Ratio, Take Profit and Stop Loss Thresholds, Trading Frequency, etc. are evaluated according to the Kelly formula. To use the second layer, first load it into the TrainingView chart, no markers will appear on the chart, since you have not specified any strategy source signals, click on the gear-shaped setting next to the "{Sextan} PINEv4 Sextans BTFW" header button, you can open the backtest settings, the first item is to select your custom strategy source. Because we have added the strategy source to the chart in the previous step, you can easily find an option "{Sextan} Your Indicator Source: Signal" at the bottom of the list, this is the strategy source input we need, select and confirm , you can see various markers on the main graph, and quickly generate a backtesting profit graph and a list of backtesting reports. You can generate files and download the backtesting reports locally. You can also click the gear on the backtest chart interface to customize some conditions of the backtest, including: initial capital amount, currency type, percentage of each order placed, amount of pyramid additions, commission fees, slippage, etc. configuration. Note: The configuration in the interface dialog overrides the same configuration implemented by the code in the backtest script.
How to output charts:
The first layer: "{Sextan} Your Indicator Source", the output of this script is the pulse value of yellow and purple, yellow +1 means buy, purple -1 means sell.
The second layer: PINEv4 Sextans Backtest Framework". The output of this script is a bit complicated. After all, it is the entire trading system with a lot of information:
1. Blue and red arrows. The blue upward arrow indicates long position, the red downward arrow indicates short position, and the horizontal bar at the end of the purple arrow indicates take profit or stop loss exit.
2. Red and green lines. This is the holding cost line of the strategy, green represents the cost of holding a long position, and red represents the cost of holding a short position. The cost line is a continuous solid line and the price action is relatively close.
3. Green and yellow long take profit and stop loss area and green and yellow long take profit and stop loss fork. Once a long position is held, there is a conditional order for take profit and stop loss. The green horizontal line is the long take profit ratio line, and the yellow is the long stop loss ratio line; the green cross indicates the long take profit price, and the yellow cross indicates the long position. Stop loss price. It's worth noting that the prongs and wires don't necessarily go together. Because of the optimization of the algorithm, for a strong market, the take profit will occur after breaking the take profit line, and the profit will not be taken until the price falls.
4. The purple and red short take profit and stop loss area and the purple red short stop loss fork. Once a short position is held, there will be a take profit and stop loss conditional order, the red is the short take profit ratio line, and the purple is the short stop loss ratio line; the red cross indicates the short take profit price, and the purple cross indicates the short stop loss price.
5. In addition to the above signs, there are also text and numbers indicating the profit and loss values of long and short positions. "L" means long; "S" means short; "XL" means close long; "XS" means close short.
TradingView Strategy Tester Panel:
The overview graph is an intuitive graph that plots the blue (gain) and red (loss) curves of all backtest periods together, and notes: the absolute value and percentage of net profit, the number of all closed positions, the winning percentage, the profit factor, The maximum trading loss, the absolute value and ratio of the average trading profit and loss, and the average number of K-lines held in all trades.
Another is the performance summary. This is to display all long and short statistical indicators of backtesting in the form of a list, such as: net profit, gross profit, Sharpe ratio, maximum position, commission, times of profit and loss, etc.
Finally, the transaction list is a table indexed by the transaction serial number, showing the signal direction, date and time, price, profit and loss, accumulated profit and loss, maximum transaction profit, transaction loss and other values.
Remarks
Finally, I will explain that this is just the beginning of this model. I will continue to optimize the trading system of the second layer. Various optimization feedback and suggestions are welcome. For valuable feedback, I am willing to provide some L4/L5 technical indicators as rewards for free subscription rights.

[Sextan] KAMA BacktestLevel: 1
NOTE: This is ONLY an EXAMPLE on HOW-TO produce a customized "{Sextan} PINEv4 Sextans Backtest Framework" with intput signal source as my "{blackcat} L2 Perry Kaufman Adaptive MA (KAMA)" quickly and drawing on main chart. You can backtest many of my indicators in minutes now!
Of course,you can define your own indicator in the highlighted area in compliance with the uniform format, which guarantee when you use "Indicator on Indicator" function, it would not produce any error.
Background
Backtesting of technical indicators and strategies is the most common way to understand a quantitative strategy. However, the complicated configuration and adaptation work of backtesting many quantitative tools makes many traders who do not understand the code daunted. Moreover, although I have written a lot of strategies, I am still not very satisfied with the backtest configuration and writing efficiency. Therefore, I have been thinking about how to build a backtesting framework that can quickly and easily evaluate the backtesting performance of any indicator with a "long/short entry" indicator, that is, a "simple backtesting tool for dummies". The performance requirements should be stable, and the operation should be simple and convenient. It is best to "copy", "paste", and "a few mouse clicks" to complete the quick backtest and evaluation of a new indicator.
Luckily, I recently realized that TradingView provides an "Indicator on Indicator" feature, which is the perfect foundation for doing "hot swap" backtesting. My basic idea is to use a two-layer design. The first layer is the technical indicator signal source that needs to be embedded, which is only used to provide buy and sell signals of custom strategies; the second layer is the trading system, which is used to receive the output signals of the first layer, and filter the signals according to the agreed specifications. , Take Profit, Stop Loss, draw buy and sell signals and cost lines, define and send custom buy and sell alert messages to mobile phones, social software or trading interfaces. In general, this two-layer design is a flexible combination of "death and alive", which can meet the needs of most traders to quickly evaluate the performance of a certain technical indicator. The first layer here is flexible. Users can insert their own strategy codes according to my template, and they can draw buy and sell signals and output them to the second layer. The second layer is fixed, and the overall framework is solidified to ensure the stability and unity of the trading system. It is convenient to compare different or similar strategies under the same conditions. Finally, all trading signals are drawn on the chart, and the output strategy returns. test report.
The main function:
The first layer: "{Sextan} Your Indicator Source", the script provides a template for personalized strategy input, and the signal and definition interfaces ensure full compatibility with the second layer. Backtesting is performed stably in the backtesting framework of the layer. The first layer of this script is also relatively simple: enter your script in the highlighted custom script area, and after ensuring the final buy and sell signals long = bool condition, short = bool condition, the design of the first layer is considered complete. Input it into the PINE script editor of TradingView, save it and add it to the chart, you can see the pulse sequence in yellow (buy) and purple (sell) on the sub-picture, corresponding to the main picture, you can subjectively judge that the quality of the trading point of the strategy is good Bad.
The second layer: "{Sextan} PINEv4 Sextans Backtest Framework". This script is the standardized trading system strategy execution and alarm, used to generate the final report of the strategy backtest and some key indicators that I have customized that I find useful, such as: winning rate , Odds, Winning Surface, Kelly Ratio, Take Profit and Stop Loss Thresholds, Trading Frequency, etc. are evaluated according to the Kelly formula. To use the second layer, first load it into the TrainingView chart, no markers will appear on the chart, since you have not specified any strategy source signals, click on the gear-shaped setting next to the "{Sextan} PINEv4 Sextans BTFW" header button, you can open the backtest settings, the first item is to select your custom strategy source. Because we have added the strategy source to the chart in the previous step, you can easily find an option "{Sextan} Your Indicator Source: Signal" at the bottom of the list, this is the strategy source input we need, select and confirm , you can see various markers on the main graph, and quickly generate a backtesting profit graph and a list of backtesting reports. You can generate files and download the backtesting reports locally. You can also click the gear on the backtest chart interface to customize some conditions of the backtest, including: initial capital amount, currency type, percentage of each order placed, amount of pyramid additions, commission fees, slippage, etc. configuration. Note: The configuration in the interface dialog overrides the same configuration implemented by the code in the backtest script.
How to output charts:
The first layer: "{Sextan} Your Indicator Source", the output of this script is the pulse value of yellow and purple, yellow +1 means buy, purple -1 means sell.
The second layer: PINEv4 Sextans Backtest Framework". The output of this script is a bit complicated. After all, it is the entire trading system with a lot of information:
1. Blue and red arrows. The blue upward arrow indicates long position, the red downward arrow indicates short position, and the horizontal bar at the end of the purple arrow indicates take profit or stop loss exit.
2. Red and green lines. This is the holding cost line of the strategy, green represents the cost of holding a long position, and red represents the cost of holding a short position. The cost line is a continuous solid line and the price action is relatively close.
3. Green and yellow long take profit and stop loss area and green and yellow long take profit and stop loss fork. Once a long position is held, there is a conditional order for take profit and stop loss. The green horizontal line is the long take profit ratio line, and the yellow is the long stop loss ratio line; the green cross indicates the long take profit price, and the yellow cross indicates the long position. Stop loss price. It's worth noting that the prongs and wires don't necessarily go together. Because of the optimization of the algorithm, for a strong market, the take profit will occur after breaking the take profit line, and the profit will not be taken until the price falls.
4. The purple and red short take profit and stop loss area and the purple red short stop loss fork. Once a short position is held, there will be a take profit and stop loss conditional order, the red is the short take profit ratio line, and the purple is the short stop loss ratio line; the red cross indicates the short take profit price, and the purple cross indicates the short stop loss price.
5. In addition to the above signs, there are also text and numbers indicating the profit and loss values of long and short positions. "L" means long; "S" means short; "XL" means close long; "XS" means close short.
TradingView Strategy Tester Panel:
The overview graph is an intuitive graph that plots the blue (gain) and red (loss) curves of all backtest periods together, and notes: the absolute value and percentage of net profit, the number of all closed positions, the winning percentage, the profit factor, The maximum trading loss, the absolute value and ratio of the average trading profit and loss, and the average number of K-lines held in all trades.
Another is the performance summary. This is to display all long and short statistical indicators of backtesting in the form of a list, such as: net profit, gross profit, Sharpe ratio, maximum position, commission, times of profit and loss, etc.
Finally, the transaction list is a table indexed by the transaction serial number, showing the signal direction, date and time, price, profit and loss, accumulated profit and loss, maximum transaction profit, transaction loss and other values.
Remarks
Finally, I will explain that this is just the beginning of this model. I will continue to optimize the trading system of the second layer. Various optimization feedback and suggestions are welcome. For valuable feedback, I am willing to provide some L4/L5 technical indicators as rewards for free subscription rights.

[Sextan] Backtesting with L2 Reversal Labels as an input sourceLevel: 1
NOTE: This is ONLY an EXAMPLE on HOW-TO produce a customized "{Sextan} PINEv4 Sextans Backtest Framework" intput signal with "(blackcat) L2 Reversal Labels", and you can define your own indicator in the highlighted area in compliance with the uniform format, which guarantee when you use "Indicator on Indicator" function, it would not produce any error.
I use two simple moving average crossings to produce long and short entry signal with SMA3 and SMA8 in the example.
Background
Backtesting of technical indicators and strategies is the most common way to understand a quantitative strategy. However, the complicated configuration and adaptation work of backtesting many quantitative tools makes many traders who do not understand the code daunted. Moreover, although I have written a lot of strategies, I am still not very satisfied with the backtest configuration and writing efficiency. Therefore, I have been thinking about how to build a backtesting framework that can quickly and easily evaluate the backtesting performance of any indicator with a "long/short entry" indicator, that is, a "simple backtesting tool for dummies". The performance requirements should be stable, and the operation should be simple and convenient. It is best to "copy", "paste", and "a few mouse clicks" to complete the quick backtest and evaluation of a new indicator.
Luckily, I recently realized that TradingView provides an "Indicator on Indicator" feature, which is the perfect foundation for doing "hot swap" backtesting. My basic idea is to use a two-layer design. The first layer is the technical indicator signal source that needs to be embedded, which is only used to provide buy and sell signals of custom strategies; the second layer is the trading system, which is used to receive the output signals of the first layer, and filter the signals according to the agreed specifications. , Take Profit, Stop Loss, draw buy and sell signals and cost lines, define and send custom buy and sell alert messages to mobile phones, social software or trading interfaces. In general, this two-layer design is a flexible combination of "death and alive", which can meet the needs of most traders to quickly evaluate the performance of a certain technical indicator. The first layer here is flexible. Users can insert their own strategy codes according to my template, and they can draw buy and sell signals and output them to the second layer. The second layer is fixed, and the overall framework is solidified to ensure the stability and unity of the trading system. It is convenient to compare different or similar strategies under the same conditions. Finally, all trading signals are drawn on the chart, and the output strategy returns. test report.
The main function:
The first layer: "{Sextan} Your Indicator Source", the script provides a template for personalized strategy input, and the signal and definition interfaces ensure full compatibility with the second layer. Backtesting is performed stably in the backtesting framework of the layer. The first layer of this script is also relatively simple: enter your script in the highlighted custom script area, and after ensuring the final buy and sell signals long = bool condition, short = bool condition, the design of the first layer is considered complete. Input it into the PINE script editor of TradingView, save it and add it to the chart, you can see the pulse sequence in yellow (buy) and purple (sell) on the sub-picture, corresponding to the main picture, you can subjectively judge that the quality of the trading point of the strategy is good Bad.
The second layer: "{Sextan} PINEv4 Sextans Backtest Framework". This script is the standardized trading system strategy execution and alarm, used to generate the final report of the strategy backtest and some key indicators that I have customized that I find useful, such as: winning rate , Odds, Winning Surface, Kelly Ratio, Take Profit and Stop Loss Thresholds, Trading Frequency, etc. are evaluated according to the Kelly formula. To use the second layer, first load it into the TrainingView chart, no markers will appear on the chart, since you have not specified any strategy source signals, click on the gear-shaped setting next to the "{Sextan} PINEv4 Sextans BTFW" header button, you can open the backtest settings, the first item is to select your custom strategy source. Because we have added the strategy source to the chart in the previous step, you can easily find an option "{Sextan} Your Indicator Source: Signal" at the bottom of the list, this is the strategy source input we need, select and confirm , you can see various markers on the main graph, and quickly generate a backtesting profit graph and a list of backtesting reports. You can generate files and download the backtesting reports locally. You can also click the gear on the backtest chart interface to customize some conditions of the backtest, including: initial capital amount, currency type, percentage of each order placed, amount of pyramid additions, commission fees, slippage, etc. configuration. Note: The configuration in the interface dialog overrides the same configuration implemented by the code in the backtest script.
How to output charts:
The first layer: "{Sextan} Your Indicator Source", the output of this script is the pulse value of yellow and purple, yellow +1 means buy, purple -1 means sell.
The second layer: PINEv4 Sextans Backtest Framework". The output of this script is a bit complicated. After all, it is the entire trading system with a lot of information:
1. Blue and red arrows. The blue upward arrow indicates long position, the red downward arrow indicates short position, and the horizontal bar at the end of the purple arrow indicates take profit or stop loss exit.
2. Red and green lines. This is the holding cost line of the strategy, green represents the cost of holding a long position, and red represents the cost of holding a short position. The cost line is a continuous solid line and the price action is relatively close.
3. Green and yellow long take profit and stop loss area and green and yellow long take profit and stop loss fork. Once a long position is held, there is a conditional order for take profit and stop loss. The green horizontal line is the long take profit ratio line, and the yellow is the long stop loss ratio line; the green cross indicates the long take profit price, and the yellow cross indicates the long position. Stop loss price. It's worth noting that the prongs and wires don't necessarily go together. Because of the optimization of the algorithm, for a strong market, the take profit will occur after breaking the take profit line, and the profit will not be taken until the price falls.
4. The purple and red short take profit and stop loss area and the purple red short stop loss fork. Once a short position is held, there will be a take profit and stop loss conditional order, the red is the short take profit ratio line, and the purple is the short stop loss ratio line; the red cross indicates the short take profit price, and the purple cross indicates the short stop loss price.
5. In addition to the above signs, there are also text and numbers indicating the profit and loss values of long and short positions. "L" means long; "S" means short; "XL" means close long; "XS" means close short.
TradingView Strategy Tester Panel:
The overview graph is an intuitive graph that plots the blue (gain) and red (loss) curves of all backtest periods together, and notes: the absolute value and percentage of net profit, the number of all closed positions, the winning percentage, the profit factor, The maximum trading loss, the absolute value and ratio of the average trading profit and loss, and the average number of K-lines held in all trades.
Another is the performance summary. This is to display all long and short statistical indicators of backtesting in the form of a list, such as: net profit, gross profit, Sharpe ratio, maximum position, commission, times of profit and loss, etc.
Finally, the transaction list is a table indexed by the transaction serial number, showing the signal direction, date and time, price, profit and loss, accumulated profit and loss, maximum transaction profit, transaction loss and other values.
Remarks
Finally, I will explain that this is just the beginning of this model. I will continue to optimize the trading system of the second layer. Various optimization feedback and suggestions are welcome. For valuable feedback, I am willing to provide some L4/L5 technical indicators as rewards for free subscription rights.

[Sextan] Your Indicator SourceLevel: 1
NOTE: This is ONLY an EXAMPLE on HOW-TO produce a customized "{Sextan} PINEv4 Sextans Backtest Framework" intput signal source, you can define your own indicator in the highlighted area in compliance with the uniform format, which guarantee when you use "Indicator on Indicator" function, it would not produce any error.
I use two simple moving average crossings to produce long and short entry signal with SMA3 and SMA8 in the example.
Background
Backtesting of technical indicators and strategies is the most common way to understand a quantitative strategy. However, the complicated configuration and adaptation work of backtesting many quantitative tools makes many traders who do not understand the code daunted. Moreover, although I have written a lot of strategies, I am still not very satisfied with the backtest configuration and writing efficiency. Therefore, I have been thinking about how to build a backtesting framework that can quickly and easily evaluate the backtesting performance of any indicator with a "long/short entry" indicator, that is, a "simple backtesting tool for dummies". The performance requirements should be stable, and the operation should be simple and convenient. It is best to "copy", "paste", and "a few mouse clicks" to complete the quick backtest and evaluation of a new indicator.
Luckily, I recently realized that TradingView provides an "Indicator on Indicator" feature, which is the perfect foundation for doing "hot swap" backtesting. My basic idea is to use a two-layer design. The first layer is the technical indicator signal source that needs to be embedded, which is only used to provide buy and sell signals of custom strategies; the second layer is the trading system, which is used to receive the output signals of the first layer, and filter the signals according to the agreed specifications. , Take Profit, Stop Loss, draw buy and sell signals and cost lines, define and send custom buy and sell alert messages to mobile phones, social software or trading interfaces. In general, this two-layer design is a flexible combination of "death and alive", which can meet the needs of most traders to quickly evaluate the performance of a certain technical indicator. The first layer here is flexible. Users can insert their own strategy codes according to my template, and they can draw buy and sell signals and output them to the second layer. The second layer is fixed, and the overall framework is solidified to ensure the stability and unity of the trading system. It is convenient to compare different or similar strategies under the same conditions. Finally, all trading signals are drawn on the chart, and the output strategy returns. test report.
The main function:
The first layer: "{Sextan} Your Indicator Source", the script provides a template for personalized strategy input, and the signal and definition interfaces ensure full compatibility with the second layer. Backtesting is performed stably in the backtesting framework of the layer. The first layer of this script is also relatively simple: enter your script in the highlighted custom script area, and after ensuring the final buy and sell signals long = bool condition, short = bool condition, the design of the first layer is considered complete. Input it into the PINE script editor of TradingView, save it and add it to the chart, you can see the pulse sequence in yellow (buy) and purple (sell) on the sub-picture, corresponding to the main picture, you can subjectively judge that the quality of the trading point of the strategy is good Bad.
The second layer: "{Sextan} PINEv4 Sextans Backtest Framework". This script is the standardized trading system strategy execution and alarm, used to generate the final report of the strategy backtest and some key indicators that I have customized that I find useful, such as: winning rate , Odds, Winning Surface, Kelly Ratio, Take Profit and Stop Loss Thresholds, Trading Frequency, etc. are evaluated according to the Kelly formula. To use the second layer, first load it into the TrainingView chart, no markers will appear on the chart, since you have not specified any strategy source signals, click on the gear-shaped setting next to the "{Sextan} PINEv4 Sextans BTFW" header button, you can open the backtest settings, the first item is to select your custom strategy source. Because we have added the strategy source to the chart in the previous step, you can easily find an option "{Sextan} Your Indicator Source: Signal" at the bottom of the list, this is the strategy source input we need, select and confirm , you can see various markers on the main graph, and quickly generate a backtesting profit graph and a list of backtesting reports. You can generate files and download the backtesting reports locally. You can also click the gear on the backtest chart interface to customize some conditions of the backtest, including: initial capital amount, currency type, percentage of each order placed, amount of pyramid additions, commission fees, slippage, etc. configuration. Note: The configuration in the interface dialog overrides the same configuration implemented by the code in the backtest script.
How to output charts:
The first layer: "{Sextan} Your Indicator Source", the output of this script is the pulse value of yellow and purple, yellow +1 means buy, purple -1 means sell.
The second layer: PINEv4 Sextans Backtest Framework". The output of this script is a bit complicated. After all, it is the entire trading system with a lot of information:
1. Blue and red arrows. The blue upward arrow indicates long position, the red downward arrow indicates short position, and the horizontal bar at the end of the purple arrow indicates take profit or stop loss exit.
2. Red and green lines. This is the holding cost line of the strategy, green represents the cost of holding a long position, and red represents the cost of holding a short position. The cost line is a continuous solid line and the price action is relatively close.
3. Green and yellow long take profit and stop loss area and green and yellow long take profit and stop loss fork. Once a long position is held, there is a conditional order for take profit and stop loss. The green horizontal line is the long take profit ratio line, and the yellow is the long stop loss ratio line; the green cross indicates the long take profit price, and the yellow cross indicates the long position. Stop loss price. It's worth noting that the prongs and wires don't necessarily go together. Because of the optimization of the algorithm, for a strong market, the take profit will occur after breaking the take profit line, and the profit will not be taken until the price falls.
4. The purple and red short take profit and stop loss area and the purple red short stop loss fork. Once a short position is held, there will be a take profit and stop loss conditional order, the red is the short take profit ratio line, and the purple is the short stop loss ratio line; the red cross indicates the short take profit price, and the purple cross indicates the short stop loss price.
5. In addition to the above signs, there are also text and numbers indicating the profit and loss values of long and short positions. "L" means long; "S" means short; "XL" means close long; "XS" means close short.
TradingView Strategy Tester Panel:
The overview graph is an intuitive graph that plots the blue (gain) and red (loss) curves of all backtest periods together, and notes: the absolute value and percentage of net profit, the number of all closed positions, the winning percentage, the profit factor, The maximum trading loss, the absolute value and ratio of the average trading profit and loss, and the average number of K-lines held in all trades.
Another is the performance summary. This is to display all long and short statistical indicators of backtesting in the form of a list, such as: net profit, gross profit, Sharpe ratio, maximum position, commission, times of profit and loss, etc.
Finally, the transaction list is a table indexed by the transaction serial number, showing the signal direction, date and time, price, profit and loss, accumulated profit and loss, maximum transaction profit, transaction loss and other values.
Remarks
Finally, I will explain that this is just the beginning of this model. I will continue to optimize the trading system of the second layer. Various optimization feedback and suggestions are welcome. For valuable feedback, I am willing to provide some L4/L5 technical indicators as rewards for free subscription rights.

[Sextan] PINEv4 Sextans Backtest FrameworkLevel: 5
Background
Backtesting of technical indicators and strategies is the most common way to understand a quantitative strategy. However, the complicated configuration and adaptation work of backtesting many quantitative tools makes many traders who do not understand the code daunted. Moreover, although I have written a lot of strategies,
However, I am still not very satisfied with the backtest configuration and writing efficiency. Therefore, I have been thinking about how to build a backtesting framework that can quickly and easily evaluate the backtesting performance of any indicator with a "long/short entry" indicator, that is, a "simple backtesting tool for dummies". The performance requirements should be stable, and the operation should be simple and convenient. It is best to "copy", "paste", and "a few mouse clicks" to complete the quick backtest and evaluation of a new indicator.
Luckily, I recently realized that TradingView provides an "Indicator on Indicator" feature, which is the perfect foundation for doing "hot swap" backtesting. My basic idea is to use a two-layer design. The first layer is the technical indicator signal source that needs to be embedded, which is only used to provide buy and sell signals of custom strategies; the second layer is the trading system, which is used to receive the output signals of the first layer, and filter the signals according to the agreed specifications. , Take Profit, Stop Loss, draw buy and sell signals and cost lines, define and send custom buy and sell alert messages to mobile phones, social software or trading interfaces. In general, this two-layer design is a flexible combination of "fixed and flexiable", which can meet the needs of most traders to quickly evaluate the performance of a certain technical indicator. The first layer here is flexible. Users can insert their own strategy codes according to my template, and they can draw buy and sell signals and output them to the second layer. The second layer is fixed, and the overall framework is solidified to ensure the stability and unity of the trading system. It is convenient to compare different or similar strategies under the same conditions. Finally, all trading signals are drawn on the chart, and the output strategy returns. test report.
The main function:
The first layer: "{Sextan} Your Indicator Source", the script provides a template for personalized strategy input, and the signal and definition interfaces ensure full compatibility with the second layer. Backtesting is performed stably in the backtesting framework of the layer. The first layer of this script is also relatively simple: enter your script in the highlighted custom script area, and after ensuring the final buy and sell signals long = bool condition, short = bool condition, the design of the first layer is considered complete. Input it into the PINE script editor of TradingView, save it and add it to the chart, you can see the pulse sequence in yellow (buy) and purple (sell) on the sub-picture, corresponding to the main picture, you can subjectively judge that the quality of the trading point of the strategy is good Bad.
The second layer: "{Sextan} PINEv4 Sextans Backtest Framework". This script is the standardized trading system strategy execution and alarm, used to generate the final report of the strategy backtest and some key indicators that I have customized that I find useful, such as: winning rate , Odds, Winning Surface, Kelly Ratio, Take Profit and Stop Loss Thresholds, Trading Frequency, etc. are evaluated according to the Kelly formula. To use the second layer, first load it into the TrainingView chart, no markers will appear on the chart, since you have not specified any strategy source signals, click on the gear-shaped setting next to the "{Sextan} PINEv4 Sextans BTFW" header button, you can open the backtest settings, the first item is to select your custom strategy source. Because we have added the strategy source to the chart in the previous step, you can easily find an option "{Sextan} Your Indicator Source: Signal" at the bottom of the list, this is the strategy source input we need, select and confirm , you can see various markers on the main graph, and quickly generate a backtesting profit graph and a list of backtesting reports. You can generate files and download the backtesting reports locally. You can also click the gear on the backtest chart interface to customize some conditions of the backtest, including: initial capital amount, currency type, percentage of each order placed, amount of pyramid additions, commission fees, slippage, etc. configuration. Note: The configuration in the interface dialog overrides the same configuration implemented by the code in the backtest script.
How to output charts:
The first layer: "{Sextan} Your Indicator Source", the output of this script is the pulse value of yellow and purple, yellow +1 means buy, purple -1 means sell.
The second layer: PINEv4 Sextans Backtest Framework". The output of this script is a bit complicated. After all, it is the entire trading system with a lot of information:
1. Blue and red arrows. The blue upward arrow indicates long position, the red downward arrow indicates short position, and the horizontal bar at the end of the purple arrow indicates take profit or stop loss exit.
2. Red and green lines. This is the holding cost line of the strategy, green represents the cost of holding a long position, and red represents the cost of holding a short position. The cost line is a continuous solid line and the price action is relatively close.
3. Green and yellow long take profit and stop loss area and green and yellow long take profit and stop loss fork. Once a long position is held, there is a conditional order for take profit and stop loss. The green horizontal line is the long take profit ratio line, and the yellow is the long stop loss ratio line; the green cross indicates the long take profit price, and the yellow cross indicates the long position. Stop loss price. It's worth noting that the prongs and wires don't necessarily go together. Because of the optimization of the algorithm, for a strong market, the take profit will occur after breaking the take profit line, and the profit will not be taken until the price falls.
4. The purple and red short take profit and stop loss area and the purple red short stop loss fork. Once a short position is held, there will be a take profit and stop loss conditional order, the red is the short take profit ratio line, and the purple is the short stop loss ratio line; the red cross indicates the short take profit price, and the purple cross indicates the short stop loss price.
5. In addition to the above signs, there are also text and numbers indicating the profit and loss values of long and short positions. "L" means long; "S" means short; "XL" means close long; "XS" means close short.
TradingView Strategy Tester Panel:
The overview graph is an intuitive graph that plots the blue (gain) and red (loss) curves of all backtest periods together, and notes: the absolute value and percentage of net profit, the number of all closed positions, the winning percentage, the profit factor, The maximum trading loss, the absolute value and ratio of the average trading profit and loss, and the average number of K-lines held in all trades.
Another is the performance summary. This is to display all long and short statistical indicators of backtesting in the form of a list, such as: net profit, gross profit, Sharpe ratio, maximum position, commission, times of profit and loss, etc.
Finally, the transaction list is a table indexed by the transaction serial number, showing the signal direction, date and time, price, profit and loss, accumulated profit and loss, maximum transaction profit, transaction loss and other values.
Remarks
Finally, I will explain that this is just the beginning of this model. I will continue to optimize the trading system of the second layer. Various optimization feedback and suggestions are welcome. For valuable feedback, I am willing to provide some L4/L5 technical indicators as rewards for free subscription rights.
Subscription
To encourage more people use this framework and avoid some abuse this one, I would like to set
100 Tradingview Coins per Monthly Subscription.
100X10 Tradingview Coins per Yearly Subscription.

[blackcat] L1 Fibonacci CounterLevel: 1
Background
I believe that many traders must be familiar with the Fibonacci sequence. In live trading, we also use the Fibonacci sequence to predict the probability of a change in direction at an important stage of the market. , In the market analysis method, the Fibonacci sequence appears frequently.
Function
Drawing Fibonacci cycles manually is usually more labor-intensive. Here I tentatively implement a technical indicator that automatically draws Fibonacci time windows. It can automatically locate the high and low points of historical prices, and count them. When the period displayed by the counter is a Fibonacci number, it will be highlighted with a yellow background color and marked with the Fibonacci number. value.
Inputs
Counter Max Lookback --> Default 987.
Key Signal
Red bgcolor --> historical high with Fib hits
Green bgcolor --> historical low with Fib hits
Remarks
This is a Level 1 free and open source indicator.
Feedbacks are appreciated.
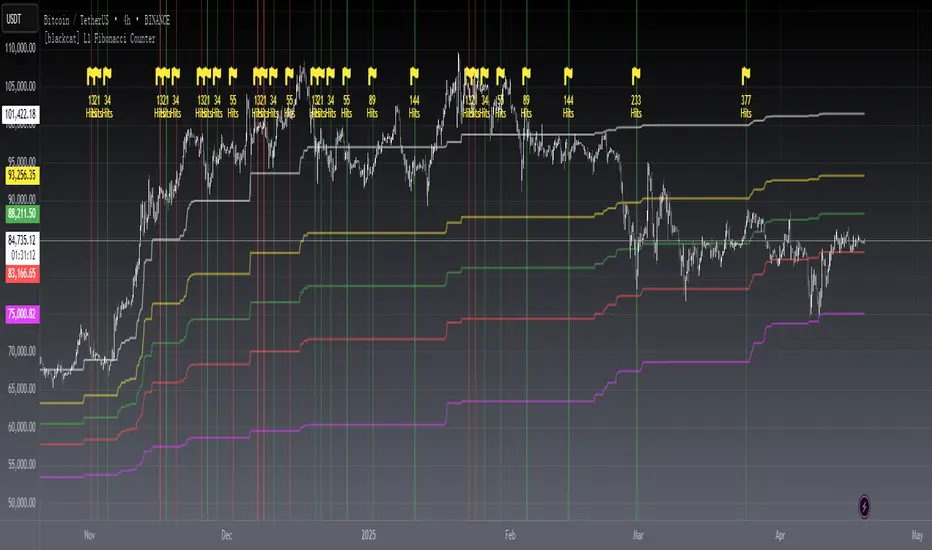
[blackcat] L3 Whale SniperLevel: 3
Background
This indicator is my attempt to sniper whale fund in short-mid time frame.
Function
The major part of this indicator is a novel trend oscillator which can use to detected oversold and overbought. With this kind of feature, a whale sniper model can be built for the condtion is after a panic rolling off of price into oversold zone, a sniper zone may happen in advance of whale fund. The yellow color zone is the whale sniper zone indicator, along with a standard long position set up zone with lime color background color. NOTE: when yellow and lime color overlay which indicates a resonance happens. This is a kind of signal with higher confidence level of buy!
Inputs
Sinper Factor --> Default 5.
Key Signal
Trend --> trend oscillator output
Trend(1) --> trigger sgnal for trend ocillator
Yellow bgcolor --> whale sniper zone
Lime bgcolor --> standard long oppotunity zone
Remarks
This is a Level 3 free and open source indicator.
Feedbacks are appreciated.
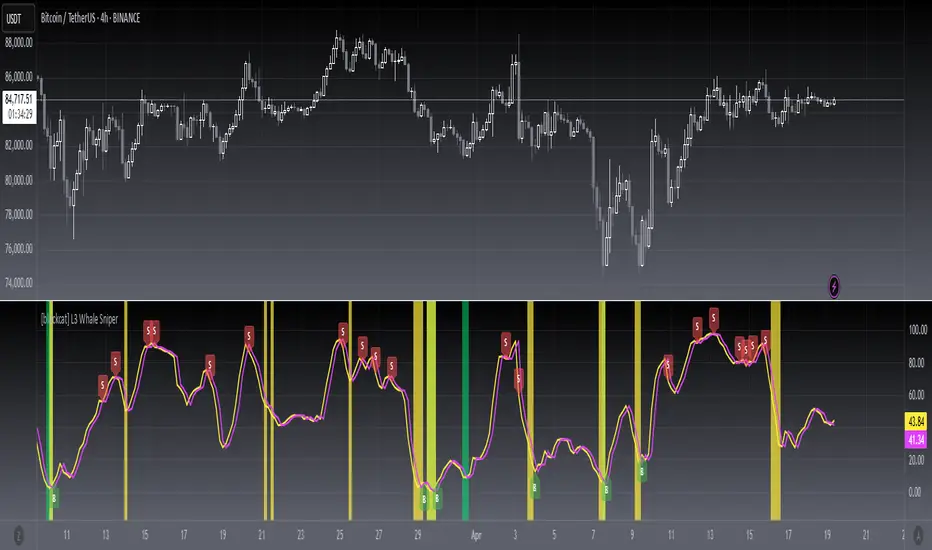
[blackcat] L5 Price Positioning Index StrategyLevel: 5
Background
Are you tired of traditional Japanese candlesticks? Do you want to try a new type of candle master chart? This is my private L5 version, which introduces "Market Season Bands" for oversold and overbought status, historical resistance and support arrows in dynamic forms, inherent pyramiding for buy and sell.
Function
L3 Price Positioning Index is totally brand-new candle chart invented by myself. This main chart can provide effective resistance and support levels, and you can see where the price is running at any time. There are 3 key color bands. Blue-Green gredient band is used to indicate oversold support or breakthrough support levels; the color is blue means extreme oversold, green means oversold you can ignore. This band indicates the season of market entering "Winter". The Green-Orange band indicates the midline position where prices may pause; the green color here means bear middle while orange color here means bull middle. Accordingly, middle band color indicates market season entering "Spring or Autumn" . Finally, Pink-Red band indicates overbought resistance or breakthrough resistance levels; the pink color means market season is NOT bullish while the red color indicates it is a good market season to long. top band color indicates the market season entering "Summer". Enjoy your "Summer" with profit!
There are two types of candlestick charts.
The first type candles are mid-to-long-term trend candles, navy represents an uptrend and the length of the candle represents a change in intensity; maroon represents a downward trend and the length of the candle represents a change in intensity. You can find principle in L5 Price Positioning Index code. In L5 version, to simplif the visual effect, the display is hidden. This trend candle is the effective support and resistance level of the second type short-term swing candle.
The second type candles are short-term candles fluctuate around the first medium- and long-term trend candles. The second short-term candle is divided into five colors: green means pump; red means retracement in the ascending process; blue and yellow means bearish rebounce and trend reversal signal; white means dump; blue means price rebound in the descending process. I describe these in raindrop or snow-drop form, which can be quite familar for you to imagine the temperature of the market :).
Key Signal
THREE KEY LINES:
htop --> Pink-Red band, "Market in Summer", overbought resistance or pump breakout threshold
hmid --> Green-Orange band, "Market in Spring or Autumn", price pause zone, sideways may happen here
hbot --> Blue-Green gredient band, "Market in Winter", oversold support or dump breakout threshold
MID-LONG TERM CANDLES:
colorful trend line , it is an important support or resistance for short term price movements and the bull-bear boundary for market seasons.
SHORT TERM CANDLES:
1. bear rebounance --> rebounce in down trend candle with blue color
2. pump --> up trend pump candle with green color
3. trend reversal --> trend reversal candle with yellow color
4. dump --> bearish dump candle with white color
5. bull retracement --> retracement in up trend candle with red
Pros and Cons
Pros:
1. Long term trend identification by three lines for overbought, oversold and breakouts
2. Mid term trend support and resistance with a colorful boundary
3. Short term price behaviors are classified into 5 types of candles in blue, green, yellow, red and white
Cons:
I invent this to solve traditional JP candlestick shortcomings. If you find anything on Cons, just feedback to me for improvements.
Remarks
1. This is the strategy version of L5 Price Positioning Index
2. Closed-source, Invite-only, NOT free. (Free version is available by search "L3 Price Positioning Index")
3. Highl recommended to use this indicator for >= 4H timeframe, which means this is powerful for swing trading.
4. IMPORTANT!!! To have superior visual effect, you need to enter "Chart Setting" --> "Symbol" --> TURN OFF "Body", "Borders" and "Wick" of traditional JP candles.
Subscription
Permission will be automatically granted for who subscribed " L5 Price Positioning Index for Market Seasons"
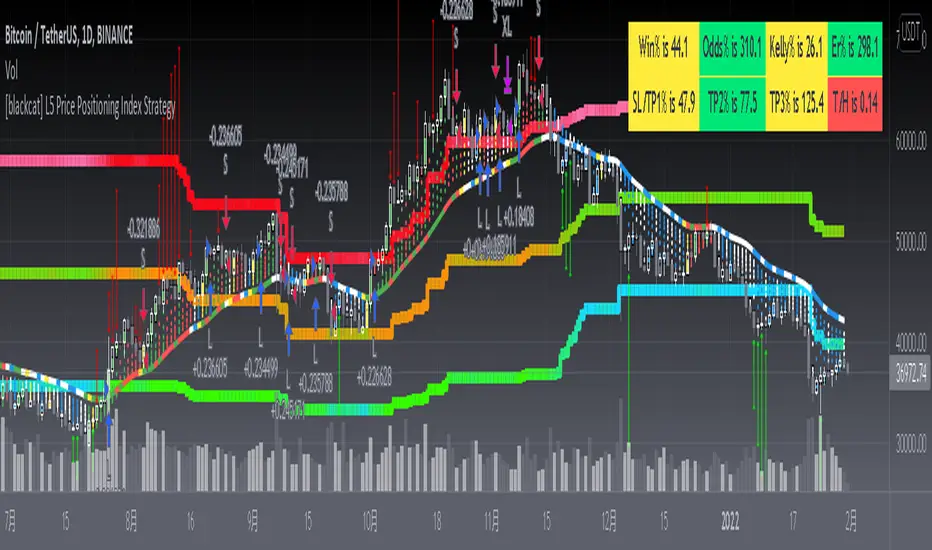
[blackcat] L5 Price Positioning Index for Market SeasonsLevel: 5
Background
Are you tired of traditional Japanese candlesticks? Do you want to try a new type of candle master chart? This is my private L5 version, which introduces "Market Season Bands" for oversold and overbought status, historical resistance and support arrows in dynamic forms, inherent pyramiding for buy and sell.
Function
L3 Price Positioning Index is totally brand-new candle chart invented by myself. This main chart can provide effective resistance and support levels, and you can see where the price is running at any time. There are 3 key color bands. Blue-Green gredient band is used to indicate oversold support or breakthrough support levels; the color is blue means extreme oversold, green means oversold you can ignore. This band indicates the season of market entering "Winter". The Green-Orange band indicates the midline position where prices may pause; the green color here means bear middle while orange color here means bull middle. Accordingly, middle band color indicates market season entering "Spring or Autumn" . Finally, Pink-Red band indicates overbought resistance or breakthrough resistance levels; the pink color means market season is NOT bullish while the red color indicates it is a good market season to long. top band color indicates the market season entering "Summer". Enjoy your "Summer" with profit!
There are two types of candlestick charts.
The first type candles are mid-to-long-term trend candles, navy represents an uptrend and the length of the candle represents a change in intensity; maroon represents a downward trend and the length of the candle represents a change in intensity. You can find principle in L5 Price Positioning Index code. In L5 version, to simplif the visual effect, the display is hidden. This trend candle is the effective support and resistance level of the second type short-term swing candle.
The second type candles are short-term candles fluctuate around the first medium- and long-term trend candles. The second short-term candle is divided into five colors: green means pump; red means retracement in the ascending process; blue and yellow means bearish rebounce and trend reversal signal; white means dump; blue means price rebound in the descending process. I describe these in raindrop or snow-drop form, which can be quite familar for you to imagine the temperature of the market :).
Key Signal
THREE KEY LINES:
htop --> Pink-Red band, "Market in Summer", overbought resistance or pump breakout threshold
hmid --> Green-Orange band, "Market in Spring or Autumn", price pause zone, sideways may happen here
hbot --> Blue-Green gredient band, "Market in Winter", oversold support or dump breakout threshold
MID-LONG TERM CANDLES:
colorful trend line, it is an important support or resistance for short term price movements and the bull-bear boundary for market seasons.
SHORT TERM CANDLES:
1. bear rebounance --> rebounce in down trend candle with blue color
2. pump --> up trend pump candle with green color
3. trend reversal --> trend reversal candle with yellow color
4. dump --> bearish dump candle with white color
5. bull retracement --> retracement in up trend candle with red
Pros and Cons
Pros:
1. Long term trend identification by three lines for overbought, oversold and breakouts
2. Mid term trend support and resistance with a colorful boundary
3. Short term price behaviors are classified into 5 types of candles in blue, green, yellow, red and white
Cons:
I invent this to solve traditional JP candlestick shortcomings. If you find anything on Cons, just feedback to me for improvements.
Remarks
1. Closed-source, Invite-only, NOT free. (Free version is available by search "L3 Price Positioning Index")
2. Highl recommended to use this indicator for >= 4H timeframe, which means this is powerful for swing trading.
3. IMPORTANT!!! To have superior visual effect, you need to enter "Chart Setting" --> "Symbol" --> TURN OFF "Body", "Borders" and "Wick" of traditional JP candles.
Subscription
500 Tradingview Coins per Monthly Sub.
500X10 Tradingview Coins per Yearly Sub.

[blackcat] L2 Intraday R-Breaker IndicatorLevel: 2
Background
The famous R-Breaker is a short-term intraday trading strategy that combines trend and reversal trading methods.
Function
-1) When the intraday highest price exceeds the observed selling price, and the intraday price drops and further breaks below the support line constituted by the reverse selling price, a reversal strategy is adopted, that is, at this point (backhand, open position) ) Short;
-2) When the intraday lowest price is lower than the observed purchase price, and the intraday price rebounds and further exceeds the resistance line constituted by the reverse purchase price, a reversal strategy is adopted, that is, at this point (backhand, open position) ) Long;
-3) In the case of a short position, if the intraday price exceeds the breakthrough buying price, a trend strategy is adopted, that is, open a long position at that point;
-4) In the case of a short position, if the intraday price breaks below the selling price, a trend strategy is adopted, that is, open a short position at that point.
Key Signal
pivot --> pivot pionts
reverse_sell_price --> pivot points,reverse selling prices: senter
observe_sell_price --> bserve selling price: ssetup
break_bid_price --> breakthrough bid price: bbreak1
reversal_bid_price --> reversal bid price: bbreak2
observe_buy_price --> observe buy price: bsetup
break_sell_price --> break sell price: sbreak
Remarks
This is a Level 2 free and open source indicator.
Feedbacks are appreciated.

pandas_taLibrary "pandas_ta"
Level: 3
Background
Today is the first day of 2022 and happy new year every tradingviewers! May health and wealth go along with you all the time. I use this chance to publish my 1st PINE v5 lib : pandas_ta
This is not a piece of cake like thing, which cost me a lot of time and efforts to build this lib. Beyond 300 versions of this script was iterated in draft.
Function
Library "pandas_ta"
PINE v5 Counterpart of Pandas TA - A Technical Analysis Library in Python 3 at github.com
The Original Pandas Technical Analysis (Pandas TA) is an easy to use library that leverages the Pandas package with more than 130 Indicators and Utility functions and more than 60 TA Lib Candlestick Patterns.
I realized most of indicators except Candlestick Patterns because tradingview built-in Candlestick Patterns are even more powerful!
I use this to verify pandas_ta python version indicators for myself, but I realize that maybe many may need similar lib for pine v5 as well.
Function Brief Descriptions (Pls find details in script comments)
bton --> Binary to number
wcp --> Weighted Closing Price (WCP)
counter --> Condition counter
xbt --> Between
ebsw --> Even Better SineWave (EBSW)
ao --> Awesome Oscillator (AO)
apo --> Absolute Price Oscillator (APO)
xrf --> Dynamic shifted values
bias --> Bias (BIAS)
bop --> Balance of Power (BOP)
brar --> BRAR (BRAR)
cci --> Commodity Channel Index (CCI)
cfo --> Chande Forcast Oscillator (CFO)
cg --> Center of Gravity (CG)
cmo --> Chande Momentum Oscillator (CMO)
coppock --> Coppock Curve (COPC)
cti --> Correlation Trend Indicator (CTI)
dmi --> Directional Movement Index(DMI)
er --> Efficiency Ratio (ER)
eri --> Elder Ray Index (ERI)
fisher --> Fisher Transform (FISHT)
inertia --> Inertia (INERTIA)
kdj --> KDJ (KDJ)
kst --> 'Know Sure Thing' (KST)
macd --> Moving Average Convergence Divergence (MACD)
mom --> Momentum (MOM)
pgo --> Pretty Good Oscillator (PGO)
ppo --> Percentage Price Oscillator (PPO)
psl --> Psychological Line (PSL)
pvo --> Percentage Volume Oscillator (PVO)
qqe --> Quantitative Qualitative Estimation (QQE)
roc --> Rate of Change (ROC)
rsi --> Relative Strength Index (RSI)
rsx --> Relative Strength Xtra (rsx)
rvgi --> Relative Vigor Index (RVGI)
slope --> Slope
smi --> SMI Ergodic Indicator (SMI)
sqz* --> Squeeze (SQZ) * NOTE: code sufferred from very strange error, code was commented.
sqz_pro --> Squeeze PRO(SQZPRO)
xfl --> Condition filter
stc --> Schaff Trend Cycle (STC)
stoch --> Stochastic (STOCH)
stochrsi --> Stochastic RSI (STOCH RSI)
trix --> Trix (TRIX)
tsi --> True Strength Index (TSI)
uo --> Ultimate Oscillator (UO)
willr --> William's Percent R (WILLR)
alma --> Arnaud Legoux Moving Average (ALMA)
xll --> Dynamic rolling lowest values
dema --> Double Exponential Moving Average (DEMA)
ema --> Exponential Moving Average (EMA)
fwma --> Fibonacci's Weighted Moving Average (FWMA)
hilo --> Gann HiLo Activator(HiLo)
hma --> Hull Moving Average (HMA)
hwma --> HWMA (Holt-Winter Moving Average)
ichimoku --> Ichimoku Kinkō Hyō (ichimoku)
jma --> Jurik Moving Average Average (JMA)
kama --> Kaufman's Adaptive Moving Average (KAMA)
linreg --> Linear Regression Moving Average (linreg)
mgcd --> McGinley Dynamic Indicator
rma --> wildeR's Moving Average (RMA)
sinwma --> Sine Weighted Moving Average (SWMA)
ssf --> Ehler's Super Smoother Filter (SSF) © 2013
supertrend --> Supertrend (supertrend)
xsa --> X simple moving average
swma --> Symmetric Weighted Moving Average (SWMA)
t3 --> Tim Tillson's T3 Moving Average (T3)
tema --> Triple Exponential Moving Average (TEMA)
trima --> Triangular Moving Average (TRIMA)
vidya --> Variable Index Dynamic Average (VIDYA)
vwap --> Volume Weighted Average Price (VWAP)
vwma --> Volume Weighted Moving Average (VWMA)
wma --> Weighted Moving Average (WMA)
zlma --> Zero Lag Moving Average (ZLMA)
entropy --> Entropy (ENTP)
kurtosis --> Rolling Kurtosis
skew --> Rolling Skew
xev --> Condition all
zscore --> Rolling Z Score
adx --> Average Directional Movement (ADX)
aroon --> Aroon & Aroon Oscillator (AROON)
chop --> Choppiness Index (CHOP)
xex --> Condition any
cksp --> Chande Kroll Stop (CKSP)
dpo --> Detrend Price Oscillator (DPO)
long_run --> Long Run
psar --> Parabolic Stop and Reverse (psar)
short_run --> Short Run
vhf --> Vertical Horizontal Filter (VHF)
vortex --> Vortex
accbands --> Acceleration Bands (ACCBANDS)
atr --> Average True Range (ATR)
bbands --> Bollinger Bands (BBANDS)
donchian --> Donchian Channels (DC)
kc --> Keltner Channels (KC)
massi --> Mass Index (MASSI)
natr --> Normalized Average True Range (NATR)
pdist --> Price Distance (PDIST)
rvi --> Relative Volatility Index (RVI)
thermo --> Elders Thermometer (THERMO)
ui --> Ulcer Index (UI)
ad --> Accumulation/Distribution (AD)
cmf --> Chaikin Money Flow (CMF)
efi --> Elder's Force Index (EFI)
ecm --> Ease of Movement (EOM)
kvo --> Klinger Volume Oscillator (KVO)
mfi --> Money Flow Index (MFI)
nvi --> Negative Volume Index (NVI)
obv --> On Balance Volume (OBV)
pvi --> Positive Volume Index (PVI)
dvdi --> Dual Volume Divergence Index (DVDI)
xhh --> Dynamic rolling highest values
pvt --> Price-Volume Trend (PVT)
Remarks
I also incorporated func descriptions and func test script in commented mode, you can test the functino with the embedded test script and modify them as you wish.
This is a Level 3 free and open source indicator library.
Feedbacks are appreciated.
This is not the end of pandas_ta lib publication, but it is start point with pine v5 lib function and I will add more and more funcs into this lib for my own indicators.
Function Name List:
bton()
wcp()
count()
xbt()
ebsw()
ao()
apo()
xrf()
bias()
bop()
brar()
cci()
cfo()
cg()
cmo()
coppock()
cti()
dmi()
er()
eri()
fisher()
inertia()
kdj()
kst()
macd()
mom()
pgo()
ppo()
psl()
pvo()
qqe()
roc()
rsi()
rsx()
rvgi()
slope()
smi()
sqz_pro()
xfl()
stc()
stoch()
stochrsi()
trix()
tsi()
uo()
willr()
alma()
wcx()
xll()
dema()
ema()
fwma()
hilo()
hma()
hwma()
ichimoku()
jma()
kama()
linreg()
mgcd()
rma()
sinwma()
ssf()
supertrend()
xsa()
swma()
t3()
tema()
trima()
vidya()
vwap()
vwma()
wma()
zlma()
entropy()
kurtosis()
skew()
xev()
zscore()
adx()
aroon()
chop()
xex()
cksp()
dpo()
long_run()
psar()
short_run()
vhf()
vortex()
accbands()
atr()
bbands()
donchian()
kc()
massi()
natr()
pdist()
rvi()
thermo()
ui()
ad()
cmf()
efi()
ecm()
kvo()
mfi()
nvi()
obv()
pvi()
dvdi()
xhh()
pvt()

[blackcat] L1 Wave OscillatorLevel: 1
Background
GET wave theory indicator series contain a indicator called wave oscillator.
Function
This is a modified version of GET wave oscillator with enhanced moving averages which alleviate lag issue to some degree. The feature of it is that it includes overbought and oversold band with dynamic values for indications. Labels and alerts are added.
Key Signal
osc --> wave oscillator output
Remarks
This is a Level 1 free and open source indicator.
Feedbacks are appreciated.