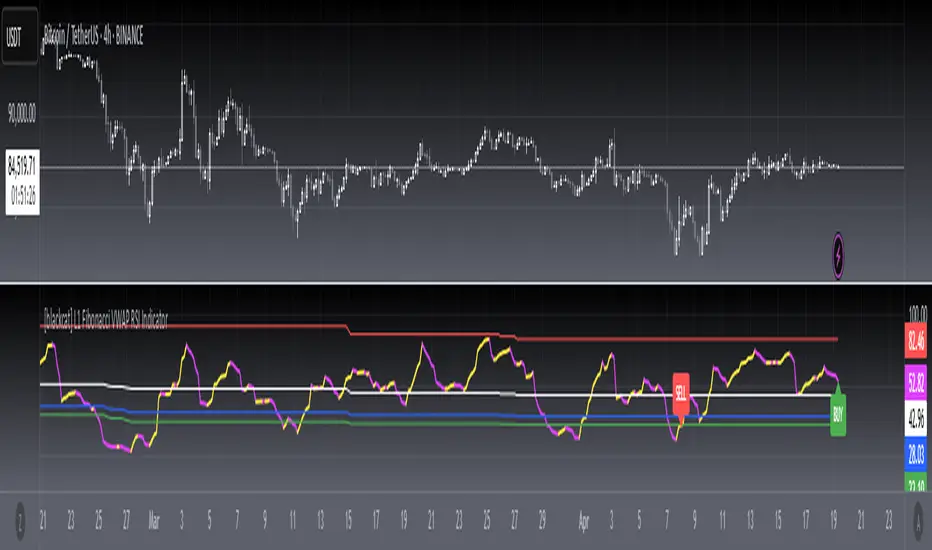
[blackcat] L1 Fibonacci VWAP RSI IndicatorLevel: 1
Background
Ingo Bucher proposed "Fibonacci RSI" in March,2003. It describes the advantages of considering Fibonacci retracement levels for use with the classic RSI indicator. Bucher reviews six charts, each displaying Fibonacci retracement levels for the RSI associated with each chart. The pine code given here will allow you to automatically recreate these charts for any security available in Tradingview. BTW, i enhanced it by changing RSI into VWAP RSI with hl2.
Function
For this Fib VWAP RSI indicator, it also applicable for original Bucher's fib concept. Bucher calculated his retracement levels by picking the RSI high and low for a given time window. In his examples, these were generally six months to a year's worth of data. Once the high and low were picked, he calculated retracement levels based on the well-known Fibonacci numbers (23.6%, 38.2%, 50%, 61.8%). This script here does the same thing. I use a "LookbackLength" (default: 400 bars), which represents a sliding data window that is used to determine the VWAP RSI high and low. The second input value controls the VWAP RSI period (default: 14 bars). The next three inputs select the retracement levels.
A total of eight different lines need to be drawn: the RSI itself, the 50% line, two retracements above the 50% point, two retracements below, and the zero and 100% lines. Pine script will create four plotlines per indicator, so I advise inserting the Fibonacci RSI twice. The first time it is inserted, leave the PlotRSI input with its default value, true. True tells pine script to plot the VWAP RSI itself. The second copy should have the input "Plot RSI" set to false. This will put the 50% line on your chart.
Inputs
LookbackLength --> Look Back Length.
RSILength --> RSI Length.
Fib1 and Fib2 --> Fibonacci lengths.
Key Signal
RawVWAPRSI --> Raw VWAP RSI output signal
Remarks
This is a Level 1 free and open source indicator.
Feedbacks are appreciated.
Blackcat1402
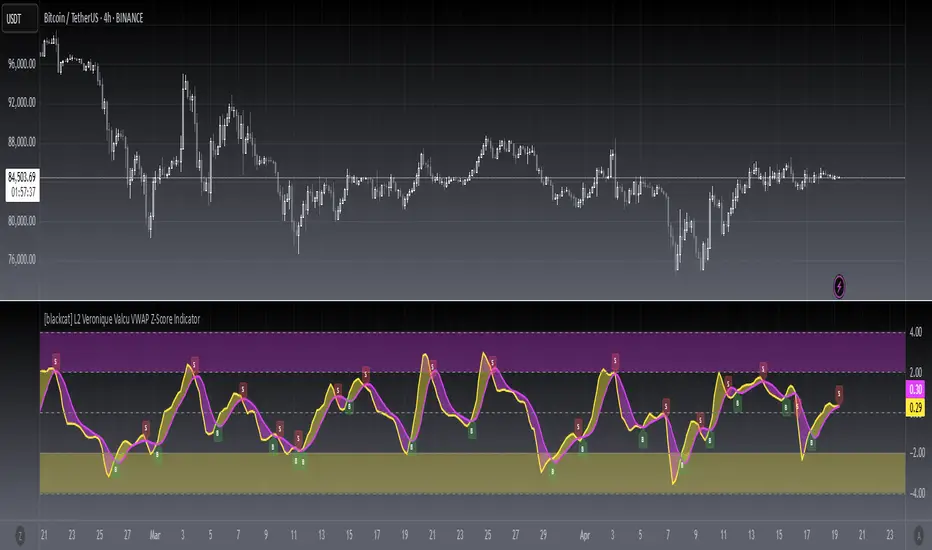
[blackcat] L2 Veronique Valcu VWAP Z-Score IndicatorLevel: 2
Background
Veronique Valcu's article "Z-Score Indicator" in Feb,2003 provided a description and commentary on a new method of displaying directional change normalized in terms of standard deviation. This indicator is realized in pine script here by using the following function code, adding vwap function, called vwap ZScore.
Function
This indicator has three input, "AvgLen", "Smooth1" and "Smooth2." Price is fixed in selected vwap price. AvgLen describes the length of the sample considered in the standard deviation calculation. Once created and verified, the function can be easily called in any indicator or strategy.
Inputs
AvgLen --> Length input for vwap Zscore.
Smooth1 and Smooth2 --> Smoothing length.
Key Signal
Curve1 --> vwap ZScore output fast signal
Curve2 --> vwap ZScore output slow signal
Remarks
This is a Level 2 free and open source indicator.
Feedbacks are appreciated.
[blackcat] L1 M.H. Pee Trend Intensity Index (TII)Level: 1
Background
M.H. Pee developed the Trend intensity index (TII) indicator to measure the strength of a trend in the market.
Function
In this pine script, it uses the current 55-bar moving average for the measurements. TII looks at the proportion of prices of prior 34 bars being above or below today’s 55-bar moving average. The purpose of the TII indicator’s measurements is to gauge the future price trend movement.
The TII indicator takes today’s 55-bar moving average and each bar’s deviation (close – average). Up deviations give a positive amount while the downside deviations give negative amounts.
Up = close – average
Down = average- close
Then, the trend intensity index is the percentage of the total up amount out of the total up and down amounts. The formula is:
Trend intensity index (TII) = {total up / (total up + total down)} × 100
I use alma() plus hma() to filter out noise signal.
Inputs
Price --> Price source as input.
AvgLength --> Length input for the moving average for the TII measurements.
DevCalcLength --> Length input for bar’s deviation.
Key Signal
TII --> TII output signal
Remarks
This is a Level 1 free and open source indicator.
Feedbacks are appreciated.

[blackcat] L3 M.H. Pee Trend Continuation FactorLevel: 3
Background
Developed by M. H. Pee, the Trend Continuation Factor aims to help traders identify whether the market is trending, and, in case it is, in what direction it is headed. It can be used in any time frame, with every currency pair and is suitable for beginner traders.
Function
The indicator is comprised of two lines, namely the PlusTCF and MinusTCF, which separately correspond to bullish and bearish momentum, respectively. If the PlusTCF line is positive, then the prevailing trend is bullish, while a positive MinusTCF line signifies a bearish trend. Logically, both lines cannot be positive at the same time because the market cannot be in a bullish and a bearish trend simultaneously. However, they both can be negative at a current moment, implying that the market has consolidated in a trading range.
As for trading this indicator, it is generally interpreted and acted upon in a similar way as trading the Average Directional Movement Index. The most basic trading strategy involving the TCF is to enter long positions when the PlusTCF line is positive and to enter short positions when the MinusTCF is positive.
Traders also tend to regard the crossovers of the PlusTCF and MinusTCF lines as entry signals in the direction of the advancing line. Thus, if the PlusTCF crosses the MinusTCF and becomes positive, you should initiate a long entry, and vice versa.
Key Signal
PlusTCF Line --> bullish momentum line in yellow;
MinusTCF Line --> bearish momentum line in fuchsia.
Alerts are available.
Remarks
This is a Level 3 free and open source indicator.
Feedbacks are appreciated.

[blackcat] L1 Trend Detection Index (TDI)Level: 1
Background
The trend detection index (TDI), which can be used to help detect when a trend has begun and when it has come to an end.
Function
The Trend Detection Index (TDI) is used to identify when a trend has started and when it ends. The TDI can be used as a stand-alone indicator or combined with others; It will work well when it comes to spotting the beginning of trends. However, this does not mean that its signals are absolutely accurate.
Inputs
Price --> Price source as input.
Length --> Length input can be adjusted to tune TDI performance.
Key Signal
MktPos --> 1 for long and -1 for short
Remarks
This is a Level 1 free but closed source indicator.
Feedbacks are appreciated.

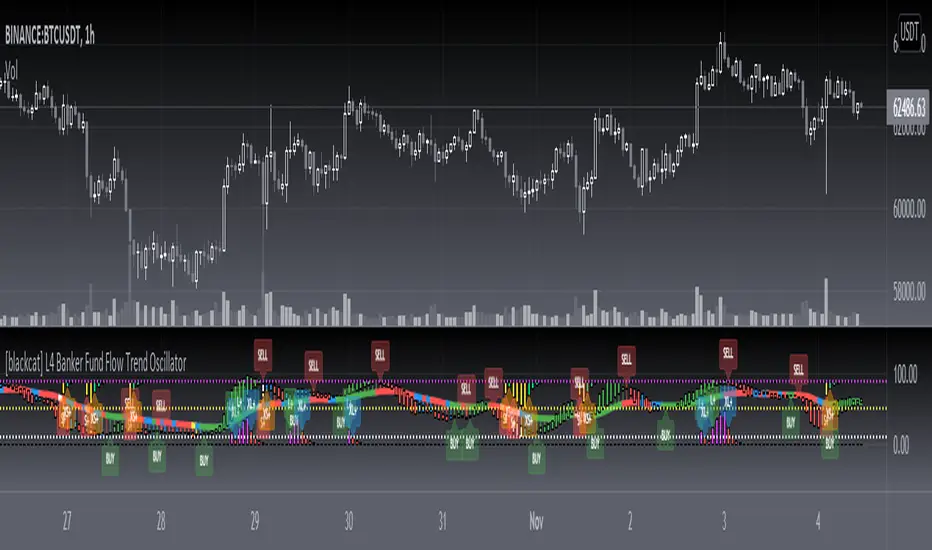
[blackcat] L5 Banker Fund Flow Trend Oscillator X Level: 5
Background
The large funds or banker fund are often referred to as Whale. Whale can have a significant impact on the price movements in various markets, especially in cryptocurrency . Therefore, how to monitor Whale trends is of great significance both in terms of fundamentals and technical aspects. I had published (blackcat1402) L3 Banker Fund Flow Trend Oscillator as open sourced version. Since this indicator is one of the most popular indicators in my collections. Many requested advanced features and improvements on accuracy. Here is the link of free version of L3 Banker Fund Flow Trend Oscillator:
Function
L5 Banker Fund Flow Trend Oscillator X can give you a model of complete banker fund flow operation in cycles. Compared to L3 free and open source version, it contains more advanced algorithms to provide entries. It is comprehensive to disclose the price trend with dynamic overbought and oversold tables. Compared to L4, which is also powerful, but they are using different banker fund engines. L4 is more suitable for those who have been used to L3 already. L5 is slightly different in visual effect and algorithm core, which is much different to L4 and L3. It can depict much clearer trajectory of banker fund as an oscillator. That is the reason why I list this as Level 5, which is closed source and invited-only. Unlike L4, whose cycle of banker fund flow may have 5 steps in max as entry, increase position, decrease position, exit, and weak rebound for exit, L5 only have buy and sell signal with a customized entry signal filter to filter out crowded entry signals.
This indicator derives from "(blackcat) L3 Banker Fund Flow Trend Oscillator". Therefore, it is an oscillator indicator with overbought and oversold threshold levels. However, it combine several novel indicators together but mainly focus on Whale Jump (Whale Pump and Whale Dump), Blackcat1402 featured supertrend indicator (entry signal = supertrend && oscillator signal), trading risk assessment indicator.
In case you are not familiar my indicators:
(blackcat) L5 Whales Jump Out of Ocean X:
(blackcat) L1 Trading Risk Assessment Indicator (I inverted it in this indicator here):
(blackcat) L4 Banker Fund Flow Trend Oscillator:
Indicator Set
Banker Fund Flow Trend Oscillator X, providing swing oscillator and entry signal.
Blackcat1402 Featured Supertrend, providing colors (green for bull and red for bear) on CurrentSafetyLevel of "Trading Risk Assessment Indicator".
Whales Jump Out of Ocean X, whale pumps and dumps
Trading Risk Assessment Indicator, output CurrentSafetyLevel, which is a large time frame oscillator ranging from overbought and oversold zones.
Inputs
EntryFiltPeriod --> Entry Signal Filter Period, default value is 5, which means crowded entry signal in future 5 bars will be ignored.
Safe Bottom --> User defined safe bottom threshold.
Risky Top --> User defined risky top threshold.
Oscillator Center --> define the center value of Oscillator X, which will influence long entry signal generation
Whale Scaler --> A scaling factor input to see whale dumps and pump more clearly in vision.
The other inputs --> Oscillator divergence inputs.
Golden Cross --> According to community feedbacks, popular L3 Yellow Candles for Banker Fund Entry are added Now. It is represented as a Yellow Cross and You can activate and deactivate them in indicator settings.
Dynamic OS/OB tables --> They are hidden commonly but appear only when OB or OS is happening on top right corner or bottom right corner respectively. Values are visiable for you to judge instant trend reversals.
Key Signal
Yellow bars --> Oscillator long
Fuchsia bars --> Oscillator short
Green columns --> CurrentSafetyLevel values and Supertrend long
Red columns --> CurrentSafetyLevel values and Supertrend short
Fuchsia Zone --> Overbought region
Yellow Zone --> Oversold region
Buy-Sell Labels --> "AND" output of Supertrend and Oscillator Entry Signal: Green for "Buy" and Red for "Sell".
Bull-Bear Labels --> Oscillator divergence signal: Yellow for "Bull" and Fuchsia for "Bear".
Long Whales / Banker Pump--> fuchsia and red stick bars (Motive waves with fuchsia color; corrective waves with red color)
Short Whales / Banker Dump --> yellow and red green stick bars (Motive waves with yellow color; corrective waves with green color)
Pros and Cons
Suitable for discretionary trading and auto trading with alerts.
Intuitive and effective, the output signal is more reliable after multi-indicator resonance.
Remarks
My first L5 indicator published
Closed-source
Invite-only
Subscription
500 Tradingview Coins per Monthly Sub.
500X10 Tradingview Coins per Yearly Sub.

[blackcat] L3 VWAP BMP IndicatorLevel: 3
Background
This indicator is my attempt to combine VWAP and BMP indicators.
Function
The goal is to provide a more timely entry point. I mixed up Igor Livshin's balance of market power (BMP) indicator together with vwap, can be considerably simplified for efficient implementation. If you do the math, you'll find that the raw BMP is actually equivalent to (Close-Open) / (High-Low) which can provide instant market judgement. I also filter try to filter out noise by averaging and fast-slow line to capture the shrot term and mid term status. So, it contains two input parameters to be adjusted to find proper values to adapt to different time frame and trading pairs.
Divergence and alerts are availble as well.
Inputs
FastLength --> VWAP BMP fast line length
SlowLength --> VWAP BMP slow line length
Key Signal
BMPF --> VWAP BMP fast line in yellow color
BMPS --> VWAP BMP slow line in fuchsia color
Remarks
This is a Level 3 free but closed source indicator.
Feedbacks are appreciated.

[blackcat] L1 Buff AverageLevel: 1
Background
This indicator buffs up your moving averages using the volume-weighting method presented in Buff Dormeier's article in 2001, "Buff Up Your Moving Averages." The weighting formula has been created as a function in pine script so that it can be referenced from any analysis technique or strategy. In addition, a simple two-line volume-weighted average indicator that references the function has also been included.
Function
The name of the volume-weighted average function is "BuffAverage()." The function has two inputs, price and length. The price input represents the price value upon which the average calculation is based. The length input represents the number of bars that are used in the calculation of the average. The two-line volume-weighted average indicator is presented. This indicator has three inputs. The price input represents the price value upon which the average calculation is based. The FastAvg input represents the number of bars to use in the fast volume-weighted average calculation. The SlowAvg input represents the number of bars to use in the slow volume-weighted average calculation. A simple alert criteria has also been included to provide an alert when the two lines cross.
Key Signal
FastBuff Line --> fast line in yellow;
SlowBuff Line --> slow line in fuchsia.
Remarks
This is a Level 1 free and open source indicator.
Feedbacks are appreciated.

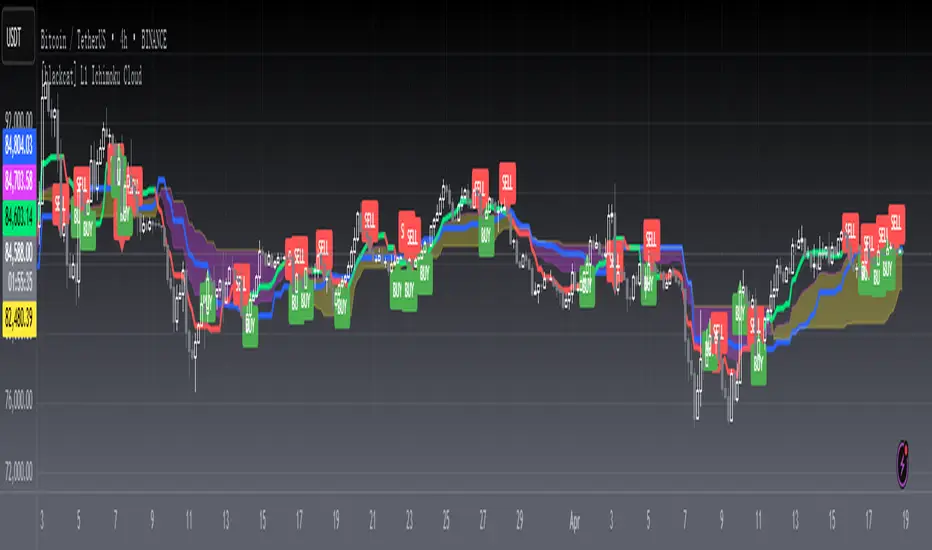
[blackcat] L1 Ichimoku CloudLevel: 1
Background
In Muranaka's article, "Ichimoku Cloud" was described. It contains Ichimoku - Lines and Ichimoku - Cloud.
Function
In the article, Muranaka states that the "market has improved when the delayed line is above the closing prices at that past date." Thus, for this indicator, when the delayed line is above the closing prices at the past date, the turning line will be Green. When the delayed line is below the closing prices at the past date, the turning line will be Red. I eliminate the need to display the delayed line (Silver color). Of course, you can choose to display the delayed line by setting the ShowDelayLine input to true.
Key Signal
Standard Line --> Blue line;
Turning Line --> Green and Red;
Delayed --> Not shown, Silver.
Span1 and Span 2 --> Ichimoku Cloud, Yellow for up trend and Fuchsia for down trend.
Remarks
This is a Level 1 free and open source indicator.
Feedbacks are appreciated.
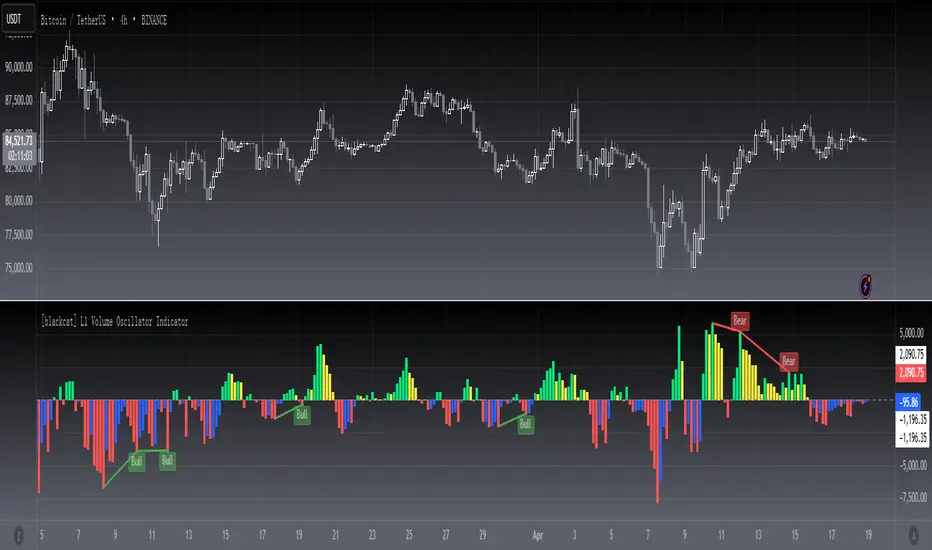
[blackcat] L1 volume Oscillator IndicatorLevel: 1
Background
Omega Research proposed volume oscillator indicator in June 2000.
Function
This is actually a volume-price indicator. With columns greater than zero line, which indicates a up trend. Otherwise, it is a down trend. Green columns indicate up trend pump; yellow columns indicate up trend retracements; red columns indicate down trend dump; blue columns indicate down trend re-bounce.
Key Signal
VolOsc --> volume osillator indicator.
Remarks
This is a Level 1 free and open source indicator.
Feedbacks are appreciated.
[blackcat] L1 Tether LineLevel: 1
Background
Omega Research proposed Tether line in June 2000. I utilized it in fast-slow line form to follow trend.
Function
Due it can provides good support and resistance, using it as "moving average" fast-slow line form can provide very stable golden cross and dead cross signal.
You can adjust parameters to fit for your trading pair and use it and compare it with Supertrend indicator.
Key Signal
Tether_fast --> Tether Fast Line.
Tether_slow --> Tether Slow Line.
Remarks
This is a Level 1 free and open source indicator.
Feedbacks are appreciated.

[blackcat] L4 Banker Fund Flow Trend OscillatorLevel: 4
Background
The large funds or banker fund are often referred to as Whale. Whale can have a significant impact on the price movements in various markets, especially in cryptocurrency . Therefore, how to monitor Whale trends is of great significance both in terms of fundamentals and technical aspects. I had published (blackcat1402) L3 Banker Fund Flow Trend Oscillator as open sourced version. Since this indicator is one of the most popular indicators in my collections. Many requested advanced features and improvements on accuracy. Here is the link of free version of L3 Banker Fund Flow Trend Oscillator:
Function
L4 Banker Fund Flow Trend Oscillator can give you a model of complete banker fund flow operation in cycles. Compared to L3 free and open source version, it contains more advanced algorithms to provide entries. It is comprehensive to disclose the price trend with overbought and oversold znoes. That is the reason why I list this as Level 4, which is closed source and invited-only. Each cycle of banker fund flow may have 5 steps in max as entry, increase position, decrease position, exit, and weak rebound for exit.
Inputs
Middle Trend Period --> Multiple layers of trend identification. This is used to define middle term trend, default value is 34.
Small Trend Period --> Multiple layers of trend identification. This is used to define short term trend, default value is 5.
Tiny Trend Period --> Multiple layers of trend identification. This is used to define ripple level tiny trend, default value is 3.
Trigger Period --> The slowline signal compared to above trends and it determine candle body length.
Overbought Threshold --> User defined overbought threshold, default value is 89.
Oversold Threshold --> User defined oversold threshold, default value is 11.
Long Trend Period Multiplier --> determine a larger time frame multiplifier to see larger trend moves.
Whale Scaler --> A scaling factor input to see whale dumps and pump more clearly in vision.
Key Signal
A much improved version of Banker Fund Flow Trend candles with the same color definitions:
1. banker fund entry with yellow candle;
2. banker increase position with green candle;
3. banker decrease position with white candle;
4. banker fund exit/quit with red candle;
5. banker fund weak rebound with blue candle;
Buy-Sell Labels --> Green for "Buy" and Red for "Sell".
Besides, this indicator also integrated with L5 Whale Jump Out of Ocean X function to track banker fund based pumps and dumps:
Long Whales / Banker Pump--> fuchsia and red stick bars (Motive waves with fuchsia color; corrective waves with red color)
Short Whales / Banker Dump --> yellow and red green stick bars (Motive waves with yellow color; corrective waves with green color)
Pros and Cons
Suitable for discretionary trading and auto trading with alerts.
Intuitive and effective, the output signal is more reliable after multi-indicator resonance.
Remarks
My 2nd L4 indicator published
Closed-source
Invite-only
Redeem rule: constant 500 tradingview coins per month and 500X10 tradingview coins per year.
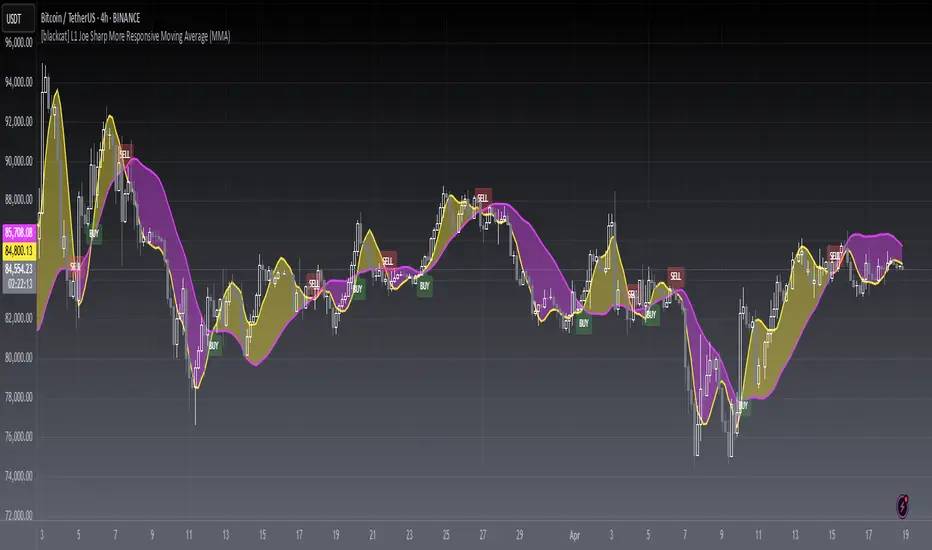
[blackcat] L1 Joe Sharp More Responsive Moving Average (MMA)Level: 1
Background
Joe Sharp propsed a "More Responsive Moving Averages (MMA)" in Jan, 2000. He describes a modified moving average that greatly diminishes the lag that is typically associated with moving averages. With the formula described in the article, the moving average line is more responsive to changes in the price action.
Function
An MMA indicator to plot the modified moving average is created in this script for application on a chart with fastline and slowline to produce golden crosses and dead crosses. In the pine script below, the calculation for the modified moving average is created in a function called ModifiedMA. This function basically takes care of all the necessary calculations for the modified moving average line. By putting the entire calculation into a function, the modified moving average calculation can be easily referenced by any analysis technique.
Key Signal
ModifiedMA (Price, FastLength) --> ModifiedMA Fast Line.
ModifiedMA (Price, SlowLength) --> ModifiedMA Slow Line.
Remarks
This is a Level 1 free and open source indicator.
Feedbacks are appreciated.
[blackcat] L3 Banker Fund Breath OscillatorLevel: 3
Background
I have been working on studying Banker Fund's behavior and have also released some technical indicators. Among these, I liken the cyclical behavior of Banker Fund to breathing. From the perspective of technical indicators, this behavior is actually more like an oscillator of large capital flows. So, I named this indicator: (blackcat) L3 Banker Fund Breath Oscillator
Function
(blackcat) L3 Banker Fund Breath Oscillator is bounded by the zero axis. When the indicator line is above the zero axis, it indicates that there is an inflow of large funds, or it is called the inhalation of banker funds. On the contrary, when the indicator line is below the zero axis, it indicates that there is an outflow of banker funds, or it is called the exhalation of banker funds. It is worth noting that the starting point for banker funds to flow in or out does not necessarily start at the zero crossing point.
In order to more clearly express the starting point of banker fund inflows and outflows, I use gradient colors to indicate the flow of funds. Yellow means fund inflow, fuchsia means fund outflow. When the yellow color above the zero axis begins to change to fuchsia, it is the transition point where funds change from inflow to outflow. When the fuchsia below the zero axis starts to change to yellow, it is the transition point where the funds change from outflow to inflow. Amplitude indicates the intensity of fund inflows or outflows. Therefore, you can observe the divergence of banker fund flow to judge the trend of subsequent fund, or the trend of prices.
Finally, this indicator can work in a very small time frame to provide some information ahead of price movements.
Inputs
WMA Filter Length --> WMA filter length definition
Trend Step Resolution --> Define trend step value for banker fund output
Number of Sum --> Banker fund model input, which will influence banker model accuracy.
Color Breath Lookback --> The larger value, the more blur of transition point for inflow and outflow.
Key Signal
fundbreath --> Banker fund breath output with color gradient
Remarks
This is a Level 3 free but closed source indicator.
Feedbacks are appreciated.

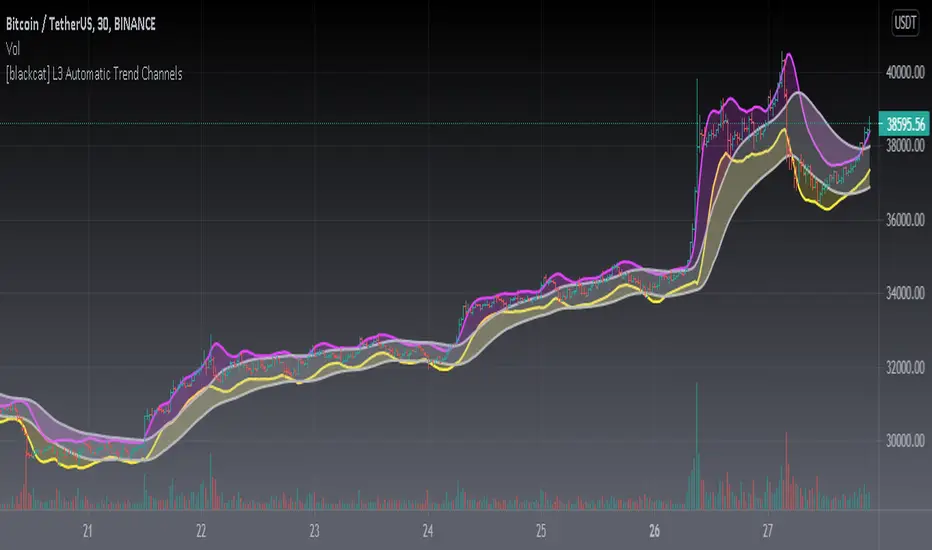
[blackcat] L3 Automatic Trend ChannelsLevel: 3
Background
Trend channels, also sometimes called price channels or trading channels, are a popular tool in technical analysis used by investors to determine good places to buy or sell. Trend channels consist of at least two trend lines that connect the swing highs and the swing lows of a trending or a sideways moving market. It’s important to note that trend channels don’t have to be perfectly parallel lines, but more on that later!
Function
Unlike many other authors who are eager to draw automatic trend lines, I made a trade-off between trend lines based channels and moving averages. As a result, it is more clear to see the trend change and price positions with overbought and oversolder zones highlighted in fuchsia and yellow colors, respectively. Same to trend lines, there are 3 main types of trend channels.
Ascending channel or Rising channel (higher highs and higher lows, which would break out sliver color trend channel and run into fuchsia color overbought band)
Descending channel or Falling channel (lower highs and lower lows, which would break out sliver color trend channel and run into yellow color oversold band)
Sideways or horizontal channel (ranging, which will keep oscillating within silver color trend channel)
Inputs
Algo Lookback (Smaller for Less Computing Power) --> This indicator is very computing-power consuming and if you failed to load it properly and try to input a smaller integer value here.
Algo Nested Period (Smaller for Faster Response) --> This indicator is very computing-power consuming and if you failed to load it properly and try to increase the number here.
Key Signal
Silver channel --> trend channel to identify sideways.
fuchsia band --> overbought band and sell after price cross under the fuchsia lines (Note, the second crossunder is more meaningful)
yellow band --> oversold band and buy after price break out and cross over the yellow lines (Note, the second crossover is more meaningful)
Remarks
This indicator algorithm is very computing-power consuming and it may fail to load in small time frame.
This is a Level 3 free but closed source indicator.
Feedbacks are appreciated.
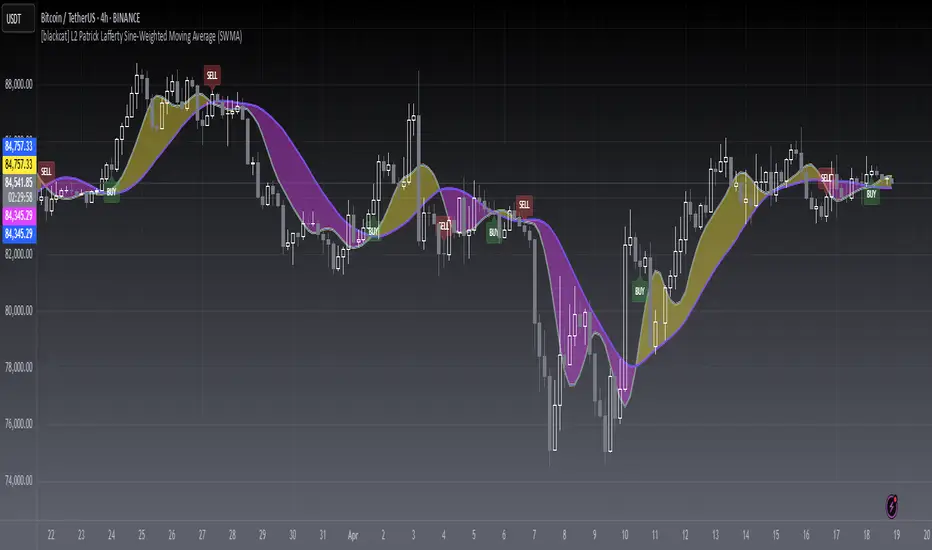
[blackcat] L2 Sine-Weighted Moving Average (SWMA)Level: 2
Background
Invented by Patrick Lafferty in 1999, a Sine Weighted Moving Average (SWMA) takes its weighting from the first half of a Sine wave cycle and accordingly, the most weighting is given to the data in the middle of the data set. It is therefore very similar to the Triangular Moving Average.
Function
A sine weighted moving average (Sine-MA) applies weights to each bar in the shape of the bulge in a sine curve from 0 to pi. For an N-bar average the weightings are
/ 1 \ / 2 \ / N \
sin | --- * pi |, sin | --- * pi |, ..., sin | --- * pi |
\ N+1 / \ N+1 / \ N+1 /
The effect is that middle prices have the greatest weight (much like the TMA, Triangular Moving Average). A Sine Weighted Moving Average ( Sine WMA ) takes its weighting from the first half of a Sine wave cycle and accordingly, the most weighting is given to the data in the middle of the data set.
Key Signal
SWMA(FastLength) --> SWMA Fast Line.
SWMA(SlowLength) --> SWMA Slow Line.
Remarks
This is a Level 2 free and open source indicator.
Feedbacks are appreciated.
[blackcat] L2 Improved Jeffrey Owen Cyclical SystemLevel: 2
Background
In Jeffrey Owen Katz's article "Trading stocks with a cyclical system" he introduces the Stock Rhythm System. I found the central part is quite similar to KDJ indicator and I use my own KDJ algo to enhance its performance.
Function
Jeffrey Owen Katz has a customized stochastic indicator. I used it as the engine of my own KDJ trading system. My KDJ oscillator display consists of 3 lines (K, D and J - hence the name of the display) and 2 levels. K and D are the same lines you see when using the stochastic oscillator. The J line in turn represents the deviation of the D value from the K value. The convergence of these lines indicates new trading opportunities. Just like the Stochastic Oscillator, oversold and overbought levels correspond to the times when the trend is likely to reverse. Just as the Stochastic, the KDJ has the K & D lines, plus the J. This last one represents the divergence from the K-line. When all three converge, it usually signals a possible trend forming. Labels and alerts are added for long and short entries.
Key Signal
KVal --> K.
DVal --> D.
JVal --> J.
Remarks
This is a Level 2 free and open source indicator.
Feedbacks are appreciated.

[blackcat] L1 Mel Widner Auto Support and ResistanceLevel: 1
Background
This indicator/formula was presented in the May 1998 issue of the ‘Technical Analysis of Stocks and Commodities’ magazine. The article was titled “Automatic support and resistance” the article described an approach to finding support and resistance levels on a chart.
Function
Support and resistance analysis is a proven method for selecting key price levels for trading decisions; traders usually perform the analysis by hand. The automatic charting method and new oscillators presented here are easy to implement and give a precise comparison of price to these important levels. Suppose prices are moving higher, fed by steady cash flow and favorable expectations. Then, at some point, the advance begins to slow. Upward momentum is still dominant, but at that point it is diminishing and the rate of rise is decreasing, evidence of resistance. It is like throwing a ball into the air; the ball starts with initial momentum, then slows under the influence of gravity before eventually falling.
Prices behave in a similar manner. After opposing resistance forces are applied for a time, prices slow, finally stop, and reverse direction. The turning point is a resistance level and is the highest high price for that particular period. The converse is true for declining prices. A slowing decline results from support forces and a support level is established at the point where prices turn upward.
Simply, forces cause acceleration. Market forces do not directly produce momentum, but rather momentum changes. These momentum changes in turn are integrated or accumulated to establish momentum. The presence of market forces is evident when the slope of prices, or momentum, changes over time. The effect is most dramatic when forces also change, triggered by price moves or changes in expectations, and abrupt reversals occur. Examination of price histories can confirm the presence of these features.
Two oscillators are defined: the WSO (Widner support oscillator) and the WRO (Widner resistance oscillator). The WSO compares the current close with the most recent six support levels. Values range from zero to 100. WSO = zero means that the close is below all of the six support levels, and
WSO = 100 means that the current close is above all of the six support levels. Changes in WSO indicate changes in support, either breaking of an old level or establishing a new one. The WSO abd WRO are defined as:
WSO = 100( 1 – (INT(S1/C) + INT(S2/C) + INT(S3/C) + INT(S4/C) + INT(S5/C) + INT(S6/C)) / 6)
WRO = 100( 1 – (INT(R1/C) + INT(R2/C) + INT(R3/C) + INT(R4/C) + INT(R5/C) + INT(R6/C)) / 6)
Consequently, WSO and WRO can cross, but this is very uncommon.
Enter long when support is strong and resistance is weak or enter when support is building.
Key Signal
wso --> Widner support oscillator.
wro --> Widner resistance oscillator.
Remarks
This is a Level 1 free and open source indicator.
Feedbacks are appreciated.

[blackcat] L2 Perry Kaufman Adaptive MA (KAMA)Level: 2
Background
Kaufman’s Adaptive Moving Average (KAMA) was developed by American quantitative financial theorist Perry J. Kaufman in 1998. The technique began in 1972 but Kaufman officially presented it to the public much later through his book, “Trading Systems and Methods.” Unlike other moving averages, Kaufman’s Adaptive Moving Average accounts not only for price action but also for market volatility. KAMA is a moving average that takes into account market noise or volatility. KAMA will closely track prices when price fluctuations are relatively small and noise is low. KAMA will adapt to increasing price fluctuations and track prices from a greater distance. This trend following indicator can be used to identify the overall trend, time turning points and to filter price movements.
Function
You can use KAMA like any other trend-following indicator, such as a moving average. You can look for price crosses, directional changes and filtered signals. First, a cross above or below KAMA indicates directional changes in prices. As with any moving average, a simple crossover system will generate lots of signals and lots of whipsaws. Second, You can use the direction of KAMA to define the overall trend for a security. This may require a parameter adjustment to smooth the indicator further. You can change the fastline and slowline parameters to smooth KAMA and look for directional changes. The trend is down as long as KAMA is falling and forging lower lows. The trend is up as long as KAMA is rising and forging higher highs. Finally, You can combine signals and techniques. You can use a longer-term KAMA to define the bigger trend and a shorter-term KAMA for trading signals.
I have included in the indicator an input named "EnableSmooth" that allows you to determine if the KAMA line should be smoothed or not. A "True" as the input value smoothes the calculation. An "False" simply plots the raw KAMA line. When market volatility is low, Kaufman’s Adaptive Moving Average remains near the current market price, but when volatility increases, it will lag behind. What the KAMA indicator aims to do is filter out “market noise” – insignificant, temporary surges in price action. One of the primary weaknesses of traditional moving averages is that when used for trading signals, they tend to generate many false signals. The KAMA indicator seeks to lessen this tendency – generate fewer false signals – by not responding to short-term, insignificant price movements. Traders generally use the moving average indicator to identify market trends and reversals.
Key Signal
AMAValF --> KAMA Fast Line.
AMAValS --> KAMA Slow Line.
Remarks
This is a Level 2 free and open source indicator.
Feedbacks are appreciated.

[blackcat] L1 Tim Tillson IE/2Level: 1
Background
Before this script, I cannot find a IE/2 moving average script in tradingview. Although it is not so complex, it is meaningful to be the 1st Tim Tilson IE/2 script in tradingview community. IE/2 moving average was disclosed in "Smoothin Techniques For More Accurate Signals", Tim Tilson, S&C Magazine, Traders Tips, 01/1998.
Function
IE/2 is one of pre-studies created while T3 famous average was developing. It is calculated as (ILRS(n)+EPMA(n))/2. ILRS, is an integral of linear regression slope. In this moving average, the slope of a linear regression line is simply integrated as it is fitted in a moving window of length n across the data. The derivative of ILRS is the linear regression slope.EPMA is an end point moving average - it is the endpoint of the linear regression line of length n as it is fitted across the data. EPMA hugs the data more closely than a simple or exponential moving average of the same length.
The most popular method of interpreting a moving average is to compare the relationship between a moving average of the security's price with the security's price itself (or between several moving averages).
Inputs
Price --> price data to use
Period --> number of bars to use in calculation
Key Signal
Price --> Price Input.
IE/2 --> IE/2 Ouput.
Remarks
This is a Level 1 free and open source indicator.
Feedbacks are appreciated.

[blackcat] L1 Tim Tillson T3Level: 1
Background
T3 Moving Average is the responsive form of traditional moving averages. Presented in 1998 by Tim Tillson, T3 is also known as the Tillson Moving Averages. The thought behind the development of this technical indicator was to improve lag and false signals, which can be present in moving averages.
Function
The T3 indicator performs better than the ordinary moving averages. The reason for this is T3 Moving Average is built with the EMA (exponential moving average).
Its calculation is based on the sum of single EMA, double EMA, Triple EMA, and so on.
This gives the following equation:
T3 = c1*e6 + c2*e5 + c3*e4 + c4*e3…
Where
e3 = EMA (e2, Period)
e4 = EMA (e3, Period)
e5 = EMA (e4, Period)
e6 = EMA (e5, Period)
a is the volume factor, with a default value of 0.7 but you can also use 0.618
c1 = a^3
c2 = 3*a^2 + 3*a^3
c3 =6*a^2 – 3*a – 3*a^3
c4 = 1 + 3*a + a^3 + 3*a^2
When a trend appears, the price action stays above or below the trend line and doesn’t get disturbed from the price swing. The moving of the T3 and the lack of reversals can indicate the end of the trend. The T3 Moving Average produces signals just like moving averages, and similar trading conditions can be applied. If the price is above the T3 Moving Average and the indicator moves upward, this is a sign of a bullish trend. Here we may look to enter long. Conversely, if the price action is below the T3 Moving Average and the indicator moves downwards, a bearish trend appears. Here we may want to look for a short entry.
Key Signal
Price --> Price Input.
T3 --> T3 Ouput.
Remarks
This is a Level 1 free and open source indicator.
Feedbacks are appreciated.

[blackcat] L4 Better Stephen Klinger KVOLevel: 4
Background
The Klinger Volume Oscillator (KVO) is a trading indicator that uses both price and volume to identify potential longer-term trend reversal points in the markets. Introduced to the trading community by Stephen Klinger, this indicator measures the trend of cash flow based on volume and price movements. In this version, I enhanced it with better volume indicator colorful bars and better trading strategy to have entries and exits, which can be called as Better Klinger Volume Oscillator (BKVO)
Function
Although it is designed to measure the longer-term cash flow trend, it can also exhibit short-term fluctuations. This may sound confusing, but a simple version of the Klinger calculation can be better explained as follows:
The volume moves through the market in each period
Price movements, no matter how small they are taken into account
The Klinger oscillator uses the lowest, highest, and closing prices
The calculation is based on price and volume and is called volume force (VF).
We then get an oscillator derived from the VF Slow 55 EMA and Fast 34 EMA (plus a 13 EMA signal line).
There are four main ways traders use the BKVO to trade in the markets:
Trend direction
Buy and sell trading signals
Bullish and bearish divergence
Colorful volume bars to indicate trend status
Trend direction
When using the Klinger oscillator for trend, there are two ways to do it. The first method is to wait for the KVO indicator line, not the signal line, to cross the zero line.
Traders can also use an intersection of the signal line with the KVO line as a directional sign. It's a little more aggressive.
Traders would only consider long or short trades depending on the KVO line relationship with the zero line. Aggressive traders can buy or sell when the trend changes, keeping their strategy objective.
Buy and sell trading signals
When we use the actual trading signal indicator we are using the signal line the same way we would trade the moving average convergence divergence (MACD) crosses. If you traded every crossover, you can see that you are in draw down and caught in whipsaw. This is not the way to use the original version of KVO as a strategy. Due to original version may produce too many fake crosses. I prefer to use volume bars to display the trends with proper entry and exit alerts. However, it could be better if you can use your own experience and skills to utilize this indicator subjectively besides inherent alerts provided.
Klinger Divergence Trading
Divergence is essentially technical indicators showing one direction and price doing another. If you see the price chart heading upwards while the Klinger indicator has crossed the signal line and heading towards zero. This would be bearish divergence. Bullish divergence is the opposite. I designed divergence indicator inside. However, they are turned off in default and you have to turn them on by yourself if you think they are helpful.
Colorful volume bars
Volume has to be the most underrated market variable used in technical analysis. But if you know how to analyze and interpret them, you can watch market turning points develop and anticipate setbacks and trend changes. You can find out if the pros are buying or selling by analyzing:
Transaction volume at the bid or ask price
High to lower area of the bar and
Average trade size.
The colorful volume bars improves your typical volume histogram by coloring the bars based on 5 criteria:
Volume Climax Up - high volume, high range, up bar (red)
Volume Climax Down - high volume, high range, down bar (white)
High Volume Churn - bars with high volume and low range (green)
Low Volume - bar for low volume (yellow)
Volume Climax plus High Volume Churn - both of the above conditions (fuchsia)
When there are no volume signals, the default color of the histogram bar is cyan/aqua.
Key Signal
KVO Volume Climax up/ Peak Up (Red Bar)
Volume Climax Up bars are identified by multiplying the buy volume (traded on ask) by the range and then looking for the highest value in the last 8 bars (default setting). Volume Climax Up bars indicate a large volume demand leading to rising prices. By default, the bars are colored red.
Volume climax up bars are typically displayed when:
The starting signal for upward trends
The end of the uptrends and Pullbacks during downtrends.
The beginning of an uptrend is almost always marked by a Volume Climax Up bar.
This shows that buyers like to get in and bring large quantities to market and raise prices quickly. A valid breakout should be followed by further buying, but occasionally it will test the low of the volume climax up bar.
Market highs are also indicated by Volume Climax Up bars, often with high volume and / or low volume test patterns. Trend changes usually take a while to develop, so don't get pulled into it too soon - wait for the market to run out. One useful signal to look out for is the low volume bar - this shows that there is finally no demand and the market is likely to stop moving.
During a downtrend, pullbacks are often indicated by Volume Climax Up bars. These show short covers or traders calling a bottom too quickly. As soon as this Climax volume decreases, the downward trend is likely to continue. The continuation of the downtrend is confirmed when the low of the Volume Climax Up bar is taken out.
KVO volume Climax Down/ Peak Down (White Bar)
Volume Climax Down bars are essentially the opposite of Volume Climax Up bars.
Volume Climax Down bars are identified by multiplying the sales volume (traded at bid) by the range and then finding the highest value in the last 8 bars (default). Volume Climax Down bars indicate a large supply that is pushing prices down. The default setting is the white color of the bars.
Volume climax down bars are usually displayed when:
The beginning of the down trends
The end of the down trends and Pullbacks on uptrends.
The beginning of a downtrend is almost always marked by a Volume Climax Down bar.
This shows that the sellers are happy to join in and that large quantities come onto the market and that prices are quickly depressed. A valid breakdown should be followed by more sales, but occasionally the high of the Volume Climax Down bar is tested.
Market lows are also indicated by Volume Climax Down bars, often with low volume churn and / or test patterns. Trend changes usually take a while to develop, so don't get pulled into it too soon - wait for the market to run out. One useful signal to look out for is the low volume bar - it shows that there is finally no supply and the market is likely to stop falling.
During an uptrend, pullbacks are often indicated by Volume Climax Down bars. These show profit taking or traders calling a top too quickly. As soon as this Climax volume drops, the uptrend will likely resume. The continuation of the uptrend will be confirmed when the high of the Volume Climax Down bar is removed.
KVO High volume churn (Green Bars)
High volume churn bars are identified by dividing the volume by the high to low range of the bar and then looking for the highest value in the last 8 bars (default). High volume churn bars indicate profit taking, new supply at the top, or new demand at the bottom of the market. The standard setting is that the bars of the volume histogram are colored green.
High volume churn bars are typically seen at:
The end of the uptrends
The end of the down trends and Mid-trend profit-taking.
When volume churn is high, it means that demand is being met by new supply on top or supply is being met by new demand on the bottom - the price cannot actually go up when new supply or demand comes into the market. Hence the bar is low from top to bottom.
Occasionally Volume Climax (up or down) and High Volume Churn bars coincide and these bars are magenta in color. Beware of intra-day charts. The high volume churn often occurs on the last bars of the trading day. This does not necessarily represent a possible turning point, but a high volume of day traders closing positions.
KVO Low Volume (Yellow Bar)
Low volume bars are identified by looking for the lowest volume in the last 8 bars (default). Low volume bars indicate a lack of demand at the highs or a lack of supply at the lows. The default setting is to color the bars yellow.
Low volume bars are usually displayed when:
The end of the uptrends
The end of the down trends and Pullbacks right in the middle of the trend.
Low volume bars are important volume indicator signal for trend reversal. They are very useful for confirming indicators of a change in trend direction when the market is testing a high or a low.
KVO High Volume Churn + Climax (Fuchsia Bar)
This is a mixture of KVO High volume churn (Green Bars) and KVO Volume Climax up/ Peak Up (Red Bar) or KVO volume Climax Down/ Peak Down (White Bar).
KVO No Volume Signal (Cyan/Aqua Bar)
There is no volume featured signal produced by the indicator.
Remarks
This is a Level 4 invite-only and closed source indicator.
Redeem rule: constant 350 tradingview coins per month and 350X10 tradingview coins per year.

[blackcat] L2 Ehlers Adaptive Jon Andersen R-Squared IndicatorLevel: 2
Background
@pips_v1 has proposed an interesting idea that is it possible to code an "Adaptive Jon Andersen R-Squared Indicator" where the length is determined by DCPeriod as calculated in Ehlers Sine Wave Indicator? I agree with him and starting to construct this indicator. After a study, I found "(blackcat) L2 Ehlers Autocorrelation Periodogram" script could be reused for this purpose because Ehlers Autocorrelation Periodogram is an ideal candidate to calculate the dominant cycle. On the other hand, there are two inputs for R-Squared indicator:
Length - number of bars to calculate moment correlation coefficient R
AvgLen - number of bars to calculate average R-square
I used Ehlers Autocorrelation Periodogram to produced a dynamic value of "Length" of R-Squared indicator and make it adaptive.
Function
One tool available in forecasting the trendiness of the breakout is the coefficient of determination (R-squared), a statistical measurement. The R-squared indicates linear strength between the security's price (the Y - axis) and time (the X - axis). The R-squared is the percentage of squared error that the linear regression can eliminate if it were used as the predictor instead of the mean value. If the R-squared were 0.99, then the linear regression would eliminate 99% of the error for prediction versus predicting closing prices using a simple moving average.
When the R-squared is at an extreme low, indicating that the mean is a better predictor than regression, it can only increase, indicating that the regression is becoming a better predictor than the mean. The opposite is true for extreme high values of the R-squared.
To make this indicator adaptive, the dominant cycle is extracted from the spectral estimate in the next block of code using a center-of-gravity ( CG ) algorithm. The CG algorithm measures the average center of two-dimensional objects. The algorithm computes the average period at which the powers are centered. That is the dominant cycle. The dominant cycle is a value that varies with time. The spectrum values vary between 0 and 1 after being normalized. These values are converted to colors. When the spectrum is greater than 0.5, the colors combine red and yellow, with yellow being the result when spectrum = 1 and red being the result when the spectrum = 0.5. When the spectrum is less than 0.5, the red saturation is decreased, with the result the color is black when spectrum = 0.
Construction of the autocorrelation periodogram starts with the autocorrelation function using the minimum three bars of averaging. The cyclic information is extracted using a discrete Fourier transform (DFT) of the autocorrelation results. This approach has at least four distinct advantages over other spectral estimation techniques. These are:
1. Rapid response. The spectral estimates start to form within a half-cycle period of their initiation.
2. Relative cyclic power as a function of time is estimated. The autocorrelation at all cycle periods can be low if there are no cycles present, for example, during a trend. Previous works treated the maximum cycle amplitude at each time bar equally.
3. The autocorrelation is constrained to be between minus one and plus one regardless of the period of the measured cycle period. This obviates the need to compensate for Spectral Dilation of the cycle amplitude as a function of the cycle period.
4. The resolution of the cyclic measurement is inherently high and is independent of any windowing function of the price data.
Key Signal
DC --> Ehlers dominant cycle.
AvgSqrR --> R-squared output of the indicator.
Remarks
This is a Level 2 free and open source indicator.
Feedbacks are appreciated.
