Multi Timeframe Bollinger Bands Spectrum [Ata]Multi-Timeframe Bollinger Bands Spectrum
Technical Overview
This script integrates multi-timeframe volatility analysis with volume-derived order flow estimation. By combining Bollinger Bands (statistical deviation) with internal candle volume logic, the indicator qualifies price movements to differentiate between sustained trends, reversals, and exhaustion events.
The system is designed to provide a structural context for price action, visualizing market regimes through a dual-zone spectrum and filtering signals based on the interaction between price location and specific volume thresholds.
Core Logic & Calculation
1. Volume Decomposition Algorithm
Instead of using total volume, the script estimates Buying Pressure vs. Selling Pressure based on the close position relative to the candle's High/Low range:
- Buying Volume (vb): Increases as the close approaches the High.
- Selling Volume (vs): Increases as the close approaches the Low.
This logic allows the detection of directional flow even within standard volume bars.
2. Statistical Spectrum
The indicator renders deviations from the Basis (SMA) as two distinct zones:
- Bullish Zone (Blue): Price positioning between the Basis and Upper Band.
- Bearish Zone (Red): Price positioning between the Basis and Lower Band.
This structure is applied across multiple timeframes (overlay) to visualize the macro trend context without noise.
3. Non-Repainting Execution
To ensure historical accuracy and reliability for backtesting, all higher-timeframe data is requested using "lookahead_off". Signals are confirmed only upon the closure of the respective timeframe's candle.
Signal Definitions
Signals are generated only when specific Volatility and Volume conditions intersect:
Reversal Setups (Reaction to Liquidity)
- WALL: Triggered when price rejects the Upper Band accompanied by Extreme Selling Volume (vs > Limit). This suggests active limit sell orders absorbing the rally.
- FLOOR: Triggered when price rejects the Lower Band accompanied by Extreme Buying Volume (vb > Limit). This suggests active limit buy orders absorbing the drop.
- ABSORP: Identifies absorption near the lower bands where selling pressure is met with passive buying (indicated by lower wicks and relative buy volume).
Momentum Setups (Trend Continuation)
- POWER: Validates a breakout above the Upper Band only if supported by Dominant Buying Volume and a strong candle body.
- PANIC: Validates a breakdown below the Lower Band only if supported by Dominant Selling Volume.
- TRAP: Marks failed breakouts where price exits the bands but volume analysis contradicts the move (e.g., low directional volume).
Exhaustion Setups (Statistical Extremes)
- CLIMAX/CRASH: Identifies anomalies where price deviates significantly from the mean (Extreme Deviation) or when volume reaches unsustainable levels relative to the average, often preceding a mean reversion.
Input Parameters
- Bollinger Logic: Configuration for Length and Standard Deviation Multiplier.
- Volume Thresholds: Adjustable factors for Minimum Volume (Trend) and Extreme Volume (Reversal/Climax).
- Timeframe Layers: Toggle visibility for up to 5 higher timeframes.
- Theme: Adjusts label contrast for Dark/Light backgrounds.
Disclaimer
This indicator is strictly for analytical purposes. It provides a visualization of past market data based on statistical and volumetric formulas. Users should apply their own risk management protocols.
Bolingerband

Pi Toolkit – MAs & Volatility Bands (Label v6 Clean)learning how to code, trying to see if Pi will unlock the secrets of the market!
see if it works for anyone!
thanks again

Combined Predictive Indicator### Combined Predictive Zones & Levels
This indicator is a powerful hybrid tool designed to provide a comprehensive map of potential future price action. It merges two distinct predictive models into a single, cohesive view, helping traders identify key levels of support, resistance, and areas of high confluence.
#### How It Works: Two Models in One
This script is built on two core components that you can use together or analyze separately:
**Part 1: Classic Range & Fibonacci Prediction**
This model uses classic technical analysis principles to project a potential range for the upcoming price action.
* **Highest High / Lowest Low:** It identifies the significant trading range over a user-defined lookback period.
* **Fibonacci Levels:** It automatically plots key Fibonacci retracement levels (e.g., 38.2% and 61.8%) within this range, which often act as critical support or resistance.
* **ATR & Average Range:** It calculates a "predicted" upper and lower boundary based on the average historical range and current volatility (ATR).
**Part 2: Advanced Predictive Ranges (Self-Adjusting Channels)**
This is a dynamic model that creates adaptive support and resistance zones based on a smoothed average price and volatility.
* **Dynamic Average:** It uses a unique moving average that only adjusts when the price moves significantly, creating a stable baseline.
* **ATR-Based Zones:** It projects multiple levels of support (S1, S2) and resistance (R1, R2) around this average, which widen and narrow based on market volatility. These zones often signal areas where price might stall or reverse.
#### Key Features:
* **Hybrid Model for Confluence:** The true power of this indicator lies in finding where the levels from both models overlap. A Fibonacci level aligning with a Predictive Range support zone is a much stronger signal.
* **Comprehensive Data Table:** A clean, on-chart table displays the precise values of all key predictive levels, allowing for quick reference and precise trade planning.
* **Multi-Timeframe (MTF) Capability:** The Advanced Predictive Ranges can be calculated on a higher timeframe, giving you a broader market context.
* **Fully Customizable:** All lengths, multipliers, and levels for both models are fully adjustable in the settings to fit any asset or trading style.
* **Clear Visuals:** All zones and levels are color-coded for intuitive and easy-to-read analysis.
#### How to Use:
1. Look for areas of **confluence** where multiple levels from both models cluster together. These are high-probability zones for price reactions.
2. Use the Predictive Range zones (S1/S2 and R1/R2) as potential targets for trades or as areas to watch for entries and exits.
3. Pay attention to the on-chart table for exact price levels to set limit orders or stop-losses.
**Disclaimer:** This script is an analytical tool for educational purposes and should not be considered financial advice. All trading involves risk. Past performance is not indicative of future results. Always use this indicator as part of a comprehensive trading strategy with proper risk management.
Feedback is welcome! If you find this tool useful, please leave a like.

Visual ProwessVisual Prowess: Ultimate Visual of Price Action Indicator
Overview
Visual Prowess is a Pine Script indicator that integrates Trend, Momentum, Strength/Weakness, Money Flow, and Volatility into a single, intuitive interface. Scaled from 0 to 100, it provides traders with clear bullish (>50) and bearish (<50) zones. Visual Prowess is made up of several data components which will be explained below. All these components have custom thresholds that lead to Green Dot Buy Signals and Red Dot sell signals. Designed for multi-timeframe analysis, it helps traders anticipate market moves with precision seeing behind the scenes of price action.
The fundamental inputs of price action are made up of different variables -- the components of Trend Strength, Volatility, Momentum, Money Flow/Volume and Overbought/Oversold. These are very important inputs market makers use. From what I've learned in my trading journey (always still learning), this is the data I value most important. This is why I combined all these components into one indicator.....to be an ultimate visual—this extrapolation of different pieces of data is the Visual Prowess.
What It Does
Visual Prowess combines five key market factors into a unified score (0-100) to assess market conditions by examining the price action like an x-ray aka Visual Prowess:
• Trend Direction & Strength (Green and Red Wave) : Identifies bullish (green clouds) or bearish (red clouds) trend. This data is designed to illustrate the trend by the color, and its strength by the height (score).
How it is Calculated = Data is derived from price action-- comparing the current and previous price highs and lows to measure the strength of upward (+) or downward (-) price movements, smoothed over a period and expressed as a percentage of the price range.
• Momentum (Blue and White Wave): Tracks price acceleration via a custom momentum oscillator, displayed as blue (positive) or white (negative) waves.
How it is Calculated = Data is calculated by subtracting a longer-term exponential moving average from a shorter-term exponential moving average to measure momentum and trend direction. Momentum strength is measured by height on 0-100 score, and color dictates the trend-- Blue up, White down.
• Strength Index (Purple Line): Measures overbought/oversold conditions with a normalized index, derived from price deviation.
How it is Calculated = Strength Index is calculated by comparing the average of price gains to the average of price losses over a specified period, expressed as a value between 0 and 100 to measure momentum and identify overbought or oversold conditions.
• Money Flow: Monitors capital inflows and outflows using a modified Money Flow Index, shown as green (buying) or red (selling) circles.
How it is Calculated = The Money Flow is calculated by using price and volume data to measure buying and selling pressure, comparing positive and negative money flow over a specified period to produce a value between 0 and 100, indicating overbought or oversold conditions and more importantly where the money is moving, + or -.
• Volatility: Gauges market volatility, marked by colored crosses (blue for low, red for high). Blue illustrates low volatility which is key for big moves either + or -; red to illustrate when price action is extremely overheated either + or -.
How it is Calculated = The volatility is calculated by the creator of the BBWP The_Caretaker. This excellent work is calculated using the width of the iconic indicator the Bollinger Bands (the difference between the upper and lower bands divided by the middle band (the moving average), expressed as a percentage to show how volatile the price is relative to its recent average.
Originality
Unlike traditional multi-indicator dashboards, Visual Prowess uses a combination of specific open-source indicators which I believe to be the most important inputs in price action-- trend, momentum, strength, money flow, and volatility into an all-in-one visual ratioed on a 0-100 scale. This unique synthesis of data reduces noise, prioritizes signal alignment, and a look behind the scenes of price action to see deeper into the movement – This combination of indicators has custom thresholds, when these components in alignment with each other hit certain parameters; it leads to key custom price action signals -- Green Dot Buy and Red Dot Sell signals.
There is also a bonus indicator….. a Yellow Triangle. When you see this, it is rare and strong. It only prints when strength index reaches extreme lows at the same time volatility reaches extreme highs…. It then waits to print the yellow triangle upon a third condition= which is price action is back in bullish/positive zone. This Yellow triangle is meant to be strong reversals of Macro Trend lows.
How to Use the Visual Prowess Components:
• Add to Chart: Apply Visual Prowess to any timeframe (recommended: higher timeframes 12H, 1D, 2D, 3D for optimal signals).
• Interpret Zones: Values >50 indicate bullish conditions (green background); <50 signal bearish conditions (red background).
Wait for Green Dot Buy signal for buys and Red Dot Sell signals for sells. One can read each component individually to gauge the price action and predict before the buy signal prints; all of those components merged together is what leads to the buy and sell signals. The story of what’s to come can be seen at lower timeframes before the higher timeframes print, that is a key way to gauge projections of bull or bear prints to come.
HOW TO READ EACH DATA COMPONENT
TREND CLOUDS: Green/red clouds show trend direction; vivid colors tied to number/ score on the 0-100 scale indicate strength of the trend.
Bull Conditions
Green cloud illustrates the trend is bullish. The height is correlated to the trend’s strength—this height is also aligned with colors, more transparent green is weak, then it gets more opaque being medium strength, and the most vibrant is the strongest. How to ride the bull condition is by seeing this transformation of trend get from weak to strong, until it tops out and the wave points down losing strength which alludes to the bear condition.
Bear Conditions
Vice versa with the bear condition. Different shades of red tie into the strength of the bear trend. How to read when things are about to get bearish, is by seeing bull trend shift levels of strength (Example- medium to weak). This transition of bull strength getting weaker is the start, once it gets to weak bear it has commenced until bearish strength tops out before it begins to get weaker leading to the next bull phase.
MOMENTUM WAVES: Blue waves above 50 suggest bullish momentum; white waves below 50 warn of bearish shifts.
Bull Conditions
Good to look at flips of white wave to blue in bearish zones to see the tide turning= guaranteed bullish when safely gets above and holds above 50 zone.
Bear Conditions
Vice versa for Bearish side of this momentum wave being blue wave turning white in bullish zone aiming down to break below 50 zone to confirm bearish descent.
STRENGTH INDEX: Values >80 indicate overbought; <20 suggest oversold. Look for “Bull” or “Bear” labels for divergences.
Bull Conditions
Above 50 level is key, so seeing price action break from below 50 to above 50 is strong buy condition until it gets overbought.
Bear Conditions
Once conditions are too overbought and falling making lower lows (especially when price action is climbing or staying sideways) it is indicating strength is getting weaker. When this indicator fights 50 level and breaks down below 50 level bearish conditions are coming until it gets to an oversold level.
MONEYFLOW: Green circles signal buying pressure; red circles indicate selling.
Bull Conditions
Green circles show money flow is positive so that’s a good sign of upward price action to come, and again above 50 level is bullish conditions
Bear Conditions
Red circles show money flow is negative so that’s a bad sign of price action to come, pointing down and breaking below 50 level is no good. It can have corrections in bullish scenario keep in mind seeing red doesn’t mean trend is over z9could be in higher low scenario).
VOLATILITY: Blue crosses (<25% volatility) suggest breakout potential; red crosses (>75%) warn of overheated markets.
Bull Conditions
This is a very important indication. Big volatile moves can move either direction + or -. When all other components look positive/bullish and this is signalling blue crosses it means a big move is coming and will most likely be in the upward direction –If all other components align/lean bullish.
Another bullish scenario is when price action is down large and red crosses are forming. This indicates that the downward move is overheated (red x’s are rare). This extremely oversold condition can be great buying opportunities when volatility is hot printing red x’s.
Bear Conditions
When all other components look negative/bearish and this is signalling blue crosses it means a big move is coming and will most likely be in the downward direction –If all other components align/lean bearish.
Another bearish scenario is when price action is up large and red crosses are forming. This indicates that the upward move is overheated (red x’s are rare). This extremely overbought condition can be great selling opportunities when volatility is hot printing red x’s.
*****All these components in alignment of hitting each pertaining important threshold--is what prints the green dot and sell signals to trade by. It is not black and white; each component has a sweet spot fine tuned to be triggered through analysis of what is happening individually to each component and how it is reacting to the price action data.
EXAMPLE= Taking a look at the screenshot (Perfect Scenario)
Bullish Examination
- Taking a look at the 2-D timeframe on BTC
x>50
x= all components traveling to the bullish zone. Blue wave, Strength Index with bullish divergence accumulation, Money Flow Positive with Green Trend Wave starting, with teal low volatility cross→→→ leads to Green Dot Buy Signal print…. And the big rise speaks for itself with price action and the big mountain wave of the Green Trend Wave.
This rise leads to
↓↓↓↓
Bearish Examination
Strength Index gets really high at 80 scale, Red X’s showing extremely heated Volatility, Money Flow turning red and sloping down, Trend Wave peaking starting to roll over, Blue Momentum Wave transitioning to white, bearish divergence of price action related to Strength Index→→→ leads to Red Dot Sell Signal print… and the flush speaks for itself when all components fall below 50 level with Trend wave turning red
All this is forecasted in the data, showing weakness before weakness and showing strength before strength. It works because every single piece of important elements in data of price action is incorporated in this all-in-one indicator…. Which leads to the reasoning of me calling this indicator the Visual Prowess, for its unprecedent sharpness of visual observation.
****This is a passion script incorporating every piece of data I value important when reading a chart — to see current perspective of a chart and to help foresee future projection of direction Up or Down. Any community feedback is greatly appreciated. Ongoing work will be done on this script as new thoughts and fine tuning will continuously be done for infinity, as this is my personal go to model for data on the markets.

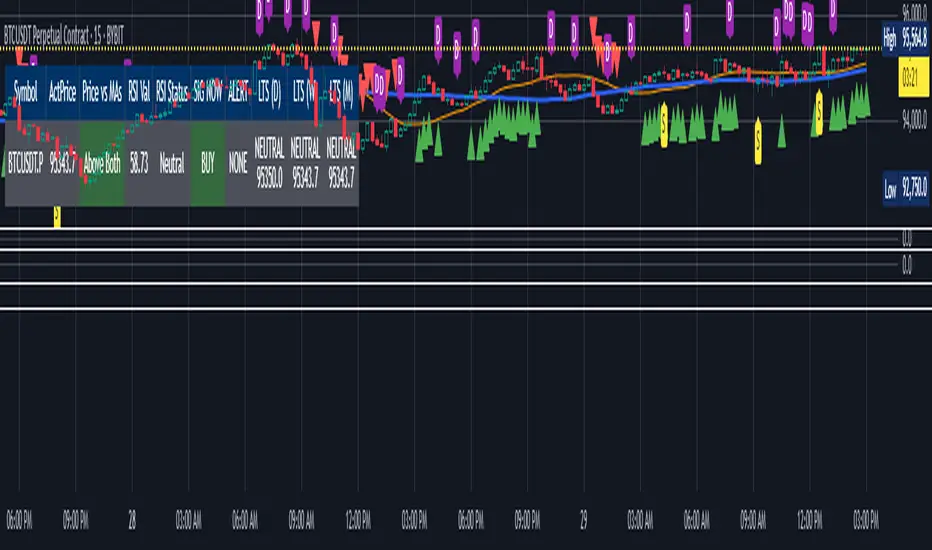
Chart Plotter & Scanner Table V1Script Summary: "Chart Plotter & Scanner Table V1"
This TradingView indicator is designed to give you a comprehensive analysis of the single stock, crypto, or asset currently displayed on your chart. It does this in two main ways:
Visual Signals on the Chart: It draws helpful information directly onto your price chart:
Trend Lines: Plots two moving average lines (one short-term, one long-term) to help you visualize the current price trend.
Buy/Sell Markers ("SIG NOW"): Shows triangle markers below the price (green for potential Buy) or above the price (red for potential Sell) when specific conditions related to price trend and momentum (RSI) are met.
Volume Activity Markers ("ALERT"): Displays small labels ("S" for Spike, "D" for Dump) when the trading volume is unusually high or low compared to its recent average, indicating potentially significant market activity.
Long-Term Signal Markers ("LTS"): Shows small shapes (circles, diamonds, squares) to indicate potential long-term Buy or Sell signals derived from analyzing price action on up to three different, higher timeframes (like Daily, Weekly, Monthly) that you choose.
Status Summary Table: It displays a neat table on your chart (you choose the corner) that acts like a dashboard, summarizing the key findings for the current asset:
Symbol & Price: Shows the ticker symbol and the latest price.
Price vs. Trend: Tells you if the current price is above both trend lines ("Above Both"), below both ("Below Both"), or in between ("Mixed"), with color-coding (Green/Red/Gray).
Momentum (RSI): Shows the current RSI value and its status ("Overbought", "Oversold", or "Neutral"), with color-coding (Red/Green/Gray).
Immediate Signal ("SIG NOW"): Displays the current Buy, Sell, or Neutral status based on the combined trend and momentum rules, with color-coding (Green/Red/Gray).
Volume Alert ("ALERT"): Shows if there's a volume Spike, Dump, or None, with color-coding (Orange/Purple/Gray).
Long-Term Signals (LTS): Shows the Buy, Sell, or Neutral status calculated from each of the three chosen higher timeframes, including the price at which the signal occurred on that timeframe, with color-coding (Green/Red/Gray).
Essentially, this script combines short-term trend and momentum analysis with volume activity monitoring and longer-term perspective signals, presenting the information clearly on your chart and in a summary table for quick assessment. It also allows you to create TradingView alerts based on these signals.
How to Adjust the Script Settings
You can customize how this script works through its "Settings" panel in TradingView. Here’s a breakdown of each section:
1. Indicator Settings (Chart Timeframe)
These settings control the main calculations done on your current chart's timeframe.
MA Source: Choose which price point (Close, Open, High, Low, etc.) the moving averages should be based on. (Default: Close)
Short MA Period: Set the number of bars for the shorter-term moving average. A smaller number makes it react faster to price changes. (Default: 20)
Long MA Period: Set the number of bars for the longer-term moving average. A larger number shows a smoother, longer-term trend. (Default: 50)
RSI Source: Choose which price point the RSI momentum calculation should use. (Default: Close)
RSI Period: Set the number of bars for the RSI calculation. (Default: 14)
RSI Overbought Level: The RSI level above which the asset is considered potentially "Overbought". (Default: 70)
RSI Oversold Level: The RSI level below which the asset is considered potentially "Oversold". (Default: 30)
SIG NOW RSI Buy Min: The minimum RSI value required (along with price being above MAs) to trigger a "SIG NOW" Buy signal. (Default: 55)
SIG NOW RSI Sell Max: The maximum RSI value required (along with price being below MAs) to trigger a "SIG NOW" Sell signal. (Default: 45)
Volume Lookback (LBV): How many bars to look back to calculate the average volume for the Spike/Dump alerts. (Default: 3)
Volume MA Type: The type of averaging method used for the volume calculation (EMA is generally preferred for responsiveness). (Default: EMA)
2. Volume Alert Settings
These control how sensitive the Volume Spike/Dump alerts are.
Volume Alert Sensitivity: Choose a preset sensitivity level:
"Normal": Standard thresholds for spike/dump detection.
"Sensitive": Requires less deviation from the average volume to trigger an alert.
"Highly Sensitive": Triggers alerts on even smaller volume deviations.
"Custom": Ignores the presets and uses the manual multipliers below.
Custom Spike Multiplier (>1): (Only used if Sensitivity is "Custom") How many times greater than the average volume the current volume must be to trigger a SPIKE. (e.g., 1.5 means 50% higher).
Custom Dump Multiplier (<1): (Only used if Sensitivity is "Custom") How many times smaller than the average volume the current volume must be to trigger a DUMP. (e.g., 0.7 means 30% lower).
3. Long Term Signal (LTS) Settings
These settings control the calculations for the three independent Long-Term Signals, which look at higher timeframes.
LTS Timeframe 1/2/3: Select the higher timeframes (e.g., 'D' for Daily, 'W' for Weekly, 'M' for Monthly) for each of the three LTS calculations.
LTS BB Source: The price source used for the Bollinger Band calculation on the LTS timeframes. (Default: Close)
LTS BB Length: The period (number of bars on the LTS timeframe) used for the Bollinger Band calculation. (Default: 20)
LTS BB StdDev: The standard deviation multiplier for the Bollinger Bands used in the LTS calculation. (Default: 2.0)
4. Plotting Settings
These control what is visually displayed on the price chart itself.
Plot MAs?: Checkbox to show or hide the two moving average lines.
Plot SIG NOW Markers?: Checkbox to show or hide the green/red triangle Buy/Sell markers.
Plot ALERT Markers?: Checkbox to show or hide the "S" / "D" volume Spike/Dump labels.
Plot LTS Markers?: Checkbox to show or hide the long-term signal markers (circles, diamonds, squares).
Plot LTS Markers For: Dropdown to choose whether to show markers for only LTS TF1, TF2, TF3, or "All" of them.
5. Table Settings
These control the appearance and content of the summary table.
Show Status Table?: Checkbox to show or hide the entire summary table.
Table Position: Choose which corner or side of the chart the table should appear on.
Decimal Places (Non-Price): How many decimal places to show for values like the RSI number in the table.
Table Text Size: Adjust the font size inside the table cells.
Setting Up Alerts:
This script creates the conditions for alerts. To actually receive notifications:
Click the "Alert" button (clock icon) in TradingView's top toolbar or right-click on the chart.
In the "Condition" dropdown, select the script name ("Chart Plotter & Scanner Table V1").
You will see a list of available alert conditions created by the script (e.g., "SIG NOW Buy Alert", "RSI Overbought Alert", "LTS TF1 Buy Alert", etc.). Choose the one you want.
Configure the rest of the alert settings (Options, Actions, Message) as desired.
Click "Create". Repeat for any other signals you want alerts for.
By adjusting these settings, you can fine-tune the indicator to match your trading style, the specific asset you are analyzing, and the timeframes you are interested in.
Bollinger Bands ForLoopBollinger Bands ForLoop
OVERVIEW
BB ForLoop is an improved version of Bollinger Bands it is designed to calculate an array of values 1 or -1 depending if soruce for calculations is above or below basis.
It takes avereage of values over a range of lengths, providing trend signals smothed based on various moving averages in order to get rid of noise.
It offers flexibility with different signal modes and visual customizations.
TYPE OF SIGNALS
-FAST (MA > MA or MA > 0.99)
-SLOW (MA > 0)
-THRESHOLD CROSSING (when cross above/below treshold set independently for both directions)
-FAST THRESHOLD (when there's change in signal by set margin e.g (0.4 -> 0.2) means bearsih when FT is set to 0.1, when MA is > 0.99 it will signal bullish, when MA < -0.99 it will signal bearish)
Generaly Lime color of line indicates Bullish, Fuchsia indicates Bearish.
This colors are not set in stone so you can change them in settings.
-Bullish Trend, line color is lime
-Bearish Trend, line color is fuchsia
Credit
Idea for this script was from one of indicators created by www.tradingview.com
Warning
Be careful when using this indicator especialy combining DEMA with FT (Fast Treshold).
This indicator can be really noisy depending on the settings, signal mode so it should be used preferably as a part of an strategy not as a stand alone indicator
Remember the lower the timeframe you use the more noise there is.
No single indicator should be used alone when making investment decisions.

Bollinger Band + Mid BandBollinger Band + Mid Band
This indicator combines the classic Bollinger Bands with enhanced customization options, allowing traders to fine-tune the settings according to their specific strategies.
Key Features:
Moving Average Flexibility: Choose between Simple Moving Average (SMA), Exponential Moving Average (EMA), or Weighted Moving Average (WMA) as the central basis for the Bollinger Bands. This flexibility allows you to align the indicator with your preferred method of trend analysis.
Dual Band Deviation: The indicator includes two sets of upper and lower bands based on different standard deviation multipliers. This helps you analyze both the tightness of price action and potential breakout zones.
Customizable Colors: The mid-band, upper bands, and lower bands can be fully customized in terms of color, allowing you to personalize the visual representation of the indicator on your charts.
Dynamic Transparency: The space between the outer Bollinger Bands can be filled with a customizable transparent color, making it easy to visualize price movements within the bands.
Alerts for Crossovers: Alerts are triggered whenever the price crosses above the upper band or below the lower band, giving you timely notifications of potential breakout or breakdown scenarios.
Overbought/Oversold Visualization: The background of the chart changes color when the price crosses above the upper band (indicating overbought conditions) or below the lower band (indicating oversold conditions), providing a visual cue to help you identify market extremes.
Labeling for Significant Events: Labels appear on the chart whenever the price crosses the upper or lower bands, helping you quickly identify key moments for further analysis.
This script is designed for traders who want to leverage Bollinger Bands in their technical analysis but require additional flexibility and customization options. Whether you're using it for trend analysis, volatility assessment, or identifying overbought and oversold conditions, this tool can be tailored to fit a wide variety of trading styles.
Usage:
Ideal for traders looking to enhance the standard Bollinger Bands with more dynamic and customizable features.
Suitable for any market, including stocks, forex, and cryptocurrencies.
Useful in identifying volatility squeezes, breakouts, and potential reversal points.

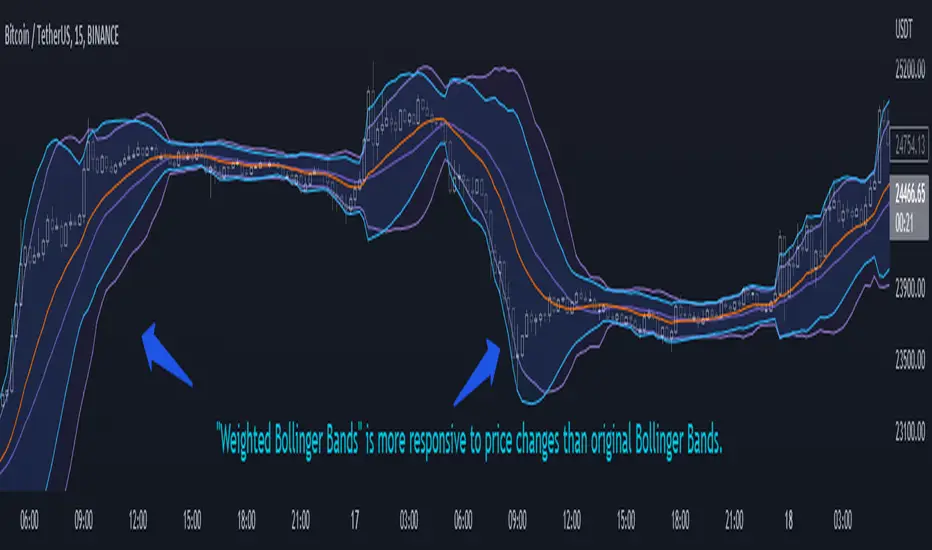
Weighted Bollinger Band (+ Logarithmic)ENG)
Weighted BB is more responsive to price changes than original Bollinger Bands.
the calculation formula uses a weighted method based on the current price.
Instead of using a standard deviation, I used a weighted standard deviation that weights the current price, and instead of a simple moving average, I used a weighted moving average.
Also included is a formula to log the Bollinger Bands for users who view charts on a logarithmic scale.
KOR)
원본 볼밴보다 가격변화에 대한 반응성이 높습니다.
계산식에는 현재가격에 가중을 주는 방식을 사용하였습니다.
표준편차를 사용하는 대신 저는 현재가격에 가중을 두는 가중표준편차를 사용하였고, 단순이동평균 대신 가중이동평균을 사용하였습니다.
또한 로그스케일로 차트를 보는 유저를 위해 볼린저밴드를 log화 하는 수식도 포함하였습니다.
Channels Strategy [Dimkud]Channels trading Strategy. Based on "Channels Strategy" by JoseMetal.
To the original strategy added additional options and filters : Static SL/TP in percents (%), time delay between orders, ATR Filter, second Keltner Channel (Multi TimeFrame).
Interface translated to English.
Were good backtest results on many crypto tokens on 15m - 45m - 1h periods.
Mostly with configuration: Keltner Channel (optimise parameters for every token) + Static SL/TP (optimise values for every token) + "Enter Condition" = "Wick out of band".
The better is to optimise paramaters separately for Short and Long trading. And run two separate bots (in settings enable only Long or only Short.)
Tested on real automated trading on few online bot platforms. (3comm, revenuebot, veles).
Later I will make tutorial how to connect strategy to these platforms or contact me if you need help.

3 indicators in another time frame "3 indicators in another time frame"
1- In the indicator settings section, you can save and change another time period
2-For time frame changes, it should be calculated in minutes
3-Includes three performance indicators ( ichimoku , bollinger bans, pivot ) that are set to a 15-minute timeframe by default.

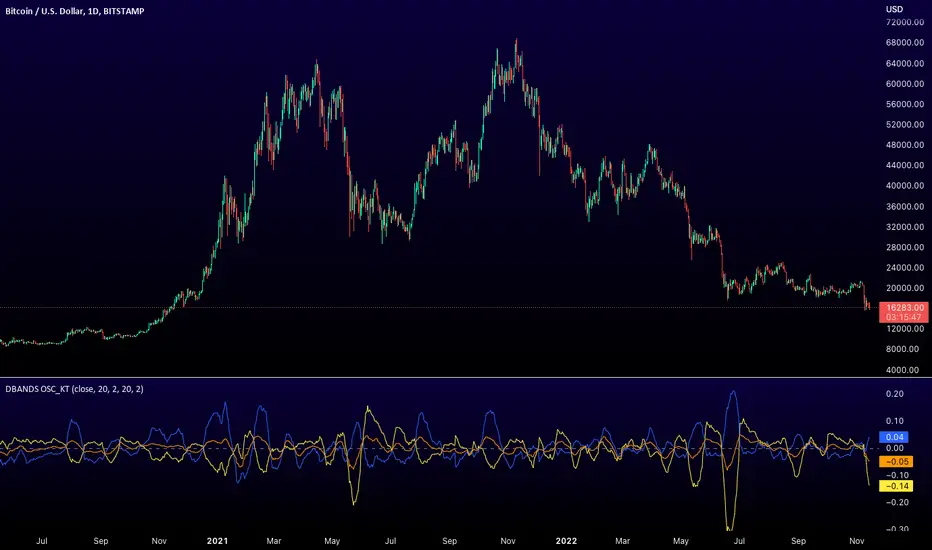
Distance Bands Oscillator_KT █ OVERVIEW
This tool is based on both Bollinger Bands and Keltner Channels, and measures 3 distances between the two, respectively.
Upper Kelt to Upper Bollinger Band
Lower Kelt to Lower Bollinger Band
Kelt Basis to Bollinger Basis Basis
Similar to the Band Width indicator, this can be used as a measure of volatility, and can be used to measure uptrend, downtrend and chop regions on a given chart.
Happy Trading,
ET
Standard Deviation Histogram (SDH)This script tells you what standard deviation the price is from the mean. Due to the limitations of the calculations this study only works for stocks. Further limitations include and inability to calculate past 10 deviation. I have added a smoothing feature and the ability to change the colors. Dont be afraid to change the style to line instead of a histogram. Enjoy!

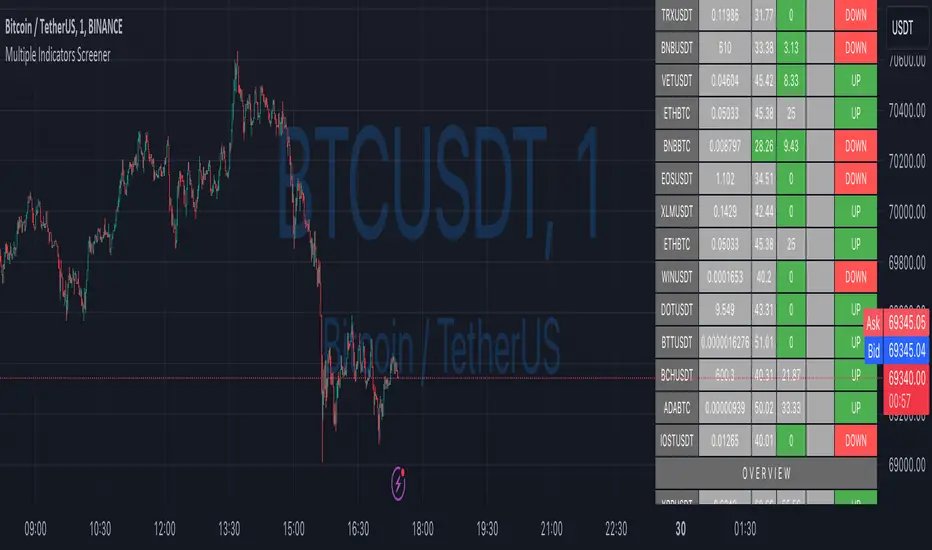
Ultimate Custom ScreenerThis indicator will allow you to make your custom TradingView screener without coding. Add it to the chart, select up to 40 symbols and five indicators, and the screener will do the rest for you. The indicator will form a lovely table with all values and highlighted signals.
The screener is highly customizable, and you can choose its position on the chart, sorting, order of the columns, colors for the tables, and all signals separately. You can easily change parameters for all supported indicators and their signals.
Currently, there are 19 different custom indicators available. Current list of indicators:
Average Directional Index (ADX) - displaying the value of ADX and checking if it's higher than the threshold
Average True Range (ATR) - showing the value of ATR
Awesome Oscillator (AO) - displaying the value of AO and highlighting positive/negative values.
Bollinger Bands (BB) - showing if the price is above/below/in the channel.
Breakout Pivots - Displaying when the price is below/above the most recent pivot low/high.
Commodity Channel Index (CCI) - shows the last CCI value and highlights overbought/oversold values.
Directional Movement Index (DMI) - Up/Down signal (+DI above or below -DI)
Donchian Channel (DC) - showing if the price is above/below/in the channel.
Historical Volatility (HV) - Current value of Historical Volatility
Keltner Channel (KC) - showing if the price is above/below/in the channel.
Moving Average Convergence Divergence (MACD) - Up/Down signal (MACD above / below signal)
Moving Average Crossover (MA Cross) - Displaying MA crosses signals (SMA, EMA, WMA, HMA, VWMA, SMMA, DEMA, VWAP supported)
Moving Average Distance (MA DIST) - Displaying distance to the MA (SMA, EMA, WMA, HMA, VWMA, SMMA, DEMA, VWAP supported)
Price - Displaying the last price for the instrument
Relative Strength Index (RSI) - Displaying the last RSI value and highlighting overbought/oversold values.
Stochastic (STOCH) - Displaying the last Stochastic value and highlighting overbought/oversold values.
Stochastic RSI (STOCH RSI) - Displaying the last Stochastic RSI value and highlighting overbought/oversold values.
SuperTrend - Current state of the SuperTrend.
True Strength Index (TSI) - Displaying the last TSI value and highlighting overbought/oversold values.
We're already working on adding a few more supported indicators. If you have any ideas about the indicators you want to see in our screener, contact us, and we'll consider them.
Disclaimer
Please remember that past performance may not be indicative of future results.
Due to various factors, including changing market conditions, the strategy may no longer perform as well as in historical backtesting.
This post and the script don’t provide any financial advice.
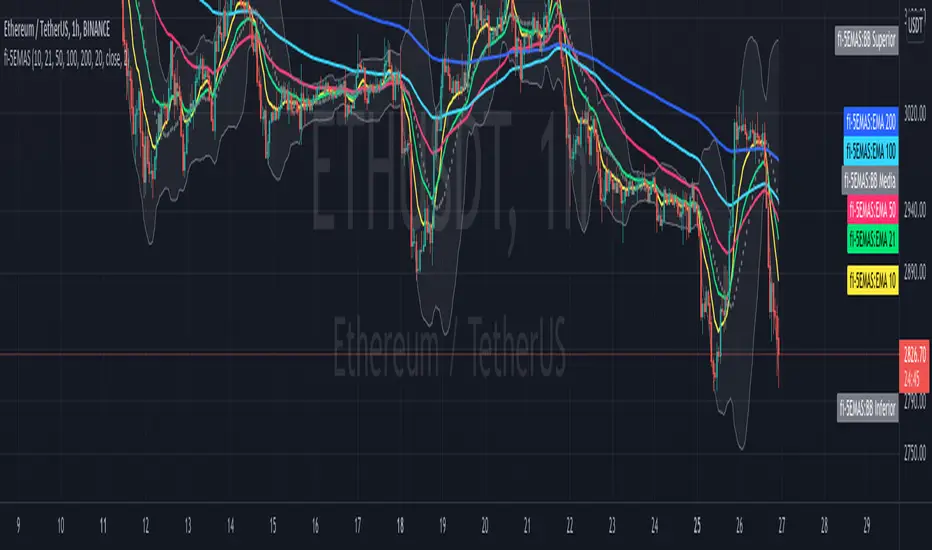
fi - 5EMA + BB - 5 emas en un mismo indicador junto con las bandas de bollinguer.
- Opcion de timeframe
- Actualizado a version 5
//Indicador adaptado a medida sobre "4EMA lines EMA Cross @Philacone + Bollinger Bands by Alessiof"
//Todos los méritos para Alessiof, muchas gracias!!!
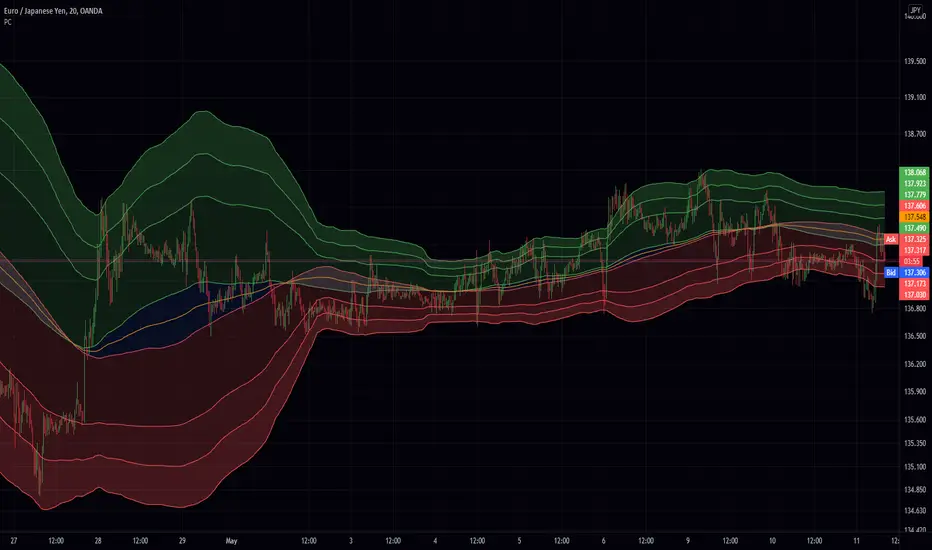
Price Clouds (PS)Price could shows you dynamic support resistance levels. It also displays two bands (ie clouds) that show you where the trend is. If the price hits the bottom of the high band thats a buy and if it hits the top of the high band its a sell. During times of volatility the price can break support but you will find that the opposite band will work as the next level. I added tool tips for every option to help explain what everything does and I also left suggestions for other settings.
This works great on everything! That being said I have this setup in a general way that works really well for 20m forex. If you are scalping you might want to speed up the indicator. This is also true if you want go to the daily chart or above. Adjust the Stdev to match the market.. and I mean really play around with.. dont be shy! With all that out of the way this really will work out of the box. If you like this indicator its actually the same thing as my (PBS) but this one is an overlay on the chart. (Also as of publishing this script the code for this version is way cleaner. In fact I plan on replacing PBS with this as its base)
If you find this indicator is useful to you, Star it, Follow, Donate, Like and Share.
Your support is a highly motivation for me.
Iceberg Intraday LearningHOW TO USE?
A setup which contains Most Useful 14 indicators, that any Intraday Trader might require.
Below will see one by one-
1) Trend Following Icebergs - (3 Different Indicators to choose from)
--> The trend following indicators optionally.
--> Very simple to understand, yellow indicating sideways, green - going upside, and red - going downside.
--> Trend Indicator - 1st Iceberg is HMA Crossovers
--> Trend Indicator - 2nd Iceberg is SMA (20). It will change its color according to the trend of the market.
--> Trend Indicator - 3rd Iceberg is RSI(14) in EMA, will be plotted at the bottom of the screen.
2) Classic Pivot Points & Floor Pivot Points: - ( 2 Different Indicators to choose from )
--> Classic Pivot Points having 5 Supports & Resistances on the chart.
--> Floor Pivot Points, At the middle, it is pivot point (PP) level and multiple support and resistance levels
--> Floor Pivot Points is a very known indicator that indicates whether that helps in-stock selection.
--> This is a very crucial indicator as it shows the Floor Pivot Points levels for the next day.
--> One can make a learn by looking at next day's Floor Pivot Points that whether the stock is going to be trendy/sideways the next day.
3) Support/Resistance
--> This indicator is used for finding support and resistance levels on charts.
--> Helps in getting pullbacks and exit levels
--> Lines will change color automatically if any candle closes above the support/resistance line. It will change it's to green.
--> Similarly, it will change its color to red if the price is below the support
4) Highs/lows, SuperTrend Up Down ( 2 Different indicators to use )
--> Plots Highs / Lows in the selected time frame.
--> Added SuperTrend indicator with length 10 with source HL/2 and multiplier to be 2.
5) Dynamic ATR - Average True Range (14 Days)
--> It plots 2 important levels at the starting of the day.
--> 2 bands are plotted in the morning when the market opens, resembling strong support/resistance zones.
6) First Candle
--> This will highlight the first candle that is formed of the selected time interval.
7) Bollinger Band
--> Bollinger band is also added for better catching the momentum as seen on chart.
--> The Upper and Lower Bands are used as a way to measure volatility by watching the relationship between the Bands and price
8) VWAP
--> VWAP is useful for learning trend direction in any market conditions.
9) RSI & MACD
--> Plots label indicating the status of RSI and MACD.
This works for Intraday Trades - when the resolution is kept to less than 1 hour ( Say 3 , 5 , 10 , 15 Mins), This works well when the resolution is kept to 1 Day - Good for Swing Trades spanning over a few days, This works well when the resolution is kept to 1 Day or Week - Good for Investments.
Trend Indicator - 3rd Iceberg Is a repainted based on the hybrid RSI Logic
Stop Loss - That should be done by following ones risk appetite , Ideally the open/close of the previous candle should be the stop loss for the buy/sell but everyone has their own Risk Management Strategies based on the capital deployed.
If you like it and find it useful or if you find a defect or bug , Please let us know in the comments .. that would encouraging !! for us to develop it further
Coded for learning INDIAN Markets.
CAUTION:: There could be scenarios when the breakout/breakdown candle is rejected , especially when it is long one
so it is always recommended to have a confirmation candle that open-closes above the breakout candle / open-closes below the breakdown candle.
Disclaimer: No Investment Advice Provided , You should always understand that P AST PERFORMANCE IS NOT NECESSARILY INDICATIVE OF FUTURE RESULTS.
Inspiring to learn the Pine making market learnings easier.
Thanks & Regards,
Iceberg Intraday Learning.

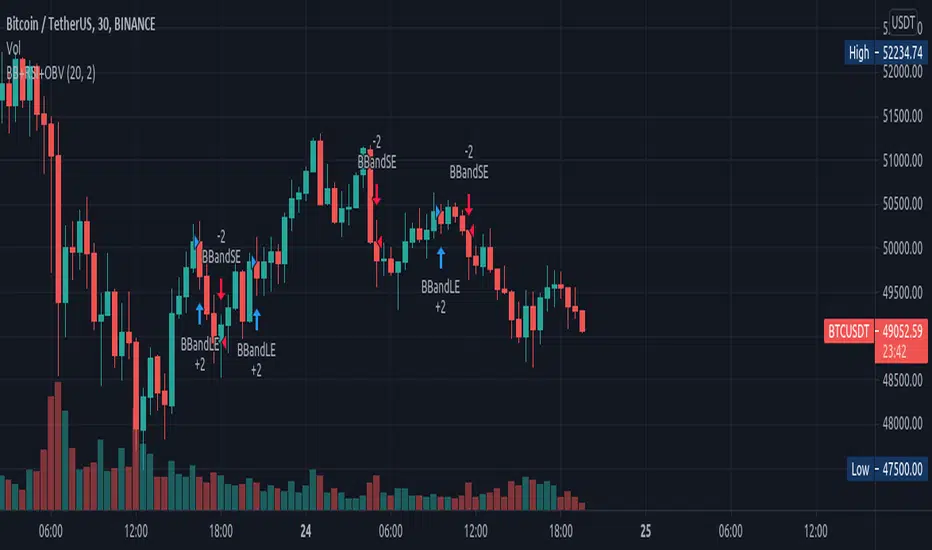
BB+RSI+OBVI use Bolinger Band and RSI and OBV
when Bolinger band midline cross and rsi is bigger than 50 and obv is going up i wrote this strategy to test this strategy
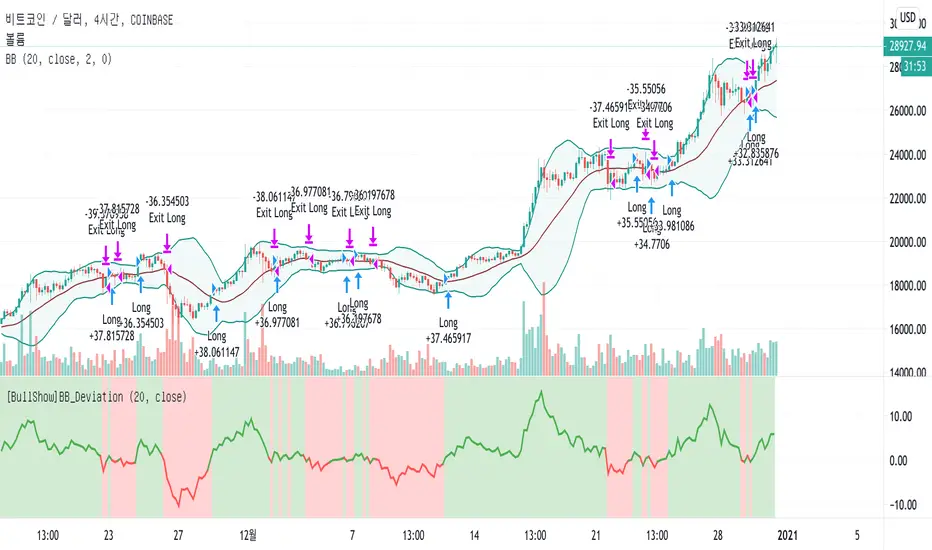
[BullShow]BollingerBands_Deviation StrategyHello Everyone.
Are you enjoying this crazy bull market?
I want to Introduce very classic and simple but powerful strategy.
My strategy is using Bollinger Bands. Yes! It's the indicator that everyone knows and uses.
First of all, let's look at how Wikipedia defines the Bollinger Bands.
Bollinger Bands - Wikipedia
------------
Introduce
Bollinger Bands (/ˈbɒlɪnjdʒər bændz/) are a type of statistical chart characterizing the prices and volatility over time of a financial instrument or commodity, using a formulaic method propounded by John Bollinger in the 1980s.
Purpose
The purpose of Bollinger Bands is to provide a relative definition of high and low prices of a market. By definition, prices are high at the upper band and low at the lower band. This definition can aid in rigorous pattern recognition and is useful in comparing price action to the action of indicators to arrive at systematic trading decisions.
Interpretation
The use of Bollinger Bands varies widely among traders. Some traders buy when price touches the lower Bollinger Band and exit when price touches the moving average in the center of the bands. Other traders buy when price breaks above the upper Bollinger Band or sell when price falls below the lower Bollinger Band. Moreover, the use of Bollinger Bands is not confined to stock traders; options traders, most notably implied volatility traders, often sell options when Bollinger Bands are historically far apart or buy options when the Bollinger Bands are historically close together, in both instances, expecting volatility to revert towards the average historical volatility level for the stock.
------------
However, the use of the Bollinger Bands described on the website is only very abstract without precise guidelines.
So, by calculating the deviation of the 20-days moving average line, the center line of the Bollinger Bands, I chose a strategy to buy when the deviation starts to widen and sell when the separation starts to narrow again.
As a result, I found a strategy that would give you a decent return.
Due to the nature of the strategy, trades in the box zone are frequent, so the win rate is small, but when the price trend is confirmed, you can get a big profit.
Therefore, you can expect good returns from pair with a clear trend rather than pair that trade frequently in the box zone.
If you are interested in my strategy, Use the link below to obtain access to this indicator or PM me to obtain access
Thank you for your supporting.
안녕하세요 여러분.
이 미친 강세장을 즐기고 있습니까?
매우 고전적이고 단순하지만 강력한 전략을 소개하고 싶습니다.
제 전략은 볼린저 밴드를 사용하는 것입니다. 예! 모두가 알고 사용하는 그 지표입니다.
그러나 웹에서 설명하는 사용 방법은 정확한 지침없이 매우 추상적 일 뿐입니다.
따라서 저는 볼린저 밴드의 중심선 인 20 일 이동 평균선의 편차를 계산하여 편차가 확대되기 시작하면 매수하고 편차가 다시 좁아지기 시작하면 매도하는 전략을 선택했습니다.
결과적으로, 나는 당신에게 적절한 수익을 줄 전략을 찾았습니다.
전략의 특성상 박스 존에서의 거래가 빈번해 승률은 적지 만 가격 추세가 확인되면 큰 수익을 얻을 수 있습니다.
따라서 박스 존에서 자주 거래되는 패어보다는 명확한 추세의 패어에서 좋은 수익을 기대할 수 있습니다.
전략에 관심이 있으시거나 사용을 원하신다면 아래를 참고 해 주시거나 PM을 보내주세요.
감사합니다.
Back Testing
*initial_capital: $10000
*default_qty_value: 100%
*commission_value: 0.1%
*Period: 2017.01.01~
Profit
BTCUSD: 3109%
ETHUSD: 11160%
YFIUSDT: 823.88%
ZILUSDT: 570.84%
BNBUSDT: 937.18%
LINKUSDT: 471.41%
*Due to the nature of the strategy, a pair with a strong trend yields better results.
*전략 특성상 추세가 강한 패어에서 더 좋은 결과를 도출합니다.
*Optimized for a 4 hour time frame and a 12 hour time frame.
*4 시간 시간 프레임과 12 시간 시간 프레임에 최적화되었습니다.
Bollinger Bands combined with Telson T8Indicator idea based on classic Bollinger bands and Telson T8 moving average.
The indicator detects Bollinger bands narrowing which should predict a move to a direction.
NOTE: You need to define in the indicator settings (Narrow percentage) the percentage between the upper and lower bands that would be highlighted.
For example: if you set 5%, the indicator will highlight the parts that the upper and lower bands are less than 5% compare the current price (usually close price, but you can define otherwise)
Use the Telson T8 to determinate the trend/direction of the move.
Fibonacci Bollinger Bands Alerts [QuantNomad]These are alerts for my Fibonacci Bollinger Bands Strategy. You can find more details and strategy description in it:
It's a pro indicator, you can have access to it for a small fee. Link to my PRO indicators you can find in my signature.
Disclaimer
Please remember that past performance may not be indicative of future results.
Due to various factors, including changing market conditions, the strategy may no longer perform as good as in historical backtesting.
This post and the script don’t provide any financial advice.
Fibonacci Bollinger Bands Strategy [QuantNomad]This strategy is modified Stanard Bollinger Bands Strategy. Instead of using standard deviation, I use a metric of how big is the range for the last X bars. Also, I’m using Fibonacci levels as multipliers for BB.
In this strategy you have a choice of 3 different Trailing Stop Loss types:
Standard % – standard percent based TSL
Fibonacci Level – close your position on another Fibonacci level or basis line of BB.
Parabolic SAR – Parabolic SAR adapted as trailing stop loss.
For Standard % and Parabolic SAR, you can use the “TSL Offset” parameter to set an initial offset for trailing stop loss.
Parameters
BB Length – Bolinger Bands Length
Fib Entry Level – Entry BB Multiplier level. Can be one of Fibonacci levels: 0.236, 0.382, 0.5, 0.618, 0.786, 1.000
Trailing SL Type – Type of Trailing Stop Loss used to close positions. Can be one of 3 types: “Standard %”, “Fibonacci Level”, “Parabolic SAR”
TSL Offset (%) – Initial offset for TSL. Applicable to “Standard %” and “Parabolic SAR”
TSL Fib Level – Fibonacci level used for “Fibonacci level” type of TSL
TSL PSAR Start / Increment / Maximum – parameters for PSAR type of TSL.
Strategy side – you can choose the side of the strategy. You can require strategy to go only Long, Short to Both sides.
From/To Day/Month/Year – you can use these parameters to set backtesting range to check the performance of your strategy on a specific range
It's a pro indicator, you can have access to it for a small fee. Link to my PRO indicators you can find in my signature.
Disclaimer
Please remember that past performance may not be indicative of future results.
Due to various factors, including changing market conditions, the strategy may no longer perform as good as in historical backtesting.
This post and the script don’t provide any financial advice.

MultiTimeFrame Shifting Bollinger BandsJust 3 Bollinger Bands with different adjustable timeframes plus shifting (left/right) capability and non-integer deviation values.
I wrote this because I couldn't find the perfect BB indicator that matches my needs. Feel free to use it.

[TVExtBot]HeikinAshi Trend Indicator v1.0Heikin-ashi Trend Indicator v1.0
BYBIT:BTCUSD
This indicator analyzes trends with Heikin-ashi Ass and EMA to buy and sell, and closes positions by analyzing patterns of Bollinger bands and candles.
The numbers at the top and bottom of the indicator are the RSI values.
Only overbought 30 or less and oversold 70 or more are displayed.
이 지표는 하이킨아시와 EMA로 트랜드를 분석하여 매수와 매도 진입을 하고 볼린저밴드와 캔들의 패턴을 분석하여 포지션종료를 합니다.
지표의 상단과 하단에 표시된 숫자는 RSI값입니다.
과매수 30이하와 과매도 70이상만 표시합니다.
