BTC Halving [YinYangAlgorithms]This Indicator not only estimates what it thinks may be the PRICE for the Start, High and Low of the Halving, but likewise estimates WHEN the Start, High and Low of Halving may be. It then creates Trend Lines based on these predictions so that you may get an evaluation towards if the Price is currently Overbought or Oversold. These Trend Lines may be very useful for seeing the Slope in which the Price may move if it is to reach the estimated Price by the estimated Date. By evaluating the Prices location based on these Trend Lines we may determine if the Price is currently Overbought or Oversold.
These Trend Lines likewise may help identify locations of Support and Resistance. If the Price is much higher than its current Trend Line it is Overbought. There is a chance it will Consolidate back to the Trend Line or it may even correct with a dump all the way back to it; the opposite is true if it is much lower than its current Trend Line.
Trend Lines and Estimates are not all that is featured within this Indicator however. There are also Price Zones which may help identify if the price is currently:
Very Overbought (Red)
Slightly Overbought (Orange)
Neutral (Yellow)
Slightly Oversold (Teal)
Very Oversold (Green)
These zones may help give you an idea of how the price is currently fairing and its potential for movement. Likewise, it may help define where Support and Resistance may be found.
The trend line estimates are done with an algorithm created to evaluate the difference between price and % change that has occurred between the Start, High and Low of all the halvings over how many days between each data type. This may allow us to make an educated estimate towards what Price and Date the Start, High and Low will occur at.
Our Zones are created by evaluating the current Market Cap and circulating supply vs Max Supply of BTC. This may help give us an evaluation of what Price may be considered to be Overbought and Oversold; and likewise may help with estimations of where there may be Support and Resistance based on these Zones.
Tutorial:
In the example above we’re displaying the Halving Start Trend Line, our Information Tables and our Estimated Halving Vertical Marker. This Trend Line may help to display not only the trajectory and slope the Price needs to take to reach the Estimated Halving Price by the Estimated Halving Date; but it may also help to show if the price is Overvalued or Undervalued based on its position above or below this Trend Line.
Based on the Trajectory of the Estimated High Upward Trend Line (Green Line) in the photo above and from the ‘High Date’ estimated in the Information tables; we may attempt to estimate the location the ATH of this Bull Market will create and the price slope it may follow in doing so. This Trajectory may be very useful for understanding the price action that may occur for it to reach the High estimated Price by the High estimated Date.
We currently allow for two different types of zones within our Settings, one called ‘Fast’ displayed in the example above; and the other called ‘Slow’ displayed in the example below.
Our Fast Zone aims to move the Zone Levels Faster in an attempt to move with volatility and parabolic movement. This may help to keep the Very Overbought (Red) and Very OverSold (Green) Levels more accurate by attempting to keep the price within them. By doing so, we may aim to keep all of the Slightly Overbought, Slightly Oversold and Neutral Levels more accurate as well.
The Levels within these zones are defined by the Bright (less transparent) Lines. Whereas the Darker (more transparent) lines represent the Basis Lines between two different levels. These Basis lines may likewise act as a Support and Resistance Location too, but generally hold less weight than the actual Levels themselves.
What you may see is that during the Bull Market, the price is within the very Overbought Zones and even touches again the Very Overbought Level a few times. Likewise, during the Bear Market, the price is within the very Oversold Zones and even slightly drops below the Very Oversold Level. This may be expected and likewise may help to give estimates at potential for growth and decay within the Price based on which condition the Market is within.
Slow Zones move a little slower than Fast Zones, however they may still be accurate. Likewise, it is up to you to decide which Zone works better for your specific Trading Style; however, by default, the Zone type is set to Fast.
If you refer to both the Fast and Slow examples above, you may notice in the Fast the Price is only slightly above the ‘Slightly Oversold’ (Teal) line. Also, In the Fast, the Price where the ‘Very Overbought’ Level is 100k. This is one of the many reasons we’ve opted for ‘Fast’ as the default, and it is because it allows more room for movement; and in our opinion, potentially accuracy as well.
If you refer to the Slow example, you’ll see that the price is currently facing the Neutral Level as a Resistance location. However, if you refer to the price residing at the Slows ‘Very Overbought’ Level, it is only 81.5k, compared to the 100k of Fast.
The BTC Halving is a major event that takes place roughly every 4 years. It historically has a major impact on the market, and some may even say it signifies the Start, or close to start of the Bull Market. Therefore, since historically there may be cycles that BTC and potentially crypto itself follows, we’ve developed this Indicator in hopes that it may solve one of the biggest questions traders face. What Date will the Start, High and Low of the Halving occur and also at what Price.
Hopefully this Tutorial has given you some guidance as to how this Indicator may be used to help identify some of these key levels; including the slope at which the price may have to move if it is to reach its projection Price by its projected Date.
Settings:
1. Show Prediction Trend Lines:
- Options:
All
Start + High
Start + Low
High + Low
Start
High
Low
None
- Description:
Prediction Trend Lines may be an important way to see the Slope the Price needs to take to reach the Predicted Price by the Predicted Date. This may be useful for identifying if the Price is currently Overbought or Oversold.
2. Zone Type:
- Options:
Fast
Slow
- Description:
Zone types change the way the Zones expand.
3. Show Zones:
- Options:
All
Zones
Basis
None
- Description:
Zones are a way of seeing Overbought and Oversold Price locations based on Market Cap and Circulating Supply vs Max Supply.
4. Vertical Markers:
- Options:
All
Line
Label
None
- Description:
Vertical Markers display where the Halving has occurred with a Vertical Line and Label.
5. Show Tables:
Tables may be useful for seeing the Price and Date for when the Start, High and Low of the Halving may occur.
6. Fill Zones:
Filling in Zones may help to identify which Zone the Price is currently in.
If you have any questions, comments, ideas or concerns please don't hesitate to contact us.
HAPPY TRADING!
Btc!

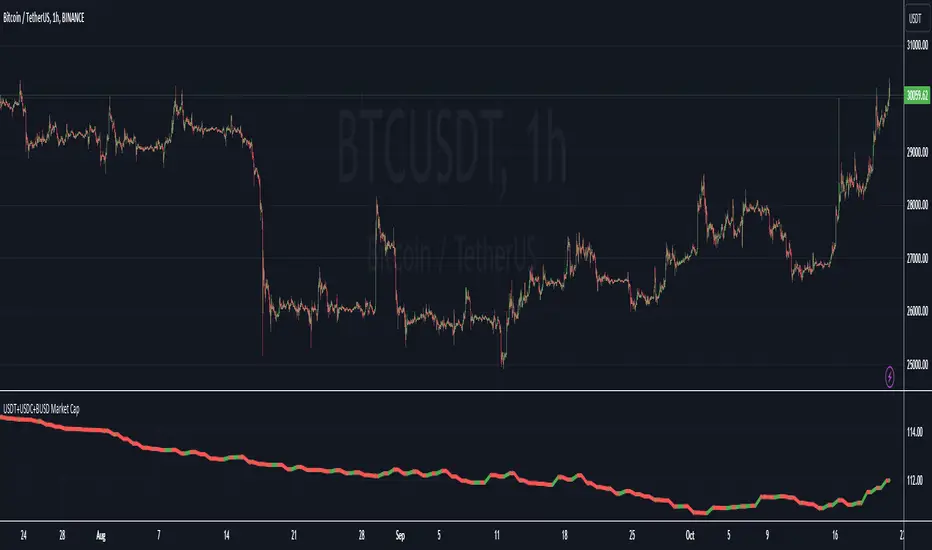
USDT+USDC+BUSD Market CapThis Pine Script indicator visualizes the combined market capitalization of three prominent stablecoins: USDT, USDC, and BUSD, on a daily basis.
It fetches the daily closing market caps of these stablecoins and sums them. The resulting line graph is displayed in its own separate pane below the main price chart.
The line is color-coded: green on days when the market cap is increasing compared to the previous day, and red when it's decreasing.
High/Low of week: Stats & Day of Week tendencies// Purpose:
-To show High of Week (HoW) day and Low of week (LoW) day frequencies/percentages for an asset.
-To further analyze Day of Week (DoW) tendencies based on averaged data from all various custom weeks. Giving a more reliable measure of DoW tendencies ('Meta Averages').
-To backtest day-of-week tendencies: across all asset history or across custom user input periods (i.e. consolidation vs trending periods).
-Education: to see how how data from a 'hard-defined-week' may be misleading when seeking statistical evidence of DoW tendencies.
// Notes & Tips:
-Only designed for use on DAILY timeframe.
-Verification table is to make sure HoW / LoW DAY (referencing previous finished week) is printing correctly and therefore the stats table is populating correctly.
-Generally, leaving Timezone input set to "America/New_York" is best, regardless of your asset or your chart timezone. But if misaligned by 1 day =>> tweak this timezone input to correct
-If you want to use manual backtesting period (e.g. for testing consolidation periods vs trending periods): toggle these settings on, then click the indicator display line three dots >> 'Reset Points' to quickly set start & end dates.
// On custom week start days:
-For assets like BTC which trade 7 days a week, this is quite simple. Pick custom start day, use verification table to check all is well. See the start week day & time in said verification table.
-For traditional assets like S&P which trade only 5 days a week and suffer from occasional Holidays, this is a bit more complicated. If the custom start day input is a bank holiday, its custom 'week' will be discounted from the data set. E.g.1: if you choose 'use custom start day' and set it to Monday, then bank holiday Monday weeks will be discounted from the data set. E.g.2: If you choose 'use custom start day' and set it to Thursday, then the Holiday Thursday custom week (e.g Thanksgiving Thursday >> following Weds) would be discounted from the data set.
// On 'Meta Averages':
-The idea is to try and mitigate out the 'continuation bias' that comes from having a fixed week start/end time: i.e. sometimes a market is trending through the week start/end time, so the start/end day stats are over-weighted if one is trying to tease out typical weekly profile tendencies or typical DoW tendencies. You'll notice this if you compare the stats with various custom start days ('bookend' start/end days are always more heavily weighted). I wanted to try to mitigate out this 'bias' by cycling through all the possible new week start/end days and taking an average of the results. i.e. on BTC/USD the 'meta average' for Tuesday would be the average of the Tuesday HoW frequencies from the set of all 7 possible custom weeks(Mon-Sun, Tues-Mon, Weds-Tues, etc etc).
// User Inputs:
~Week Start:
-use custom week start day (default toggled OFF); Choose custom week start day
-show Meta Averages (default toggled ON)
~Verification Table:
-show table, show new week lines, number of new week lines to show
-table formatting options (position, color, size)
-timezone (only for tweaking if printed DoW is misaligned by 1 day)
~Statistics Table:
-show table, table formatting options (position, color, size)
~Manual Backtesting:
-Use start date (default toggled OFF), choose start date, choose vline color
-Use end date (defautl toggled OFF), choose end date, choose vline color
// Demo charts:
NQ1! (Nasdaq), Full History, Traditional week (Mon>>Friday) stats. And Meta Averages. Annotations in purple:
NQ1! (Nasdaq), Full History, Custom week (custom start day = Wednesday). And Meta Averages. Annotations in purple:

Quantitative Trend Strategy- Uptrend longTrend Strategy #1
Indicators:
1. SMA
2. Pivot high/low functions derived from SMA
3. Step lines to plot support and resistance based on the pivot points
4. If the close is over the resistance line, green arrows plot above, and vice versa for red arrows below support.
Strategy:
1. Long Only
2. Mutable 2% TP/1.5% SL
3. 0.01% commission
4. When the close is greater than the pivot point of the sma pivot high, and the close is greater than the resistance step line, a long position is opened.
*At times, the 2% take profit may not trigger IF; the conditions for reentry are met at the time of candle closure + no exit conditions have been triggered.
5. If the position is in the green and the support step line crosses over the resistance step line, positions are exited.
How to use it and what makes it unique:
Use this strategy to trade an up-trending market using a simple moving average to determine the trend. This strategy is meant to capture a good risk/reward in a bullish market while staying active in an appropriate fashion. This strategy is unique due to it's inclusion of the step line function with statistics derived from myself.
This description tells the indicators combined to create a new strategy, with commissions and take profit/stop loss conditions included, and the process of strategy execution with a description on how to use it. If you have any questions feel free to PM me and boost if you enjoyed it. Thank you, pineUSERS!

TTP NVT StudioNVT Studio is an indicator that aims to find areas of reversal of the Bitcoin price based on the extreme areas of Network Value Transaction.
Instructions:
- We recommend using it on INDEX:BTCUSD
- Use the daily or weekly timeframe
The indicator works as an oscillator and offers to visualisation modes.
1) Showing the short term oscillations of NVT showing signals in potential areas of reversal.
2) The actual value of NVT displayed. When in green is an area of value and in red when its overextended.
This indicator can be used based on the signals or based on breakouts of trend lines drawn in the oscillator mode.
Red/green dots: signal type 1 - extremes with confirmation, these might trigger late
Yellow/Orange: signal type 2 - extremes without confirmation, might trigger too soon

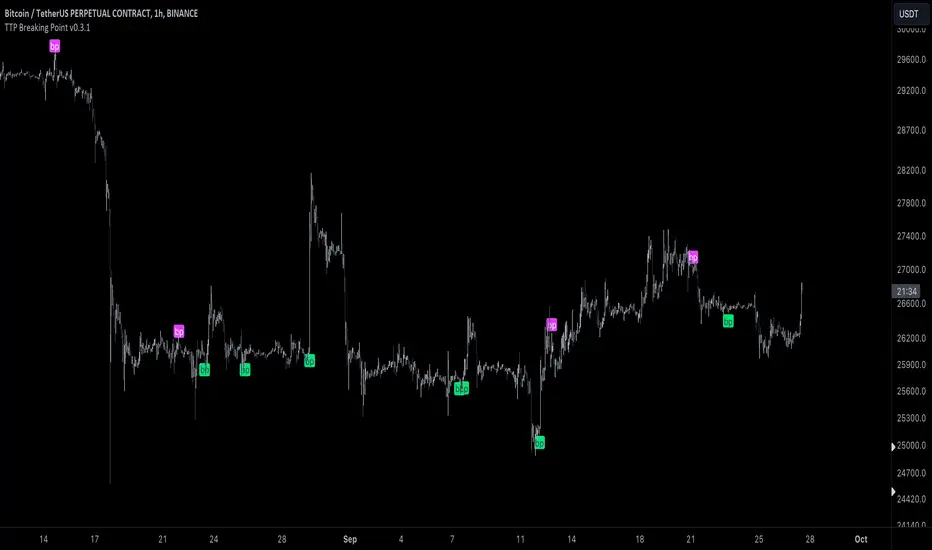
TTP Breaking PointThis signal uses information from BITFINEX:BTCUSDLONGS and BITFINEX:BTCUSDSHORTS to forecast tops and bottoms.
The idea behind is very simple.
We calculate the RSI of the ratio of longs vs shorts and find areas where both the SMA of this RSI and the RSI itself are overextended.
You might notice that the win rate is not high but most of the wins provide a decent move that, if combined with proper risk management, can be used to build profitable strategies.
The signal offers a backtesting stream: 1 for buy and 2 for sell.
Shortly I'll be adding new features including: alerts, support for other symbols, filters, etc.
Fierytrading: Volatility DepthDear Tradingview community,
I'd like to share one of my staple indicators with you. The volatility depth indicator calculates the volatility over a 7-day period and plots it on your chart.
This indicator only works for the DAILY chart on BTC/USD.
Colors
I've color coded the indicator as follows:
- Red: Extreme Volatility
- Orange: High Volatility
- Yellow: Normal Volatility
- Green: Low Volatility
Red: extreme changes in price. Often during local tops and bottoms.
Orange: higher than average moves in price. Often before or after a "red" period. Often seen in the middle of bear or bull markets.
Yellow: normal price action. Often seen during early stage bull-markets and late stage bear-markets.
Green: very low price movement. Often during times of indecision. Once this indicator becomes green, you can expect a big move in either direction. Low volatility is always followed by high volatility.
In a long-term uptrend, a green period often signals a bullish break out. In a long-term downtrend it often signals a bearish break out.
How to use
Save the indicator and apply it to your chart. You can change the length in the settings, but it's optimized for 7 days, so no need to change it.
I've build in alerts for all 4 different volatility periods. In most cases, the low volatility alert is enough.
Good luck!

Correlation Coefficient - DXY & XAUPublishing my first indicator on TradingView. Essentially a modification of the Correlation Coefficient indicator, that displays a 2 ticker symbols' correlation coefficient vs, the chart presently loaded.. You can modify the symbols, but the default uses DXY and XAU, which have been displaying strong negative correlation.
As with the built-in CC (Correlation Coefficient) indicator, readings are taken the same way:
Positive Correlation = anything above 0 | stronger as it moves up towards 1 | weaker as it moves back down towards 0
Negative Correlation = anything below 0 | stronger moving down towards -1 | weaker moving back up towards 0
This is primarily created to work with the Bitcoin weekly chart, for comparing DXY and Gold (XAU) price correlations (in advance, when possible). If you change the chart timeframe to something other than weekly, consider playing with the Length input, which is set to 35 by default where I think it best represents correlations with Bitcoin's weekly timeframe for DXY and Gold.
The intention is that you might be able to determine future direction of Bitcoin based on positive or negative correlations of Gold and/or the US Dollar Index. DXY has been making peaks and valleys prior to Bitcoin since after March 2020 black swan event, where it peaked just after instead. In the future, it may flip over again and Bitcoin may hit major highs or lows prior to DXY, again. So, keep an eye on the charts for all 3, as well as the indicator correlations.
Currently, we've moved back into negative correlation between Bitcoin and DXY, and positive correlation with Bitcoin and Gold:
Negative Correlation b/w Bitcoin and DXY - if DXY moves up, Bitcoin likely moves down, or if DXY moves down, Bitcoin likely moves up (or if Bitcoin were to move first before DXY, as it did on March 2020, instead)
Positive Correlation b/w Bitcoin and Gold - Bitcoin and Gold will likely move up or down with each other.
DXY is represented by the green histogram and label, Gold is represented by the yellow histogram and label. Again, you can modify the tickers you want to check against, and you can modify the colors for their histograms / labels.
The inspiration from came from noticing areas of same date or delayed negative correlation between Bitcoin and DXY, here is one of my most recent posts about that:
Please let me know if you have any questions, or would like to see updates to the indicator to make it easier to use or add more useful features to it.
I hope this becomes useful to you in some way. Thank you for your support!
Cheers,
dudebruhwhoa :)

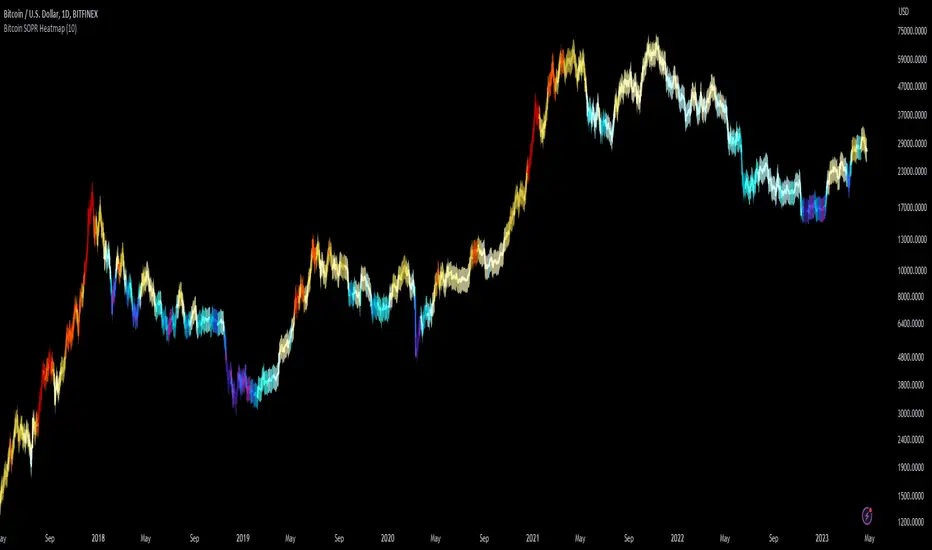
Bitcoin SOPR HeatmapSOPR (spent output profit ratio) is a metric, provided by Glassnode to measure if most BTC are moved in profit or in loss. The higher SOPR is, the more profits are realized (theoretically) and vice versa.
This indicator shows SOPR visually as a heatmap directly on the Bitcoin chart.
Cold temperatures (blue, purple) show bear markets. Bear market peaks should be visible in dark purple.
Hot temperatues (yellow, red) show bull markets. Hype phases should be visible in red.
I recommend to hide chart when using the indicator. Otherwise you can also enlarge the heatmap in the settings.
The indicator works best on BTCUSD standard charts on daily timeframe. Otherwise you will see an error message.
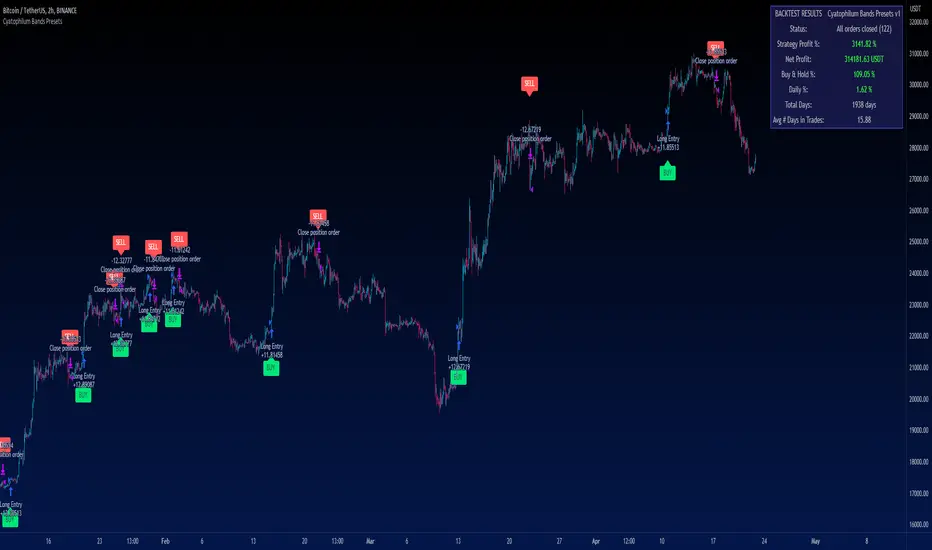
Cyatophilum Bands PresetsThis is a pre-configured strategy for swing trading Bitcoin on the 2 hours chart, Ethereum on the 4 hours, and BNB on the 2 hours. (More presets can be added later on)
Built upon my generic indicator "Cyatophilum Bands D.E.", this indicator removes the struggle of having to copy all the settings, instead, a single dropdown input lets you choose the preset.
More info about the complete strategy here:
The strategy has been backtested over 5 years of historical data and forward tested for +4 months (since january 2023) with the goal to beat buy and hold returns .
The indicator shows real time strategy results and has custom alerts for BUY and SELL signals which can be used to automate the strategy.
When creating your alert, first set your alert messages in the indicator settings. Then, select the indicator and create the alert using "alert() function calls only".
A warning will appear on the chart if the preset and chart configuration is incorrect.
Plots like bands and trailing lines are disabled by default to improve performance but can be turned on in the style tab.
BNBUSDT 2H
A combination of deviation and ATR bands based on Donchian channels.
ETHUSDT 4H
A combination of deviation and ATR bands based on SMA and an ATR trailing stop.
BTCUSDT 2H
Based on Donchian channels breakout type with a tight 2% stop loss, and a 3% take profit that gets disabled when price is trending up to let the trailing stop do its job.
Disclaimer: Backtest results are not representative of future results.
ViPlay Signal demo versionViPlay Signal is a trading indicator designed for the TradingView platform that generates buy and sell signals based on a combination of technical indicators. The indicator uses two different Moving Averages, the Market Range Oscillator (MRO), and the Williams Percent Range (WPR) to provide traders with a comprehensive set of tools for identifying potential entry and exit points, confirming trends, and managing risk.
The Moving Averages used in the indicator are the 50-period and 200-period Simple Moving Averages (SMA) of the closing price, which are widely used in technical analysis to identify trends and support/resistance levels. The Market Range Oscillator (MRO) is a proprietary indicator that measures the range of the market, which can help identify extreme market conditions. The MRO is used to determine buy and sell signals, with two different calculations performed to identify each type of signal.
The Williams Percent Range (WPR) is a momentum indicator that helps traders identify overbought and oversold conditions in the market. By using the WPR in combination with the Moving Averages and the MRO, the ViPlay Signal indicator can provide more accurate and reliable signals to traders.
The indicator allows users to select a strategy from a dropdown menu that includes BTC 1m, 3m, 15m, 4H, and LTC 3m, ideal 5m, and 15m super. The values of some of the parameters change based on the selected strategy, allowing traders to customize the indicator to their specific needs.
The ViPlay Signal indicator plots buy and sell signals on the chart as labels with arrows pointing up or down to indicate the direction of the trade. A green arrow represents a buy signal, and a red arrow represents a sell signal. The chart is clean and easy to read, with complete symbol/timeframe and script name information provided.
In summary, the ViPlay Signal indicator is a powerful and customizable tool for traders looking to improve their trading performance. The indicator provides a comprehensive set of technical analysis tools, including Moving Averages, the MRO, and the WPR, to help traders identify potential trading opportunities and manage risk.

Crypto Performance Index1. The Crypto Performance Index (CPI) estimates the price appreciation of a crypto asset relative to the overall crypto market performance. The indicator is calculated using a Sharpe Ratio principle enhanced with time-domain normalization and cumulative parametrization.
2. The CPI is based on the idea that the performance of an asset should be evaluated not only in terms of its absolute price movement, but also in terms of its risk-adjusted returns compared to the broader market. The Sharpe Ratio, which takes into account both the asset's return and its volatility, is a commonly used measure of risk-adjusted performance.
3. The CPI takes the Sharpe Ratio principle further by incorporating a time-domain normalization technique that adjusts for differences in volatility across different time periods. The cumulative parametrization ensures that the CPI considers the overall performance of the asset over a specified period of time.
4. To use the indicator, select a timeframe and set the standard deviation period (default is 20). The CPI line can be compared against various market benchmarks, including the total crypto market cap (white line), altcoins total market cap (blue line), low-cap altcoins (without ETH), and Bitcoin.
5. An upward slope of the CPI line indicates strong price performance of an asset, with a relatively high chance for the asset to continue growing faster than the market in the future. Conversely, a downward slope of the CPI line indicates weak price performance of an asset, with a relatively high chance for the asset to depreciate in price with respect to the rest of the market in the future.
6. Overall, the CPI provides a comprehensive measure of an asset's price performance, taking into account both its absolute return and its risk-adjusted return relative to the broader market. This makes it a valuable tool for investors looking to evaluate the performance of their crypto holdings and make informed decisions about buying, selling, or holding assets.

Trendmaster - Crypto Flow IndexWhat it is:
The Trendmaster Crypto Flow Index is a unique tool designed to give you an overview of the performance of different Crypto market sectors and sub-sectors. It helps you to identify where you should be focusing your investments for maximum portfolio efficiency and profitability.
What it does:
The Crypto Flow Index presents a visual overview of the flows of retail and institutional capital into the four main market sectors: Large Caps, Alts Coins, Shit Coins, and Stable Coins as well as several other sub-sectors. Each sector is assigned a "Flow Score", which indicates its current performance, demand, and strength in percentage terms. The "Flow Score" also provides insights into the current stage of the market cycle and the typical over and underperformances of assets that correlate to it. Additionally, the index factors in the sector have a "Correlation" to the broader market, allowing you to see the best sectors for trading and investing, either for positional hedging or differential plays.
How to Use it:
To use the Trendmaster Crypto Flow Index, you can simply observe the evolving colored line within the indicator and the table overview. You can identify which sectors are outperforming or underperforming the general market and make informed decisions about where to direct your focus and funds. By monitoring the transitions of Flow between sectors, you can gain invaluable insights into the market cycle and the typical over and underperformances of assets that correlate to it. This information will help you to maximize portfolio efficiency by targeting different market sectors based on their performance to the overall cryptocurrency market. The index covers different sectors, including Large caps, Alts, Shit, Stables, AI, Defi, Dex, Exchange, Gaming, Meme, Metaverse, Nft, Privacy, Smart, and Sports.
Examples of Cryptocurrencies represented in the different market sectors:
Large caps: The biggest market cap cryptocurrencies such as BTC and ETH.
Alts: High-cap and high-volume digital assets that are smaller than large caps, such as LTC and XRP.
Shit coins: Smaller cap projects that are highly speculative and experience significant price volatility, such as BAT and HOT.
Stables: Fiat-pegged assets that provide a stable value, such as USDT and USDC.
AI: Projects that are based on artificial intelligence, such as FET and AGIX.
DeFi: Leverages high volume smart contract platforms to provide financial products in crypto, mainly ERC20 tokens such as LINK and AAVE.
DEX: Decentralized exchanges with their own utility tokens, such as UNI and SUSHI.
Exchange: Centralized exchanges with their own utility tokens, such as BNB and CRO.
Gaming: Web3/crypto gaming platforms with their own utility tokens, such as AXS and GMT.
Meme: Similar to shit coins, but with no real functionality and based purely on social media and memes, such as DOGE and SHIB.
Metaverse: Projects that aim to provide Metaverse assets such as virtual land and assets, such as MANA and SAND.
NFT: Non-fungible tokens with their own token or NFT-based platforms that have their own utility tokens, such as APE and LOOKS.
Privacy: Anonymous and privacy-focused chains, such as XMR and ZEC.
Smart: Projects that provide smart contract alternatives to ETH, such as ADA and AVAX.
Sports: Fan tokens based on real-world sports teams or platforms that support and distribute them, such as CHZ and FLOW.

BTC 4h bot 2.0 AlertsThis is Alert version of BTC 4h bot 2.0.
Optimized for pairs BTC vs stablecoins, 4h timeframe.
HOW IT WORKS:
Script is based on the fact that there are certain phases of the market when there is a greater probability that BTC will go to one side or the other. To evaluate which phase we are in, the script uses "Main trend" and "Confirmation signals".
Main trend
- Is composed of a combination of several supertrends and moving averages. A Supertrend is a trend following indicator that helps in identifying whether we are in an uptrend or a downtrend. A higher factor is used to capture the main trend and not just small movements. In case the market goes sideways, the Supertrend does not work well, so it is a combination of multiple supertrends along with moving averages to differentiate a real strong trend from a range.
- It can be seen on the graph as a thick solid line.
- In an uptrend is green, in a downtrend red, gray represents the neutral zone.
Confirmation signals
- Are several script-evaluated indicators such as RSI , MACD , ADX and others, which serve to confirm the trend. In this case, it is the opposite way to the Main trend. Confirmation signals are used here to detect small movements. They are trying to capture bullish and bearish price momentum.
- On the graph they are seen as dashed lines above or below the Main trend (in the gray zone they are in the middle).
- It indicates only two signals, green for buy and red for sell.
HOW TO USE IT:
if the Main trend and Confirmation signals are of the same color, it will send a buy or sell signal, depending on which phase of the trend it is in. If the Main trend is e.g. in an uptrend and the market is going up, Confirmation signals should generate a lot of signals. But if the market starts to go in the opposite direction, Confirmation signals should generate fewer signals or none at all, thus reducing the number of wrong trades. In the gray zone of the Main trend it does not open positions.
To close position is possible to use stop loss and take profit or alternative could be to set very high TP value, thereby letting the script close the positions by itself by Stop Long or Stop Short.
The recommended setting is:
TP: 3.9%
SL: 4.7%.
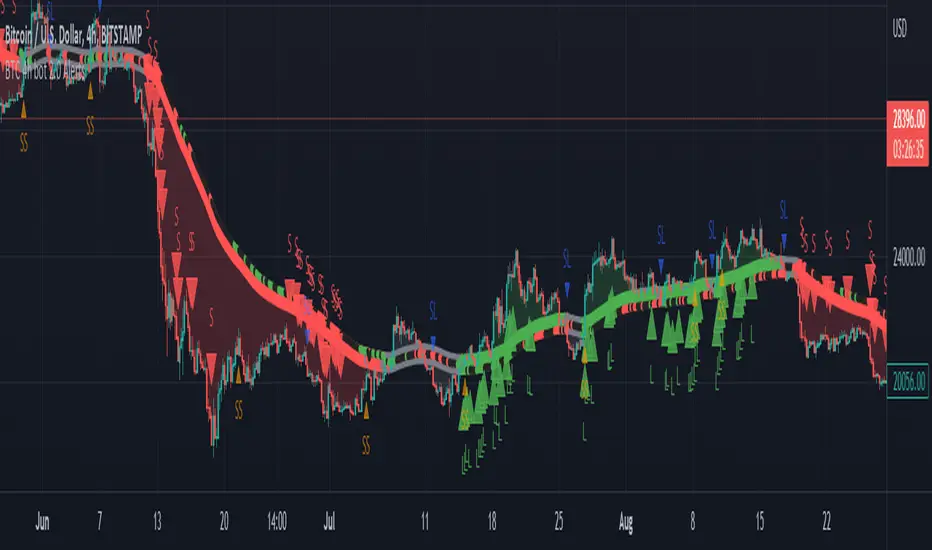
In this case, it is a Alert version, where can be seen all the signals, which the script generates.
Green triangels indicate open Long.
Red triangels indicate open Short.
Small blue triangels indicate Stop Long position.
Small orange triangels indicate Stop Short position.
Signal is valid after bar is closed, so do not open a position before.
Script works well on Bitstamp, but also other exchanges with pair BTC/USD or BTC/stablecoins.
The script works consistently well over a long period of time, using past probabilities, but this does not guarantee future results.
BTC 4h bot 2.0 StrategyThis is Strategy version of BTC 4h bot 2.0.
Optimized for pairs BTC vs stablecoins, 4h timeframe.
HOW IT WORKS:
Script is based on the fact that there are certain phases of the market when there is a greater probability that BTC will go to one side or the other. To evaluate which phase we are in, the script uses "Main trend" and "Confirmation signals".
Main trend
- Is composed of a combination of several supertrends and moving averages. A Supertrend is a trend following indicator that helps in identifying whether we are in an uptrend or a downtrend. A higher factor is used to capture the main trend and not just small movements. In case the market goes sideways, the Supertrend does not work well, so it is a combination of multiple supertrends along with moving averages to differentiate a real strong trend from a range.
- It can be seen on the graph as a thick solid line.
- In an uptrend is green, in a downtrend red, gray represents the neutral zone.
Confirmation signals
- Are several script-evaluated indicators such as RSI , MACD , ADX and others, which serve to confirm the trend. In this case, it is the opposite way to the Main trend. Confirmation signals are used here to detect small movements. They are trying to capture bullish and bearish price momentum.
- On the graph they are seen as dashed lines above or below the Main trend (in the gray zone they are in the middle).
- It indicates only two signals, green for buy and red for sell.
HOW TO USE IT:
if the Main trend and Confirmation signals are of the same color, it will send a buy or sell signal, depending on which phase of the trend it is in. If the Main trend is e.g. in an uptrend and the market is going up, Confirmation signals should generate a lot of signals. But if the market starts to go in the opposite direction, Confirmation signals should generate fewer signals or none at all, thus reducing the number of wrong trades. In the gray zone of the Main trend it does not open positions.
To close position is possible to use stop loss and take profit or alternative could be to set very high TP value, thereby letting the script close the positions by itself.
The default setting is:
TP: 3.9%
SL: 4.7%.
In this case, it is a strategy to find out how the script worked in the past period. The longest period in which it is possible to test BTCUSD is on the Bitstamp exchange. The script works consistently well over a long period of time, using past probabilities, but this does not guarantee future results.

Correlation prix [SP500, TESLA, BTCBefore you see this post I want to thank all the TradingView team. Every day that passes I learn better and better to use Pine script and I owe this to all those who publish and to the philosophy of TradingView. Thanks from Amos
This trading indicator compares the prices of the S&P 500 Index (SP500), Tesla (TSLA), and Bitcoin (BTC) to find correlations between them. To make the prices of SP500 and Tesla comparable to the price of Bitcoin, the indicator multiplies the closing price of Tesla by 114 and the closing price of the S&P 500 Index by 5.6.
In this way we can superimpose the prices on the BTC chart and see what happens.
Average BTC price/ tesla price = 114, so if we multiply the tesla price by 114 times we can superimpose it on the BTC price
At average BTC/SPX price = 5.6, also in this case we multiply the price of SPX by 5.6 to overlay the graph and see any correlations.
The indicator then calculates the average price between SP500 and Tesla, using the formula (SP500 + Tesla) / 2. This calculation creates a new line on the chart that represents the average price between these two assets.
The BTC_SP_TE variable is then calculated as the average of the closing price of Bitcoin and the previously calculated average price of SP500 and Tesla, using the formula (Btc + SP_TE) / 2. This calculation creates another line on the chart that represents the average price between Bitcoin and the previously calculated average between SP500 and Tesla.
The idea behind calculating these averages is to find correlations and patterns between the prices of these assets, which can help identify potential trading opportunities. By comparing the average prices of different assets, the trader can look for trends and patterns that might not be apparent when looking at each asset individually.
The indicator plots these prices on a chart and fills the area between them with either green or fuchsia, depending on which one is higher. The strategy suggests buying Bitcoin when the average price of SP500 and Tesla is higher than the current price of Bitcoin, and selling when it is lower.
To add visual cues to the trading strategy, the indicator uses the plotchar function to display a small triangle below the chart when it detects a potential buying opportunity. This is done with the following parameters:
Value: BTC_SP_TE < Btc and Btc > Btc1 and Btc1 > Btc , which is a logical expression that checks whether the average price of SP500 and Tesla is less than the current price of Bitcoin (BTC_SP_TE < Btc), and whether the current price of Bitcoin is higher than the price 10 bars ago (Btc > Btc1 ) and higher than the price on the previous bar (Btc1 > Btc ).
Text: "Moyen BTC_SP_Te", which is the text to display inside the marker.
Symbol: "▲", which is the symbol to use for the marker. In this case, it is a small triangle pointing upwards.
Location: location.belowbar, which specifies that the marker should be placed below the bar.
I hope this is an example of how to create an indicator on TradingView, remember that correlations do not always last, it is possible that when you see the graph this correspondence no longer exists, do your studies and get inspired.

Bitcoin Halving Rainbow + S2F Model PriceOverview
The rainbow price line:
This script creates a colorful view of Bitcoin's price action, where different colors indicate the time until the next halving date. The color scale in the top right highlights what each main color group represents in terms of days until the next halving. Using historical data, the simple indication of days until the next halving has somewhat accurately predicted potential bottoms and tops of market cycles. Comparing current colors to previous cycles provides a rough view of where BTC is in its current cycle and what to expect going forward until the next halving date.
In addition to the colored price action, I have incorporated the stock-to-flow model price for Bitcoin.
The stock-to-flow (S2F) model price:
The stock-to-flow ratio is a calculation that aims to estimate how many years are required to produce the current stock of an asset, based on the current production rate. When applied to Bitcoin, we simply divide the total amount of bitcoins in circulation by the amount of bitcoins mined in a certain timeframe. Once we have this value, we can calculate a model price based on the stock-to-flow ratio. This S2F model price uses a 463-day moving average. Preston Pysh came up with this number as he believed Bitcoin cycles happen in three phases: bull run, correction, and a reversion to the mean. He estimated there are about 200,000 blocks per cycle, three phases per cycle, and ~144 blocks per day. Dividing all three gets us 463. I have removed 1,000,000 coins from this calculation to account for Satoshi's coins.
The process I took to plot this model price (credit to PlanB for originally creating this calculation):
-Declare constant variables for the halving period, starting block reward, and the number of coins Satoshi owns.
-Fetch the block index by using the request.security() function.
-Determine the number of halvings that have occurred by dividing the block index by the halving period.
-Calculate the current block reward by multiplying the initial block reward by 0.5 raised to the power of the number of halvings.
-Calculate the number of blocks mined per period (day or week) and derive the stock (total bitcoins in circulation minus Satoshi's coins) and flow (annual block rewards) from it.
-Calculate the S2F ratio by dividing the stock by the flow.
-Calculate the S2F model price by applying a mathematical formula (ModelPrice = exp(-1.84) * S2F to the power of 3.36) along with a 463-day moving average.
** Please note, due to the use of the 463-day MA, the first ~400 days of the S2F model price is not entirely accurate.
In addition to the above, I have added vertical lines on each halving date, along with labels that have a tooltip if you hover over them, which will show more information about that particular halving.
Important tips:
-This script has been designed to work on the 1-Day timeframe but can also work on the 1-Week timeframe. Any other timeframe will not accurately plot all the information due to the way I have developed the script.
-This script is best used on the ticker I have posted this on, "INDEX:BTCUSD". It can also work on "BLX" or "BITSTAMP:BTCUSD".
-Hide candles when using the script to just show the halving rainbow (hover over the symbol name in the top left and press the eye icon).
-Right-click the price scale and select "Scale price chart only" to get a better view of the plots.
-Right-click the price scale and select "Logarithmic."
-I will update the script as time goes on to show future halvings along with adjusting the next halving date as we get closer (if it changes).
Settings Menu:
Tooltips are included explaining what the settings do, but here's a quick summary:
-'Show Vertical Halving Lines?': Default is true. This allows the user to remove the vertical lines shown on each halving date.
-'Show Halving Labels?': Default is true. This allows the user to remove the info labels shown on each halving date.
-'Halving Line and Label Color': Default is white. This allows the user to change the color of the halving lines and labels to better fit their chart layout.
-'Show Stock to Flow Model Price?': Default is true. This allows the user to remove the S2F model price.
-'Stock to Flow Model Price Color': Default is white. This allows the user to change the color of the S2F model price to better fit their chart layout.
-'Draw Color Table?': Default is true. This allows the user to remove the color table in the top right of the chart.
-'Distance rainbow is away from actual price action': Default is 0 (Plots over candles). This allows the user to adjust where the halving rainbow is plotted if they would like to also see candles on the chart. (Use any value under 0.9)
Feel free to message me or comment on the post with any questions or issues!
Much more to come!
Thanks for reading, enjoy!

Rsi strategy for BTC with (Rsi SPX)
I hope this strategy is just an idea and a starting point, I use the correlation of the Sp500 with the Btc, this does not mean that this correlation will exist forever!. I love Trading view and I'm learning to program, I find correlations very interesting and here is a simple strategy.
This is a trading strategy script written in Pine Script language for use in TradingView. Here is a brief overview of the strategy:
The script uses the RSI (Relative Strength Index) technical indicator with a period of 14 on two securities: the S&P 500 (SPX) and the symbol corresponding to the current chart (presumably Bitcoin, based on the variable name "Btc_1h_fixed"). The RSI is plotted on the chart for both securities.
The script then sets up two trading conditions using the RSI values:
A long entry condition: when the RSI for the current symbol crosses above the RSI for the S&P 500, a long trade is opened using the "strategy.entry" function.
A short entry condition: when the RSI for the current symbol crosses below the RSI for the S&P 500, a short trade is opened using the "strategy.entry" function.
The script also includes a take profit input parameter that allows the user to set a percentage profit target for closing the trade. The take profit is set using the "strategy.exit" function.
Overall, the strategy aims to take advantage of divergences in RSI values between the current symbol and the S&P 500 by opening long or short trades accordingly. The take profit parameter allows the user to set a specific profit target for each trade. However, the script does not include any stop loss or risk management features, which should be considered when implementing the strategy in a real trading scenario.

ChitukiProduced according to Bitcoin and Ethereum 1D, 1W, and 1M candle charts.
When you use it for general stock charts or altcoins, make sure to backtest it thoroughly before using it.
*To facilitate backtesting, this have a vertical line that allows you to easily specify the start time.😍
This indicator is simply based on the Engulfing patterns.
I focused on finding inflection points and wrote them based on 1D chart.
▲▼ Small and fat arrows: Displays simple engulfing patterns.
(Displays only those whose lengths differ by at least 1.2 times from each other)
↑↓ Slim and long arrows: Displays actual trading. (Backtesting reflects this.)
Compare the 7 lowest points to find the bullish Engulfing .
Compare the 14 highest points to find the Bearish Engulfing .
Switch the long and short positions to each other.
Long/short position entry at the market price, mid-price, and closing price of Engulfing Candles.
The charts from 2014 to January 2023 were back-tested and the error ranges were calculated and adjusted in detail.
In conclusion, you can think of it as an Engulfing Pattern Finder tailored to the Bitcoin chart.
This is how I did trading before I made this indicator, and I programmed the trading method as an indicator and I think it's pretty reliable but...
Please don't blindly trust ONLY the indicator(s).
///Properties setting Recommend///
Base currency : USD
Oder size : 18% of equity
Pyramiding : 21 (in plenty / Bcuz one deal is divided into three times.)
Commission : according to the exchange's commission
Recalculate : None
Margin : never less than 50%

Kimchi Premium StrategyThis strategy is based on the Korea Premium, also known as the “Kimchi Premium,” which indicates how expensive or cheap the price of Bitcoin in Korean Won on a Bitcoin exchange in South Korea is relative to the price of Bitcoin being traded in USD or Tether. Inverse Kimchi Premium RSI was newly defined to create a strategy with Kimchi Premium. Assuming that the larger the kimchi premium, the greater the individual's purchasing power. In this case, if the Inverse Kimchi Premium RSI falls and closes the candle below the bear level, a short is triggered. Long is the opposite.
This strategy defaults to a combination of the traditional RSI and the Inverse Kimchi Premium RSI. If the user wishes to unlock the Inverse Kimchi Premium RSI combination and only use it as a traditional RSI strategy, the following settings can be used.
Use Combination of Inverse Kimchi Premium RSI: Uncheck
Resolution: Chart (4hr Candle)
Source: Close
Length of RSI: 14
Bull Level: 74
Bear Level: 25
__________________________________________________________________________________
김치프리미엄(김프) 전략은 달러 혹은 테더로 거래되고 있는 비트코인 가격 대비 한국에 있는 비트코인 거래소의 비트코인 원화 가격이 얼마나 비싸고 싼 지를 나타내는 코리아 프리미엄, 일명 "김치 프리미엄" 지표를 기반으로 만들어졌습니다. 김치 프리미엄을 가지고 전략을 만들기위해 Inverse Kimchi Premium RSI를 새롭게 정의하였습니다. 김치 프리미엄이 커질수록 개인의 매수세가 커진다고 가정하고, 이 경우 Inverse Kimchi Premium RSI이 하락하여 Bear Level 아래에서 캔들 마감을 하면 Short을 트리거 합니다. Long은 그 반대입니다.
이 전략은 전통적인 RSI와 Inverse Kimchi Premium RSI을 조합하여 기본값을 설정하였습니다. 유저가 원한다면 Inverse Kimchi Premium RSI의 조합을 해제하고 전통적인 RSI 전략으로만 사용하려면 아래 다음의 설정값을 사용할 수 있습니다.
Use Combination of Inverse Kimchi Premium RSI: 체크 해제
Resolution: Chart (4hr Candle)
Source: Close
Length of RSI: 14
Bull Level: 74
Bear Level: 25

Dynamic Volume Oscillator [CryptoScripts]The Dynamic Volume Oscillator uses a combination of volume and momentum to nail whenever a reversal is likely to happen. I've also included divergences (both regular and hidden) that you can toggle on/off and adjust the settings to fit your trading style.
Colors - The green wave indicates an uptrend while the purple wave indicates a downtrend.
Overbought/Oversold - Green backgrounds indicate the DVO is oversold and a reversal to the upside is likely to happen within the next few candles. Red backgrounds indicate the DVO is overbought and a reversal to the downside is likely to happen within the next few candles. You can adjust the levels to trigger when the signal flashes. Experiment with different timeframes/altcoins to see which settings work best. Some coins are more volatile than others and lower timeframes tend to reach higher levels vs higher timeframes.
Divergences - The settings of 1 and 3 for the lookbacks are so the divergence signal appears only 1 candle before the actual divergence happens (on the replay tool) vs 4-5 candles from other indicators. This means your entry on a divergence signal is 2 candles after it prints (for backtesting purposes).
Alerts - I also added alerts for Overbought, Oversold, Regular and Hidden Bearish/Bullish Divergences.
Let me know if you have any questions! Enjoy :)

ATR Mean Reversion Strategy V1**Long Only Strategy**
When Price drops below the ATR band below it will enter a buy on the next candle open
SL at current price minus ATR* ATR multiplier
TP at Mean EMA or if higher than Mean EMA and current candle low is below previous candle low or if price is above ATR
NB: I would highly recommend a low fee broker (I use ICmarkets raw spread account) due to the fact that this is a decently high frequency trading strategy you will rack up a lot of commission, if you use and exchange like Bybit or Binance the strategy will not be profitable due to the high commissions.

Commercial FV PriceTrend V1Hello Traders ,
This is a trend trading Indicator where support and resistance and demand zone has been mentioned , It plots according to the trend change . Important point of the indicator is at time when we enter , just on the bases of buy and sell we enter and most of the time market takes out our SL or market reverses or trend changes , There comes the zones part and its functionality is mentioned in the images below and entry is only confirmed only when the candle penetrates inside the any of the zone be that be Resistance zone or Demand Zone and then breaks the low of the Zone (if trend is bearish) then only one can take short position and high of the zone should be the Stoploss ... Similarly if the trend is bullish and price is between Resistance and Demand Zone , if the price breaks the resistance and continue no long position can be taken , atleast for once it should penetrates back inside the Resistance Zone and then breaks the high of the zone that time long entry will become valid and low of the zone will be the Stoploss and 1:3 Risk Reward . By the way this can work with any type of market. However I concluded Intraday levels too which can be turned off according to user comfortability along with mean channel .
Aqua defines BULLISH TREND
RED defines BEARISH TREND
Rules for exit
lONG Exit= Candle closes below Zone Low
Short Exit =Candle closes above Zone high
-----------------
Disclaimer
Copyright by FaizanNawazz.
The information contained in my scripts/indicators/strategies/ideas does not constitute financial advice or a solicitation to buy or sell any securities of any type. I will not accept liability for any loss or damage, including without limitation any loss of profit, which may arise directly or indirectly from the use of or reliance on such information.
All investments involve risk, and the past performance of a security, industry, sector, market, financial product, trading strategy, or individual’s trading does not guarantee future results or returns. Investors are fully responsible for any investment decisions they make. Such decisions should be based solely on an evaluation of their financial circumstances, investment objectives, risk tolerance, and liquidity needs.
My scripts/indicators are only for educational purposes!
Happy Trading!
