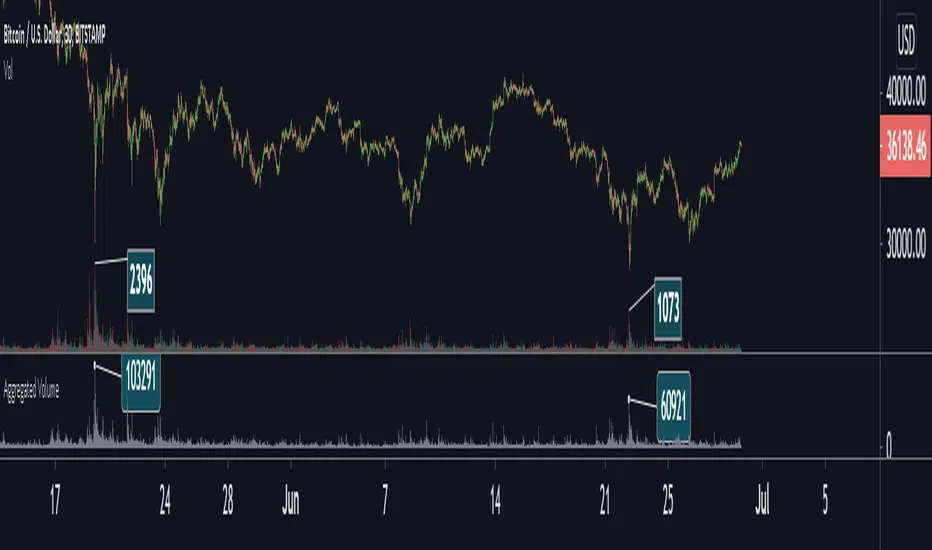
Aggregated VolumeBITSTAMP:BTCUSD
This indicator aggregates trading volume data of assets which are traded on multiple exchanges (like cryptocurrencies, commodities, forex and derivatives) to give you better insights on the markets.
You can change the markets from which the indicator gathers data in the settings under inputs.
By default, data is aggregated from the following markets:
Binance, BTC /USDT
Binance, BTC /BUSD
Bitfinex, BTC /USD
Coinbase, BTC /USD
Bingbon, BTC /USD
Bitstamp , BTC /USD
Kraken, XBT/USD
Gemini, BTC /USD
OkeX, BTC /USDT
Huobi, BTC /USDT
Btc!
InvictusHello,
I introduce my strategy that provide signals for entering in the market and signal for exit.
This indicator attempts to show a trader when is the best time to open a long or short position. The calculations are partially based on volatility, SMA, EMA and predefined values depending on used timeframe.
We collect data from comparing the current price, calculating the average move of the market, top, bottom and close of the latest bars. The middle line is an adaptive moving average, which is the base of the signals and we also use it as a Trend Line to determine if we are in long or short "condition". The basic idea of this indicator is to show the best place to open a Long or Short position and when to close it.
It is very simple - there are 2 type of signals - LONG (in green) and SHORT (in red). You can close your position when a TP (Take profit) shows up or based on your calculations.
You can chose from several options which strategy you want (there is a "Strategy" select in the settings). The strategies that are proving better according to our tests are marked with a diamond.
Don't forget to always trade with caution, trading is dangerous don't trade more than you can afford to lose.
Please contact me via personal message if you want to test the strategy or for more information.
Thank you.

Time Wolna_2021_iun3[wozdux] Description of the Time_Wolna indicator
The indicator is designed to study the behavior of time. There are many indicators that study just the price, a little less indicators that study the volume of trading and vanishingly few indicators that study time.
This is not an oscillator, it does not have oversold or overbought levels. This indicator has an indefinite beginning and an indefinite end. Its value is not in the absolute values of the indicator, but in relative ones. This indicator calculates the time of price rise and the time of price decline. It clearly shows how long the price rises and how long the price falls.
The initial idea was to use my RSIVol indicator to study the time. Each bar is counted as a unit of time. If the price rises during the period of one bar, then one is added, if the price falls, then one is subtracted. By default, the blue line shows this time movement according to the RsiVol indicator.
The basic RsiVol indicator is shown at the bottom of the diagram. The bill goes along the blue line, which calculates the movement of the volume price. If the blue RSIVol line is above the yellow level, then the blue Time_Wolna time line is colored green. If the blue line in the base RsiVol indicator falls below the lower yellow level, then the blue time line of the Time_Wolna indicator turns red.
The result is a broken line that clearly shows the waves of rising and falling prices. In principle, the time indicator makes it easier to recognize waves.
It is known that time plays an important role in Elliott wave analysis, although in practice this is almost never done. The mention of Elliott is just a lyrical digression.
Time is very difficult to study. This indicator does not give clear buy or sell signals. This is just an analysis tool to help analysts.
In addition to the RsiVol indicator, simply the Rsi from the price and a simple moving average from the price are also used.
So, the settings of this indicator.
"switch Price == close <==> ( High+Low)/2" -- select the base price in all subsequent calculations
"Key EMA=> True=ema(Price); False=ema(Price*Volume)" --The key for switching the moving average from the price or from the volume price.
"T==> EMA(price, T)" --The period for calculating the moving average
" key red==> Yes/No Rsi")--the key turns on or off the RSI line red line
"key green==> Yes/No Orsi") --the key turns on or off the Volume RSI line green line
" key olive==> Yes/No RsiVol200 " -- the key enables or disables the Volumetric RSIVol200 olive line. This is RsiVol minus the 200-period moving average.
"keyVol blue==> Yes/No " - the key enables or disables the base blue line RSIVol
"keyVol blue==> V->tt(RsiVol) ->tt(ema(Price))"—The blue line selection will be calculated as the time from RSIVol or as the time from the moving average EMA.
"keyVol blue==> : 1=Time, 2=Time* price, 3=Time*(Ci-Ck) 4=Time*Volume, 5=Time*price*Volume")- selection for the blue baseline. By default, the time of the price rise or fall is calculated simply. Key=1. But you can investigate the joint influence of time and price and then the key is=2. If we study the combined effect of time and price changes per bar, then the key=3. If we study the joint influence of time and volume, then the key=4. If we study the joint influence of time, price and volume, then the key=5.
"key RsiO red + green==> : 1=Time, 2=Time*Price, 3=Time*(Ci-Ck) 4=Time*Volume, 5=Time*Price*Volume") - - - similar settings for the red green line. By default, the time of the price rise or fall is calculated simply. Key=1. But you can investigate the joint influence of time and price and then the key is=2. If we study the combined effect of time and price changes per bar, then the key=3. If we study the joint influence of time and volume, then the key=4. If we study the joint influence of time, price and volume, then the key=5.
"Key Color – - here you can disable changing the color of the blue line to green or red when the base indicator RsiVol exits above the upper and below the lower levels.
"Level nul ==> * Down Level Rsi - screen configuration in order to raise or lower chart
"Level nul ==> * Down Level ORsi -- beauty setup in order to raise or lower chart
"Level nul ==> * DownLevel RsiVol200 -- beauty setup in order to raise or lower chart
"blue =volume * price" – period for calculation of volumetric rates
"blue => RSIVOL(Volume*price,len) and EMA" – the period for calculating RsiVol
"blue__o1=> ema ( RSIVOL, o1)" – additional smoothing RsiVol
"red=rsi (Price,14)" – the period for calculating Rsi
"red= ema ( RSI ,3)" -- additional smoothing Rsi
"fuchsia__ => RsiVol200 (vp,200)" - the period for calculating RsiVol200
"fuchsia__o2=> ema ( RSIVOL200 , o2)" -- additional smoothing RsiVol200
To study the time between two fixed dates. Setting the start point of the calculation and the end point of the calculation
"Data(0)=Year" – the year of the start date
"Data(0)= Month" – the month of the start date
"Data (0)=Day" the day of the start date
"Data(1)=Year" – the year of the end date.
"Data(1)=Year" – month of the end date.
"Data(1)=Day" -- the day of the end date.
--------русский вариант описания ------
Описание индикатора Time_Wolna
Индикатор призван изучать поведение времени. Есть много индикаторов изучающих просто цену, немного меньше индикаторов изучающих объем торгов и исчезающе мало индикаторов, изучающих время.
Это не осциллятор у него нет уровней перепроданности или перекупленности. Данный индикатор имеет неопределенное начало и неопределенный конец. Ценность его не в абсолютных значениях индикатора, а в относительных. Этот индикатор высчитывает время подъема цены и время снижения цены. Он наглядно показывает сколько времени цена поднимается и сколько времени цена опускается.
Первоначальная идея была использовать мой индикатор RSIVol для изучения времени. Каждый бар считается за единицу времени. Если цена поднимается за период одного бара, то прибавляется единица, если цена опускается, то вычитается единица. По умолчанию голубая линия показывает такое движения времени по индикатору RsiVol.
Внизу на диаграмме показан базовый индикатор RsiVol. Счёт идет по синей линии, которая вычисляет движение объемной цены. Если синяя линия RSIVol находится выше желтого уровня, то голубая линия времени Time_Wolna окрашивается в зеленый цвет. Если синяя линия в базовом индикаторе RsiVol опускается ниже нижнего желтого уровня, то голубая линия времени индикатора Time_Wolna окрашивается в красный цвет.
В результате получается ломанная линия, четко показывающая волны восхождения и снижения цены. В принципе индикатор времени позволяет легче распознавать волны.
Известно, что время играет важную роль в волновом анализе Эллиотта, хотя на практике это почти никогда не делается. Упоминание Эллиотта это просто лирическое отступление.
Время очень трудно изучать. Этот индикатор не дает четких сигналов на покупку или продажу. Это всего лишь инструмент анализа в помощь аналитикам.
Кроме индикатора RsiVol, используются и просто Rsi от цены и простая скользящая средняя от цены.
Итак, настройки данного индикатора.
"switch Price == close <==> ( High+Low)/2" -- выбираем базовую цену во всех последующих вычислениях
"Key EMA=> True=ema(Price); False=ema(Price*Volume)" --Ключ переключения скользящей средней от цены или от объемной цены.
" T==> EMA(price,T)"--Период вычисления скользящей средней
"key red==> Yes/No Rsi")--ключ включает или выключает линию RSI красная линия
"key green==> Yes/No Orsi") --ключ включает или выключает линию Объемной RSI зеленая линия
"key olive==> Yes/No RsiVol200" -- ключ включает или выключает линию Объемной RSIVol200 оливковая линия. Это RsiVol минус 200-периодная скользящая средняя.
"keyVol blue==> Yes/No " – ключ включает или выключает базовую голубую линию RSIVol
"keyVol blue==> V->tt(RsiVol) ->tt(ema(Price))"—выбор голубая линия будет вычисляться как время от RSIVol или как время от скользящей средней EMA.
"keyVol blue==> : 1=Time, 2=Time* price, 3=Time*(Ci-Ck) 4=Time*Volume, 5=Time*price*Volume")—выбор для голубой базовой линии. По умолчанию вычисляется просто время подъема или опускания цены. Ключ=1. Но можно исследовать совместное влияние времени и цены и тогда ключ=2. Если изучаем совместное влияние времени и изменения цены за один бар, то ключ=3. Если изучаем совместное влияние времени и объема, то ключ=4. Если изучаем совместное влияние времени, цены и объема, то ключ=5.
"key RsiO red + green==> : 1=Time, 2=Time*Price, 3=Time*(Ci-Ck) 4=Time*Volume, 5=Time*Price*Volume") ---аналогичные настройки для красной зеленой линии. По умолчанию вычисляется просто время подъема или опускания цены. Ключ=1. Но можно исследовать совместное влияние времени и цены и тогда ключ=2. Если изучаем совместное влияние времени и изменения цены за один бар, то ключ=3. Если изучаем совместное влияние времени и объема, то ключ=4. Если изучаем совместное влияние времени, цены и объема, то ключ=5.
"Key Color" – здесь можно отключить изменение цвета голубой линии на зеленый или красный в моменты выхода базового индикатора RsiVol выше верхнего и ниже нижнего уровней.
"Level nul ==> * Down Level Rsi - косметическая настройка для того, чтобы поднять или опустить график
"Level nul ==> * Down Level ORsi -- косметическая настройка для того, чтобы поднять или опустить график
"Level nul ==> * DownLevel RsiVol200 -- косметическая настройка для того, чтобы поднять или опустить график
" blue =>volume * price" – период для вычисления объемной цены
" blue => RSIVOL(Volume*price,len) and EMA" – период для вычисления RsiVol
"blue__o1=> ema ( RSIVOL, o1)" – дополнительное сглаживание RsiVol
" red=rsi (Price,14)" – период для вычисления Rsi
" red= ema ( RSI ,3)" -- дополнительное сглаживание Rsi
"fuchsia__ => RsiVol200 (vp,200)" -- период для вычисления RsiVol200
"fuchsia__o2=> ema ( RSIVOL200 , o2)" -- дополнительное сглаживание RsiVol200
Для исследования времени между двумя фиксированными датами. Задаем начальную точку вычисления и конечную точку вычисления
"Data(0)=Year" – год начальной даты
"Data(0)= Month" – месяц начальной даты
"Data(0)=Day" день начальной даты
"Data(1)=Year" – год конечной даты.
"Data(1)=Year" – месяц конечной даты.
"Data(1)=Day" -- день конечной даты.

mark strategy2 divergence bot v0.5 for xbtusdHi first of all thanks for read this.
This is my second strategy for make trading, I optimized it for xbtusd with 30 min charts.
You can personalize some setting for reach a better result then me, these are the setting:
this script is only for long trade, so bearish divergence don't work
1)ema1
U can change this value for use another ema and use a faster or slower trend
2)ema2
U can change this value for use another ema and use a faster or slower trend
3)pivot right
U can change this value for watch a number of bar on your right
4)pivot left
U can change this value for watch a number of bar on your left
5)high range
U can change this value for watch a max number of bar
6)low range
U can change this value for watch a min number of bar
7)bullish
U can change this value for enable signal with bullish divergence
8)hidden bullish
U can change this value for enable signal with hidden bullish divergence
9)bearish
U can change this value for enable signal with bearish divergence
10)hidden bearish
U can change this value for enable signal with hidden bearish divergence
11)profit 1 %
U can change this value for the first take profit target
12)profit 2 %
U can change this value for the second take profit target
13)qty target 1 %
U can change this value for close a % of your trade at target 1
14)loss %
U can change this value for close the trade at a % of loss
Have nice day and send me a message if u will earn with my strategy.
If u want my code send me a message
for info send me a message

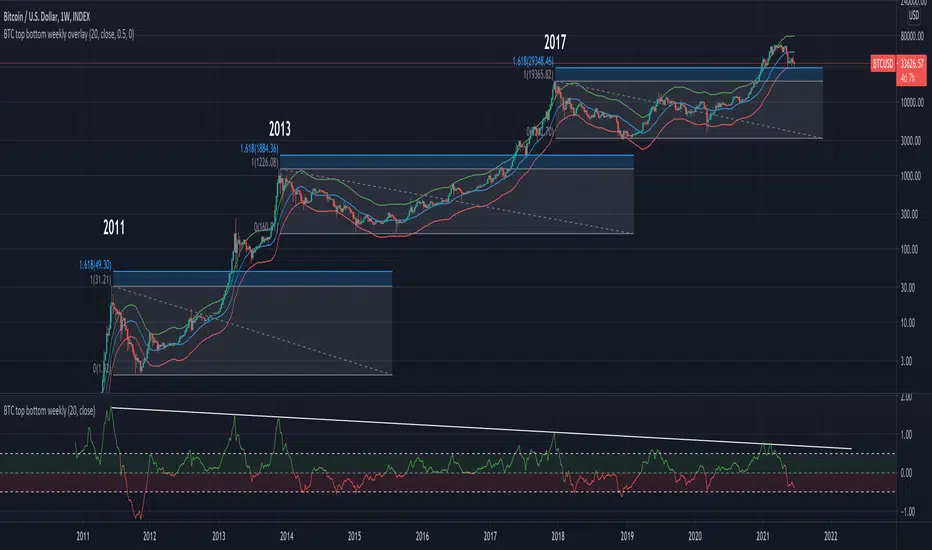
BTC top bottom weekly bandsThis indicator is based on the 20 weekly simple moving average and it could be used to help finding potential tops and bottoms on a weekly BTC chart.
When using the provided "coef" parameter set to the default of 0.5 it shows how most bottoms since 2013 have hit the lower band of this indicator.
The lower band is calculated as exp(coef) * sma(close)
Instructions:
- Use with the symbol INDEX:BTCUSD so you can see the price since 2010
- Set the timeframe to weekly
- Use logarithmic chart (toggle "log" on)
Optionals:
- change the coef to 0.6 for a more conservative bottom
- change the coef to 0.4 for a more conservative top
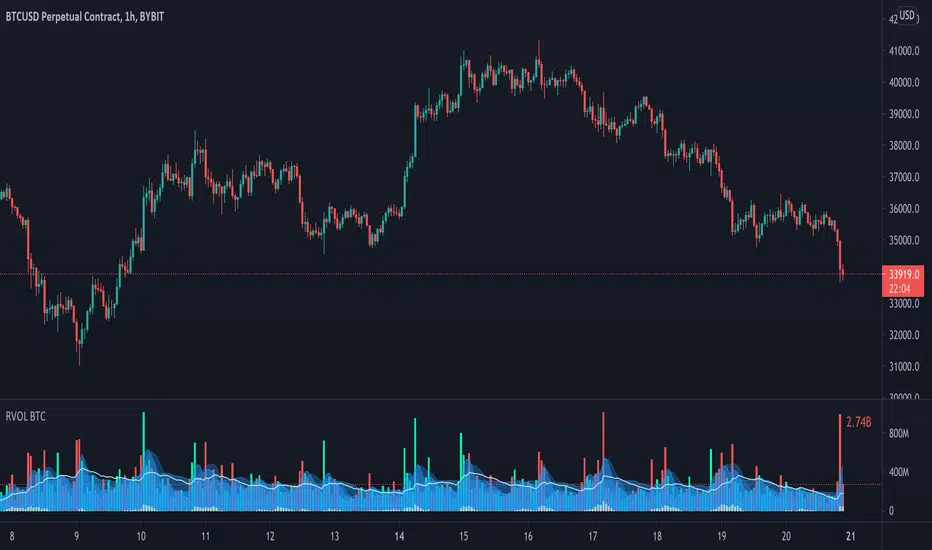
Relative Volume - BITCOINRelative Volume indicator that pulls data from 9 different Bitcoin exchanges. Please note that this indicator only works with BTC and will not use data from your current chart.
Includes the following exchanges:
BYBIT:BTCUSD
BITFINEX:BTCUSD
BITSTAMP:BTCUSD
INDEX:BTCUSD
COINBASE:BTCUSD
FTX:BTCUSD
PHEMEX:BTCUSD
BITTREX:BTCUSD
POLONIEX:BTCUSDT
CryptoSignalScanner - MACD Multiple Time FramesDESCRIPTION:
After receiving some multiple request to provide a MACD indicator that displays multiple timeframes at the same time I created this simple script.
You can use this script for free and adjust it as much you like.
With this script you can plot 6 MACD lines & 6 Signal lines.
• Current Timeframe MACD Line
• Current Timeframe Signal Line
• 15 minute candle MACD Line
• 15 minute candle Signal Line
• 30 minute candle MACD Line
• 30 minute candle Signal Line
• 1 hour candle MACD Line
• 1 hour candle Signal Line
• 2 hour candle MACD Line
• 2 hour candle Signal Line
• 4 hour candle MACD Line
• 4 hour candle Signal Line
HOW TO USE:
• When multiple MACD lines on an uptrend are grouped together it is time to SELL.
• When multiple MACD lines on a downtrend are grouped together it is time to BUY.
• The higher to length of the MACD lines the stronger the BUY/SELL signal.
FEATURES:
• You can show/hide the preferred MACD lines.
• You can show/hide the preferred Signal lines.
How MACD works
The MACD indicator is generated by subtracting two exponential moving averages (EMAs) to create the main line (MACD line), which is then used to calculate another EMA that represents the signal line. In addition, there is the MACD histogram, which is calculated based on the differences between those two lines. The histogram, along with the other two lines, fluctuates above and below a center line, which is also known as the zero line.
The MACD indicator consists of three elements moving around the zero line:
• The MACD line. By default the MACD line is calculated by subtracting the 26-day EMA from the 12-day EMA.
MACD line = 12d EMA - 26d EMA
• The signal line. By default the signal line is calculated from a 9-day EMA of the MACD line.
Signal line = 9d EMA of MACD line
• Histogram. The histogram is nothing more than a visual record of the relative movements of the MACD line and the signal line.
It is simply calculated as: MACD line - signal line
REMARKS:
• This advice is NOT financial advice.
• We do not provide personal investment advice and we are not a qualified licensed investment advisor.
• All information found here, including any ideas, opinions, views, predictions, forecasts, commentaries, suggestions, or stock picks, expressed or implied herein, are for informational, entertainment or educational purposes only and should not be construed as personal investment advice.
• We will not and cannot be held liable for any actions you take as a result of anything you read here.
• We only provide this information to help you make a better decision.
• While the information provided is believed to be accurate, it may include errors or inaccuracies.
Good Luck,
SEOCO

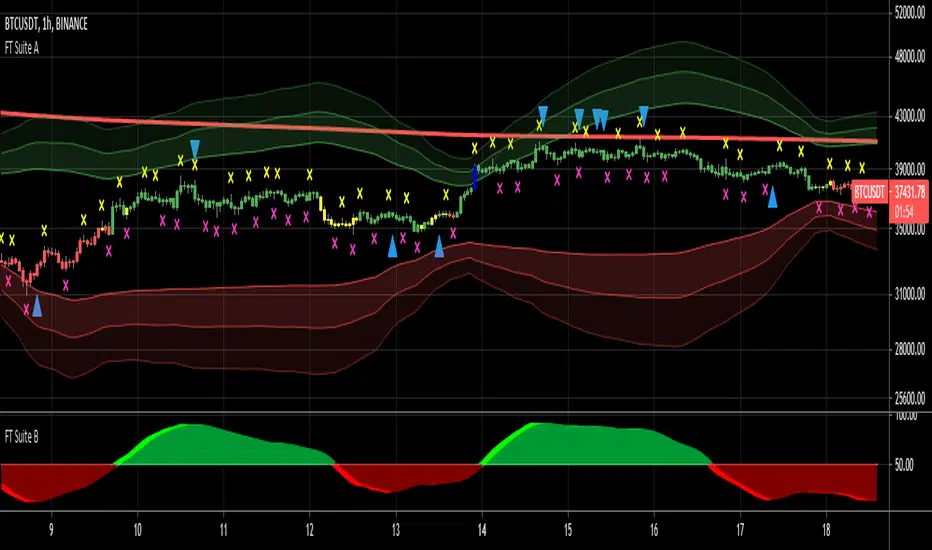
FieryTrading Suite AThis trading suite offers a complete package to traders, both long- and short-term. The idea here is that by combining FieryTrading Suite A and B, one can get a better grip on the markets, thus making more profitable trades. This trading suite is suited for all time frames and assets. Ideally one would combine this trading suite with their own strategies or indicators.
This indicator pack consists of several parts and offers quite some customization.
// FieryTrading Suite A
Bar Trend: the bars will get colored according to the current, short-term, trend. Green is bullish, red is bearish and yellow is neutral. By tweaking the Bar Trend Length one can make the bar trend more or less responsive. Higher lengths are better for long term trading, whereas a shorter length is better for short-term or scalping.
MTF EMA: this is actually two indicators in one. First, we have the EMA on the chart, which is a general current trend indicator. Above the EMA means bullish, under the EMA means bearish. This EMA is also colored according to the long-term trend, which gets pulled from a higher time-frame. Green means long term bullish, red long-term bearish, yellow neutral.
Overshoot Area: the green and red bands around the price are areas where the price might potentially reverse from. This works exceptionally well in consolidating (horizontal) markets. The wider the overshoot area, the stronger the trend. A very tight overshoot area might indicate that the price will soon make a strong move. Increase the overshoot length to make it better suited for long-term. Decrease the length for better detection of small moves.
Extra’s:
1) Extreme bars: when turned on, the bars will color blue if the price reaches a potential strong area of reversal or consolidation. Blue bars are also great areas to exit your current position. Increase the Extreme Multiplier in case you want it less responsive. Decrease the multiplier to quicker spot extreme bars, but with a higher margin of error.
2) FieryTrend: due to its popularity, I’ve decided to included my FieryTrend indicator in the Trading Suite. It’s a great tool to manually find trend lines, resistances and supports. See my FieryTrend indicator for more info.
3) Fractals: when turned on, this option will display fractals on the chart. These fractals are mainly used for stop-loss determination, but can be used for other strategies as well.
4) FT B Reversal: when turned on, this will place reversals of the FieryTrend Suit B on the chart. Make sure to keep the inputs of the FT B indicator the same on both the A and B suite. It might trigger some false-positives, don’t trade this blindly. Wait for the lighter color to completely disappear behind the darker one on FT B.
Alerts: Alerts can be created for Extreme Bars, Bar Trend and FieryTrading Suite B Reversals. Bar trend currently triggers an alert of every bullish / bearish bar, want to make it trigger once in the future, but I’m encountering an unknown bug.
// FieryTrading Suite B
This oscillator tries to give traders an idea of the current trend, as well as trend reversals. The higher the lengths, the bigger the potential trends can become. Be aware that higher lengths are less responsive to market movements. The default inputs are best for most traders. Alerts for this indicator can be made in the FT Trading Suite A, indicated by the blue up / down triangles.
// Potential strategies
There are several potential strategies that one can follow by just looking at the chart. Here are some examples:
1.0 For longer term trades one could simply trade the bar colors. Buy when the bar goes green, sell when it goes red.
1.1 You could exit the trade at either an Extreme Bar or when the price enters the Overshoot Area
1.2 During bullish trends (green bars, green MTF EMA), you could spot potential entries with the FieryTrading Suite B. Enter on every dip on the oscillator. Inverse would be true for shorts.
2.0 You could trade the FT B Reversals during their respective trend. So, trade bearish reversals during a red MTF EMA, bullish reversals during a green MTF EMA.
Never trade one indicator naked. Always use other indicators to confirm your bias.
For take-profit and stop-loss selection I would generally advise to look at the most recent fractal and place the stop above / below the fractal bar. Bullish trades should look at the pink fractal, bearish trades at the yellow fractal. When no fractal is available, look at the reversal bar and apply the same strategy.
For short term trades I’d advise a risk-reward of 1.5, longer term 2 – 2.5.
See the screenshots below for a couple of examples.
For access, please take a look at the "Author's Instructions" below.
BTC Dominance & Counter-Trend IndicatorThis script looks at BTC dominance in price-action and scores it (out of the last 100 closed bars). Essentially this looks at the price action of the current security/crypto and tracks whether it traded in-trend with BTC or against the trend with BTC to show when BTC is most prominently dominating.
Currently the code is restricted to the previous 100 trades prior to the bar (you can change this) but only because, for whatever reason, pine scripting doesn't actually allow you to calculate the number of bars currently in the view (lots of people asking for this via StackOverflow but no response yet). Essentially every bar shows the number of trades out of the last 100 that traded in-synch with BTC, the lower the number, the less dominant BTC has been against that security.
Green highlight means it traded positive (upwards) against BTC going down, and red means it traded negative against BTC going up.

Low Timeframe POCI have recently made a High Timeframe POC script (HFT POC) which is pretty popular. Thanks for this!
There are many requests to include lower timeframes in this script, that is why I created this script. I could have incorporated all the timeframe POC's into one indicator but I went this route to keep things more organized between all the different timeframes.
Currently included: Daily, 6H, 3H and 1H
/* DEFINITION */
Point Of Control (= POC) is a price level at which the heaviest volumes were traded.
/* HOW TO TRADE WITH THIS INDICATOR */
The basis for POC is determining bias on whichever timeframe you choose.
1. Identify a POC on the timeframe of your choosing.
/* If you choose the lowest timeframe (1H here) then always make sure to look at the higher timeframes to see how it is trading against a HTF POC.
2. When the price is moving away from the POC (either to the upside or downside) this can confirm or invalidate a trade.
3. You can now enter the trade on bias or wait for a retest of the same POC.
/* EXAMPLE TRADES /*
Here is a screenshot of some of the trades that are possible using these Low Timeframe POC's and some common sense.
s3.tradingview.com

Hunt Bitcoin CoT Buy/Sell signalWhy Bother another CoT signal?
Its different & focused on the Insider's.
Performance -
This Indicator provided a
1. Signal 1 = 26th March 2019 = SUPER LONG at $4,500 that saw a near $14,000 run up
2. Signal 2 = 18th & 24th June 2019 = SHORT at the second & final level $11,700 after repeated attempts & failure in the $13K range, the mini Echo Bitcoin Bull of 2019
3. Signal 3 = 17th December 2019 = LONG $6,900, Bitcoin rallied to Mid $10,500's
4. Signal 4 = 18th Feb 2020 = SUPER SHORT from $9,700's to a final extreme Low of $3,000, calling the CV-19 collapse
5. Signal 5 = 17th March 2020 = LONG from $5,400 no closure point yet
6. Signal 6 = 29th June 2020 = SUPER LONG reiterate from $10,700 no closure sell signal yet
7. Signal 7 = 17th May 2020 = LONG another accumulate LONG with no sell signal yet generated at Post H&S's low of $33,000
Note - This indicator only commences March 2019, as Bitcoin futures were a recent introduction and needed to settle for 6 months in both use and data, no signals were meaningful prior & data was light.
What is Provided. - Please note the need to also add the Hunt Bitcoin Historical Volatility Indicator for full understanding.
We provide 3 things with the 3 indicators.
'Insider' indications from Largest players in the futures market.
1. Bitcoin Macro Buy Signals.
a) The Bitcoin Commitment of Traders results see us focus solely on Largest 4 Short Open Interest & Largest 4 Long Open Interest aspects of the CoT Release data.
When the difference - is tight, a kind of pinch, these have been great Buy signals in Bitcoin.
We call this difference the Delta & When Delta is 5% or less Bitcoin is a Buy.
2. Bitcoin Macro Sells.
a) A sell signal is Triggered in Bitcoin at any point the Largest 4 short OI > or = to 70
3. AMPLIFIER Trade signals 'Super' Longs or Shorts -
Extreme low volatility events leads to highly impulsive & volatile subsequent moves, if either of 1 or 2 above occur, combined with extreme low volatility
a 'Super Long' or 'SUPER SELL' is generated. In the case of the short side, given Bitcoins general expansive and MACRO Bull trend since inception, we seek an additional component
that is an extreme differential/Delta reading between 4 biggest Longs & Shorts OI.
Namely CoT Delta also must be > 47.5%
We also have a Cautionary level, where it is not necessarily a good idea to accumulate Bitcon, as a better opportunity lower may avail itself, see conditions below.
So the required logic explicitly stated below for all Signals.
1. Long - Hunt Bitcoin CoT Delta < or = 5
2. SUPER Long - Hunt Bitcoin CoT Delta < or = 5; and 2 Day Historical Bitcoin Volatility = or < 20
3. Short - Largest 4 Sellers OI = or > 70
4. SUPER Short - Largest 4 Sellers OI = or > 70; AND..
Hunt Bitcoin CoT Delta = or > 47.5 AND 2 Day Historical BTC Volatility = or < 20
5. Caution - Largest 4 Sellers OI = or > 67.5 AND Hunt Bitcoin CoT Delta = or > 45
WARNING SEE Notes Below
Note 1 - = Largest 4 Open Interest Shorts
Note 2 - = Largest 4 Open Interest Longs
Note 3 - = Hunt Cot Delta = (Largest 4 sellers OI) -( Largest 4 Buyers OI)
Caution = Avoid new Bitcoin Accumulation Right Now, A sell signal might follow Enter on next Long
Note 4 - The Hunt Bitcoin COT Delta signal is a Largest 'Insider' Tracking tool based on a segment of Commitment of Traders data on Bitcoin Futures, released once a week on a Friday.
It is a Macro Timeframe signal , and should not be used for Day trading and Short Timeframe analysis , Entries may be optimised after a Hunt Bitcoin CoT Signal is generated by separate shorter Timeframe analysis.
Note 5 - The Historical Bitcoin Volatility is an additional 'Amplifier' component to the 'Hunt Bitcoin Cot Delta' Insider Signal
Note 6 - The Historical Bitcoin Volatility criteria varies by timeframe, the above levels are those applying on a Two Day TF Chart, select this custom timeframe in Trading View.
if additional criteria are met for LONG & SHORT insider signals, they may become 'Super Longs/Shorts', see conditions box above.

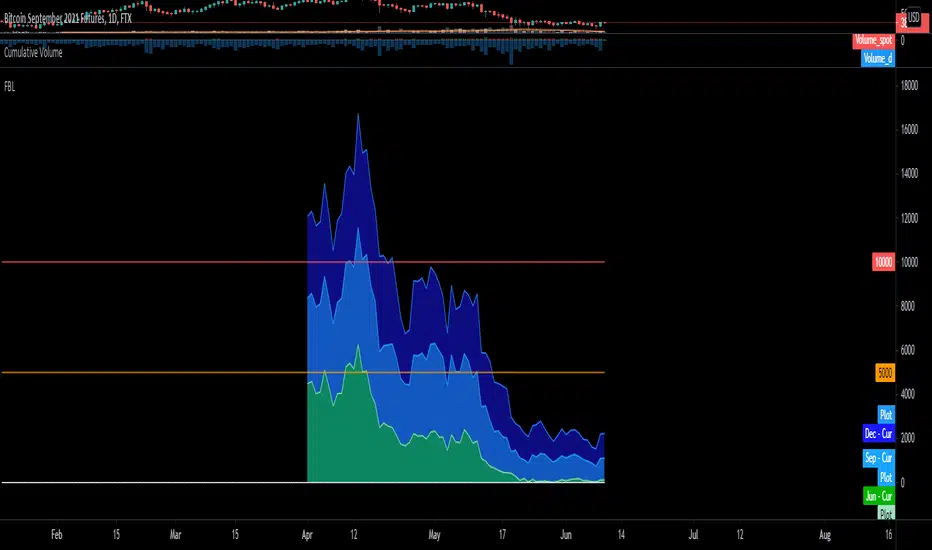
BTC FTX Futures PremiumsThis indicator shows the future BTC premiums on FTX.
The purple area is the Daily December Futures contract subtracted by the current price.
The blue area is the Daily September futures contract subtracted by the current price.
The green area is the Daily June futures contract subtracted by the current price.
You can use this to try and understand market sentiment.
If the current price dumps but the premium remains the same it likely means that sentiment is unchanged.
The opposite is true, if the price pumps and the premium is the same it means the market likely wasn't convinced by the movement.
The difference between the current price and the futures price can help determine how bullish or bearish a market or at extremes the level of euphoria.
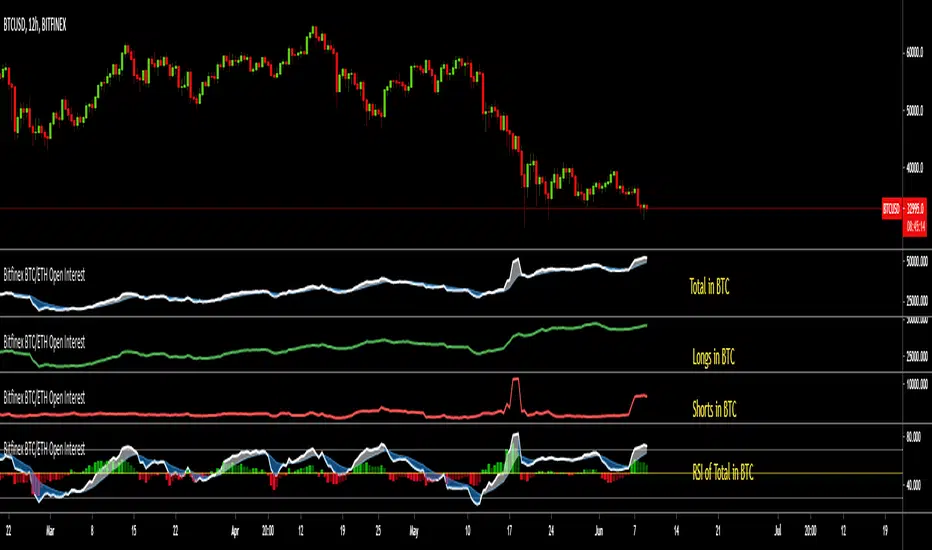
Bitfinex BTC/ETH Open InterestThe Bitfinex Exchange is providing the Open Long and Short positions as data feeds in Tradingview. This information can be valuable in order to judge how the big players are positioned.
This indicator allows to analyze this Bitfinex Open Interest data for BTC and ETH. By default it shows the Total Open Interest (Longs + Shorts) in BTC. A 10 period EMA is applied to the data.
The following alternative displays are available:
- Show ETH instead of BTC
- Show Long positions separately
- Show Short Positions separately
- Show the results in USD (Number of coins multiplied by period closing price)
- Show RSI instead of absolute value (see below)
Instead of displaying the absolute value, it is possible to show the RSI (current default length is 20) to make the changes easier visible. If RSI display is selected, then the Overbought, Oversold and Middle Line are shown automatically. Additionally a histogram is displayed which shows the difference between the RSI and the EMA of the RSI.
FTX BTC Move Trend [Ryto]
This indicator helps intuitively see the trend between FTX move contract's strike price (Daily or Weekly) and the index price of BTC.
Blue curve: FTX BTC index price.
Red curve: 00:00:00-00:59:59 UTC+00:00 BTC index price TWAP.
Orange curve: 23:00:00-23:59:59 UTC+00:00 BTC index price TWAP.
Grey curve: The strike price of a move contract.
When the blue curve is near the grey curve, that represents the current index price is near to the strike price of a move contract. Cooperate with other indicators and observe the BTC trend also consider move contract price to decide whether to buy or sell.
Note: Should use the timeframe lower than 5 minutes, to ensure the correct TWAP price.
Reference:
- help.ftx.com
- help.ftx.com
- www.tradingview.com
---------------------------------------------------------------------------------------------------------------------------------------------------------------
這個指標適用在觀察 FTX 波動率產品 (日與週波動率合約),可以更直覺的看出 FTX BTC 指數價格與波動率產品行權價的走勢關係。
藍色曲線: BTC 指數價格
紅色曲線: 00:00:00-00:59:59 UTC+00:00 BTC 指數價格之時間加權平均
橘色曲線: 23:00:00-23:59:59 UTC+00:00 BTC 指數價格之時間加權平均
灰色曲線: 波動率產品行權價
當藍色曲線在灰色曲線附近,代表此時指數價格在行權價附近,配合其他指標觀察 BTC 走勢與波動率價格來決定是否買入或賣出波動率。
注意: 需使用時匡為 5 分鐘以下,確保指數價格之時間加權平均計算正確。
參考:
- help.ftx.com
- help.ftx.com (MOVE 合约)
- Pine 腳本時匡限制

PineGIF - Display Gifs & Images In Tradingview [LuxAlgo]Pinescript is not designed to create or display images, let alone gifs, but it's very fun to try, and that's what this script does. This script allows the user to display three different gifs. In this post, we explain how we managed to display images/gif's using pinescript tables.
1. Image Pre-Processing
Due to pinescript limitations, we can't possibly display images with an excessively high resolution. As such we targeted pixel art as a primary image source. We used a pixel art gif of the magnificent Octocat (the mascot for the source-code hosting service GitHub) for our first try.
We first extract each frame from the gif and resize them to a 50x50 resolution which returns frames made of 2500 pixels. This process was done using python.
Getting Individual Pixels RGBA Values
Python can easily return a matrix containing each pixel's rgba value. For convenience, we converted the rgba values to hex.
We then create a simple code allowing us to return a pinescript array containing the 2500 pixel hex colors. We do this process for each frame.
2. Defining Table Cell Color
In the code, each frame is its own array. We create a new table with dimensions equal to len(frame1)^2 (we assume height = width).
The color of a cell is defined by the color of the image pixel at the same exact location. When a new bar is created, we do this exact process using a different frame which ultimately allows a new frame to be displayed.
3. Playing The GIFs
By default, the script will play the gif of the Tradingview cloud logo raining. In order to play the gif, simply use the replay mode. The replay speed allows the user to determine the frame rate (0.1 for the raining cloud and Nyan cat works best, 0.5 for Octocat).
We included the frames of the Octocat and Nyan cat gifs in the script.
4. Some Other Cool Images
Displaying static images is possible and involves the same process described above.
An original idea of the lizard, implemented by the wizard.

BTC COT Delta BBitcoin CME COT Delta Strategy
---------------------------------------
Reading 4 largest long positions and 4 largest short positions, this script uses (shorts - longs) to produce a long/short signal.
• When delta <= buy threshold, a "long" signal will appear on the chart.
• When shorts >= sell threshold, a "short" signal will appear on the chart.
To see the indicator below, since it's not possible to mix the two, use this script:
** This is not a trading advice, it's for research purposes only. Do not trade based upon these signals.

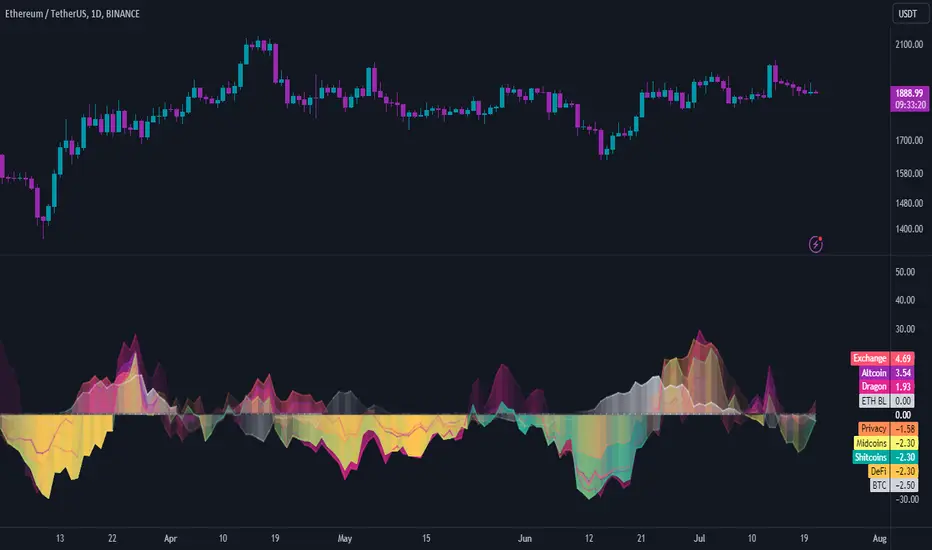
INDICES against BTC & ETHThe idea is the following; you can easily chart the FTX perp indices against (currently) two baselines, ETH & BTC.
I always choose ETH since it is way harder to outperform ETH at the moment. Doing this helps me see certain trends and/or fractal that might happen again in the future.
Since I already made D.A.M (Defi against Majors / Pricing Defi categories against BTC & ETH: ) I came across the idea of doing the same thing but with the perp indices that FTX offer. At first, I wanted to add this to D.A.M but it has no place in this indicator since this will not only look at Defi but the macro market as a whole.
The indicator currently only looks at the following indexes (weighting can be found here: https:// help. ftx. com/hc/en-us/articles/360027668812-Index-Calculation) :
DRGN: THE DRAGON INDEX
ARPA, BTM, IOST, NEO, NULS, ONT, QTUM, TRX, VET
ALT: ALTCOIN INDEX
BCH, BNB, EOS, ETH, LTC, XRP, TRX, DOT, LINK, ADA
MID: THE MID CAP INDEX
ALGO, ATOM, BAT, CRO, DASH, DCR, DOGE, HT, IOTA, LEO, NEO, OKB, ONT, QTUM, VET, XEM, XLM, XMR, XTZ, ZEC, ZRX, OMG, COMP, BSV, FTT, YFI, UNI, SNX, MKR, AAVE
SHIT: THE SHITCOIN INDEX
AE, AION, ARDR, ARPA, BCD, BEAM, BTG, BTM, BTS, BTT, CHZ, CKB, DGB, ELF, ENJ, GNT, GRIN, GT, HBAR, HC, ICX, IOST, KMD, KNC, LAMB, LRC, LSK, MANA, MATIC, MCO, NANO, NULS, OMG, POWR, PUNDIX, REN, REP, RVN, SC, SNT, STEEM, THETA, TOMO, VSYS, WAVES, XVG, XZC, ZEN, ZIL, ZRX
PRIV: THE PRIVACY INDEX
BEAM, DCR, GRIN, KMD, XMR, XVG, XZC, ZEC, ZEN
DEFI: THE DECENTRALIZED FINANCE INDEX
KNC, MKR, ZRX, REN, REP, SNX, COMP, TOMO, RUNE, CRV, DOT, LINK, MTA, SOL, CREAM, BAND, SRM, SUSHI, SWRV, AVAX, YFI, UNI, WNXM, AAVE, BAL
High Timeframe POCBecause the big Bitcoin crash I have been looking a lot at high timeframe metrics. I never spent much time learning POC so I decided to create a little script for determining these on higher timeframes.
Currently included: Monthly, 3 months and 6 months.
/* DEFINITION */
Point Of Control (= POC) is a price level at which the heaviest volumes were traded.
Value Area High/Low (=VAH/VAL) is a range of prices where the majority of trading volume took place. Naturally, Value Area High being the top price level and Value Area Low being the lowest. POC always is between the two.
/* HOW TO TRADE WITH THIS INDICATOR */
The basis for POC is determining bias on whichever timeframe you choose.
1. Identify a POC on the timeframe of your choosing.
/* If you choose a "low" timeframe (monthly here) then make sure to look at the higher timeframes to see how it is playing against a higher timeframe POC.
2. When the price is moving away from the POC (either to the upside or downside) this will confirm or invalidate the trade.
3. You can now enter the trade on bias or wait for a retest of the same POC.
/* EXAMPLE TRADES /*
Here is a screenshot of some of the trades that are possible solely using the POC and some common sense.
s3.tradingview.com

Bitcoin Daily Support/ResistanceA new indicator for tradingview.
Indicator Overview
The 2-Year MA Multiplier is intended to be used as a long term investment tool.
It highlights periods where buying or selling Bitcoin during those times would have produced outsized returns.
To do this, it uses a moving average (MA) line, the 2yr MA, and also a multiplication of that moving average line, 2yr MA x5.
Note: the x5 multiplication is of the price values of the 2yr moving average, not of its time period.
Buying Bitcoin when price drops below the 2yr MA (green line) has historically generated outsized returns. Selling Bitcoin when price goes above the 2yr MA x 5 (red line) has been historically effective for taking profit.
Why This Happens
As Bitcoin is adopted, it moves through market cycles. These are created by periods where market participants are over-excited causing the price to over-extend, and periods where they are overly pessimistic where the price over-contracts. Identifying and understanding these periods can be beneficial to the long term investor.
This tool is a simple and effective way to highlight those periods
MA 50/100/150 was historically good support and resistance. When we cross them we have a new trend that is established.

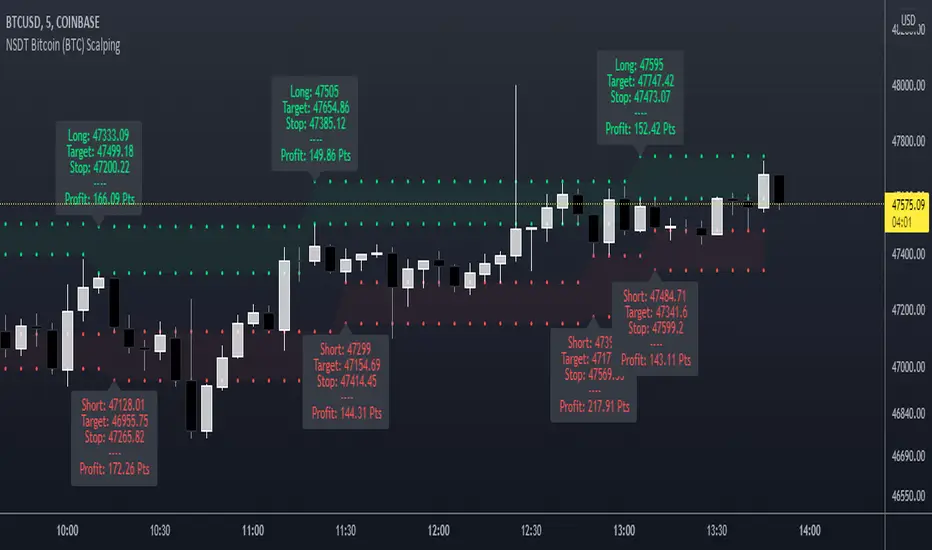
NSDT Bitcoin (BTC) ScalpingThis indicator is specifically designed for scalping Bitcoin (BTC). It looks for a particular price pattern/sequence and displays a label on the chart to show a potential entry, target, and stop based on that analysis. Basically enter long through the green zones and short through the red zones. These levels are not guaranteed to be hit. Trading is risking and you can lose money. Trade at your own discretion and risk. This indicator is only providing potential scalping zones based on recent price action.
BTC|Scanner| v0.6b INDICATOR- This indicator looks for the optimal entry points to a long position.
- Based on mathematical calculations on the beginning of market activity, as well as on the readings of double/triple RSI, MACD, SMA.
- The trend is determined based on the Heiken Ashi candles.
- This indicator can be used on a 30m timeframe and does not require fine tuning.
- This indicator has a setting for choosing the ratio of market activity and choosing the aggressiveness of trading.

Bitcoin Logarithmic Regression RainbowI know there are a lot of BTC rainbows out there, I just wanted to publish my version with my fittings to the BTC price.
The grey channel at the bottom encloses the March 2020 Corona dump.
For best experience USE WEEKLY TIMEFRAME .

