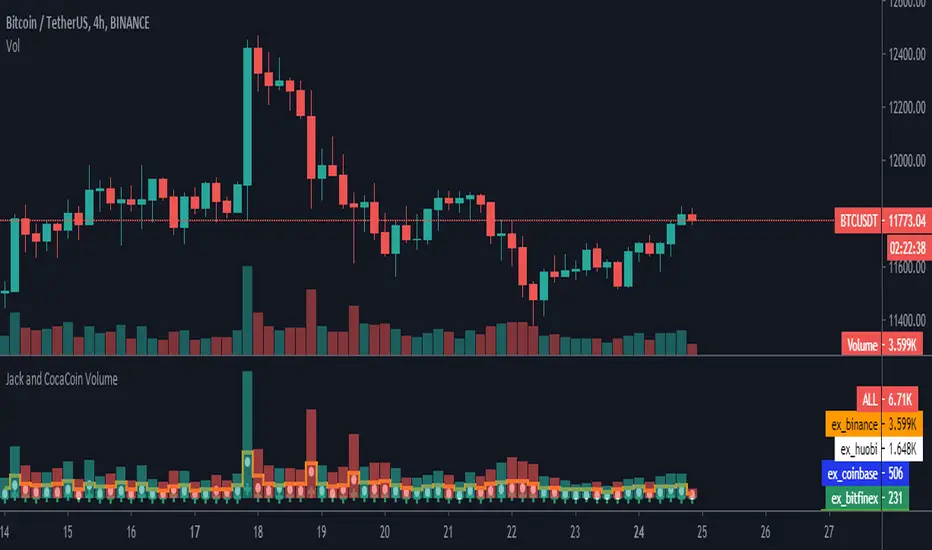
Aggregate BTC VolumeSimple script that shows the aggregate volume of BTC, taking volume data from top spot and derivative exchanges.
Btc!
BTC & ETH Alert SystemWith Tradingview's free plan, only one alert is allowed. The purpose of this indicator is to allow for two alerts--one for BTC and one for ETH.
How to use the alert system:
1. Set the desired value for BTC and ETH that you want to be alerted for
2. Set an alert on the indicator by clicking the three ellipses and then "Add Alert"
3. Set the alert to go off if the value of the indicator is greater than 0.
The example is of BTC using an alert of $10,000 and an alert of ETH at $2,000 (untriggered)
The script can be easily modified to be used for different assets

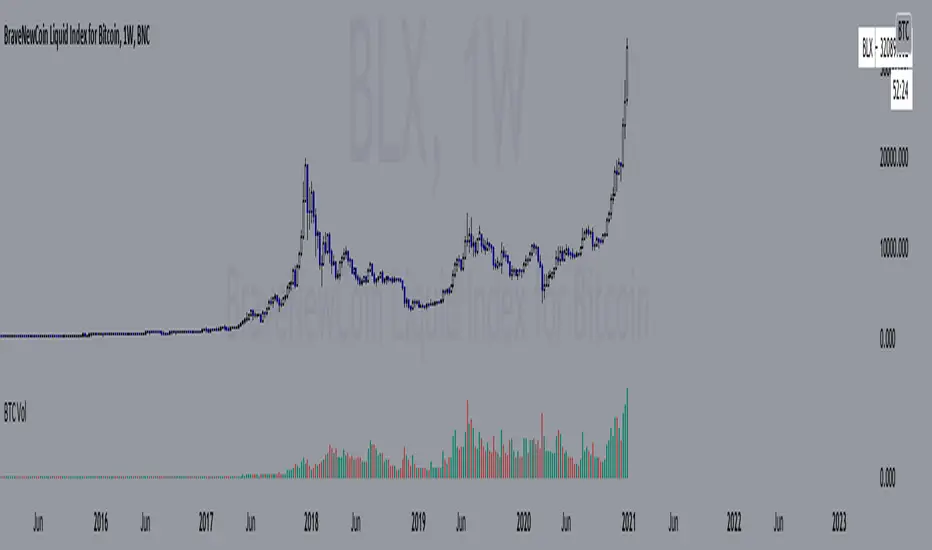
Binance Weighted BTC IndexThis is the weighted index for Binance's tether-margined BTC and ETH markets.
It was created to test the accuracy of the weighting and ensure the index was correct. With consideration to the history of tether's effect on Bitfinex's spot market, I had interest in the differences in Bitfinex's USD and UST pairs. Although the difference now is minor, xxx/UST pairs in the index are more accurate.
Options to configure are choosing the base currency, BTC or ETH, and the quote currency, USD or UST (USDT).

PT Crypto Kill ZonesVersion 1.0 of our PT Crypto Kill Zones indicator helps create a visual of specific times throughout the trading day, which we can expect volatility. The market moves within particular sessions. These sessions are broken up as such in three segments, NY, London & Asia.
Toggles -
Market Open highlights the opening of each market.
Daily Zone – highlights a period around the daily crypto candle close.
NY Open Zone – highlights a period around the NY market open.
NY Close Zone – highlights a period around the NY market close.
London Open Zone – highlights a period around the London market open.
London Open Zone – highlights a period around the London market close.
Asia Zone – highlights a period around the Asia market open.
Preferred zones are settings we came up with by running backtests to figure out which periods are close to the kill zones, which offer a better reaction.
Strategy: Use the sub 1h time-frame (30m is ideal) and scalp the London & NY zones with the PT Liquidity & PT Buy/Sell indicator.
This Oscillator was built around our buy sell & Liquidity indicator for scalping. It is included as part of the library. Just message us for access!

Bitcoin DAA OscillatorAn oscillator of Bitcoin's Daily Active Addresses (DAA) and fundamental metric of the utilization of the Bitcoin network.
Helps to identify:
Potential buy zones (green) - when the network utilization is low & increasing
Potential sell zones (red) - when the network utilization is high & decreasing

Engulfing strategy with DMI confirmationThe strategy contains Bearish and Bullish Engulfing trend reverse alerts with entry and closure notifications. Entries are enforced by Directional Movement Index (DMI) indicator levels combination. The strategy can be applied to spot, futures and marginal trading exchanges. It is suitable for both long and short positions and works accurately with BTC, USDT, ETH and BNB quote currencies. Best to use with 1H timeframe charts
Strategy elements can be configured at your own desire with user interface settings, no programming skills required:
1. Choose signals type: Long, Short or Both
2. Choose trend detection pattern rule:
SMA50 - provides a higher number of positions
SMA50 + SMA200 provides a higher accuracy
3. Change risk management settings to make the most accurate and efficient configuration. You can set up unique stop loss, take profit and trailing offset for different assets
4. Configure strategy periods
DMI and ADX lengths
ADX Smoothing
Key level
EMA and SMA lengths
5. Configure backtest dates
6. Show or hide RSI support and resistance bands
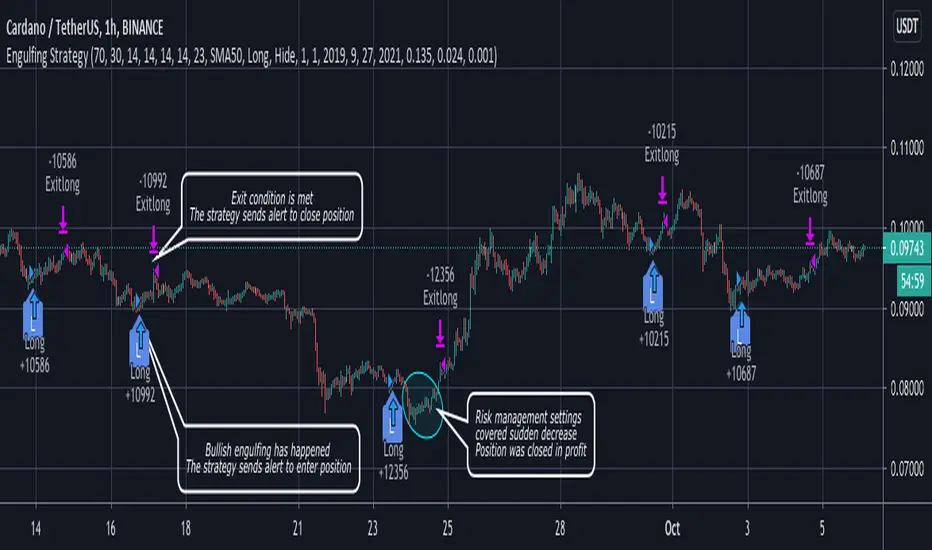
Engulfing strategy provides information for traders to enter the market in anticipation of a possible reversal in trend. Engulfing candles tend to signal a reversal of the current trend in the market. This specific pattern involves two candles with the latter candle "engulfing" the entire body of the candle before it. The engulfing candle can be bullish or bearish depending on where it forms in relation to the existing trend. The script calculates and compares values of the price action candles to define is there an engulfing and what type it is: bullish or bearish
If there is a bullish engulfing the indicator fills price action candle with yellow color
If there is a bearish engulfing the indicator fills price action candle with purple color
Advantages of the script:
1. The script detects presence of both types of engulfing: Bullish and Bearish
2. Weak engulfment signals and market noises are filtered by RSI bands and DMI confirmations. This allows to receive only strong and confirmed engulfment signals
3. This script has configurable risk management settings (order size, commission, take profit, stop loss and trailing). This provides you opportunity of direct broker connection and allows to conduct backtests before applying the strategy to real account. You also can set up strategy actions alerts
At the chart you can see the historical price action of ADAUSDT at Binance exchange from the January 1st 2019 till current date. The strategy is set up to receive only long signals because it is a spot market. Moments when the strategy triggered to enter a position are shown as L label while position entries are shown as "Long" messages. Moments when a certain position should be closed are shown as "Exitlong" messages
The strategy demonstrate high backtest results:
Mathematical expectation of risk management settings is positive = 1.34%
Percent profitable = 93.33%
Profit factor = 3.253
Quantity of entries = 75
Net profit = 15.22%
How to use?
Long signals:
1. Apply indicator to a trading pair your are interested in.
2. Click Settings button and select Alert Positions Type Long
3. Once bullish engulfing and confirmation conditions are met price action candle will be colored yellow and script strategy will enter a position.
4. Check Strategy Tester to set up optimal Risk management settings: stop loss, trailing profit activation point, trailing offset
5. Set up the strategy alert to be notified when a position should be opened or closed
Short signals:
1. Apply indicator to a trading pair your are interested in.
2. Click Settings button and select Alert Positions Type Short
3. Once bearish engulfing and confirmation conditions are met price action candle will be colored purple and script strategy will enter a position.
4. Check Strategy Tester to set up optimal Risk management settings: stop loss, trailing profit activation point, trailing offset
5. Set up the strategy alert to be notified when a position should be opened or closed
Best regards,
SkyRock Signals team
If you want to receive access to the strategy please contact us in personal message!
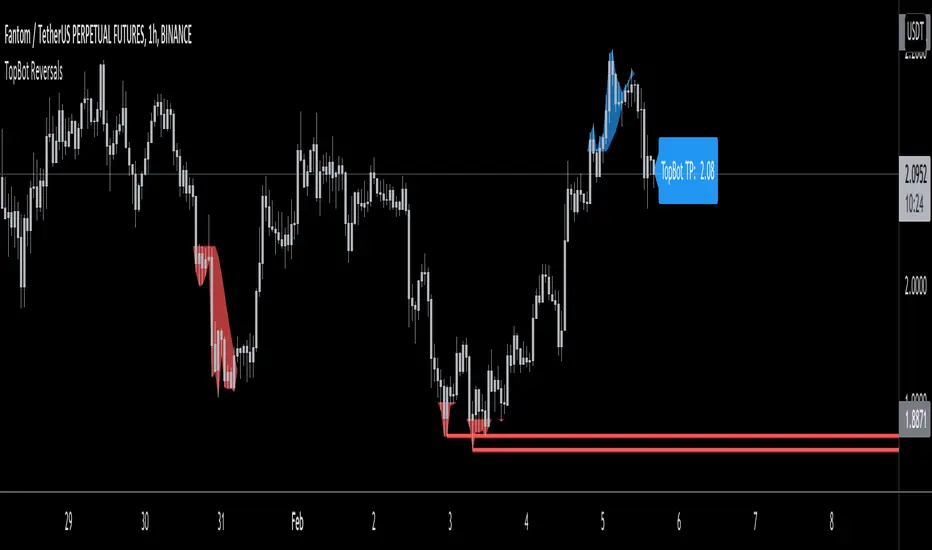
TopBot ReversalsThe TopBot Reversal indicator utilizes exhaustion and historical price levels to draw a possible recent top and bottom level. Using these lines together with other directional indicators such as Stochastic or RSI, we can draw a conclusion to a possible reversal at these levels.
Use the link below to obtain access to this indicator.
Truenomic's Universal BTC and ETH VolumeA simple indicator to display the total volume of BTC or ETH from different exchanges. The difference between this indicator and others is the ability to see the total volume in BTC or ETH (not USD) from all exchanges simultaneously, including derivative ones.
Spot Exchanges:
Binance;
Coinbase;
Kraken;
Gemini;
Bitfinex;
Bitstamp;
Derivatives Exchanges:
Bitmex;
Okex;
Deribit;
FTX;
Binance;
This list is relevant only at the time of publication, stay tuned for further indicator updates!


Kaya RSI Speacial Indicatortake your own risk.
This is a signal for buy sell of any emita.
Green mean buy and red mean sell.
It is calculated from mean of support-resistence of rsi.


Strategy Super Trend v0.4This strategy is written for trading cryptocurrencies using the super trend indicator. The main parameters of the strategies include the super trend indicator settings, as well as the testing period. An important advantage of strategies is the use of a martingale to close positions, which increases profitability!

Adaptive IchimokuThis is part 10 of 11 in the system named Ninetales/Volt V2 you can find on Tradingview.
No. You may not add custom values, testing all the variables of Ichimoku is a giant pita. You can uncheck ones you dont like though.

TBS - Trend Buy and Sell IndicatorTrend Buy and Sell Indicator
TBS identifies trend based on price cross-over/cross-under to a moving average. Confirmed Up-trend is displayed in green and Down-trend in red backgrounds. Before a trend is confirmed price cross-over is displayed in blue and cross-under in orange backgrounds. Once an uptrend is confirmed, TBS suggest buys based on touch downs to a Support moving average by a green arrow under the candle . A sell is suggested by TBS by a red arrow on top of the candle when the price reaches a certain percentage above support moving average. Motivation and Tolerance levels are provided to fine tune buying and selling signals.
Example : Default settings for BTC Weekly charts are Trend Moving Average = 50, Support Moving Average = 21, Motivation Buy = 10, Tolerance Buy = 5, Motivation Sell = 50 and Tolerance Sell = 90. That means in uptrend identified by green background every time the closing price touches 10% higher than 21 week moving average value TBS suggests buy, so a trader can choose to buy 80% of intended position at this level. If the price continues to drop down and touches 5% below 21 week moving average, a trader may choose to buy another 20% at this level. In the likely scenarios of price hike from here a trader may choose to sell 80% at the Motivation Sell level 50% higher than 21 week moving average. If the price reaches Tolerance Sell level at 90% higher than 21 week moving average a trader may choose to sell remaining 20% of the position.
Note 1 : TBS suggest Buys and sells but the execution of buy and sell is up to trader's discretion for example using Stop Buy order or Limit Buy order etc.
Note 2 : TBS is designed to be a medium to long term indicator for example weekly and monthly timescales. Traders might find it useful on shorter term time-frames but its not designed for short term time frame in mind.
Note 3 : Most of the parameters in TBS indicator are configurable as Trend Moving Average and Support Moving Average vary significantly across assets. Default parameters are set for Bitcoin Weekly time frame. Traders should play around with parameters to find best fit for Trend Moving Average and Support Moving Average for the asset of interest. For example TBS is very relevant and useful for Gold Weekly time frame with Trend Moving Average = 100, Support Moving Average = 30, Motivation Buy = 1, Tolerance Buy = 0, Motivation Sell = 11 and Tolerance Sell = 20.

Risk Metrics: Crypto VersionRisk Metrics for Crypto.
Market can be set to BTCUSD, BTCEUR, BTCCHF, BTCGBP, BTC1!, BTC2!, SPX, and DTB3
Beta
Correlation
Standard Deviation
Variance
R-squared

GODXBTTRADING SCRIPT "GODXBT"
ALL IN ONE !!!
This script helps you to understand the market situation
Script includes
. Support & resistance tool
. 3 EMA's ( exponential moving average ) ( you can change ema values )
. Smooth Guppy : helps to understand support and resistance also helps to understand trend direction ( Red is bearish trend & Blue is bullish trend )
. And Buy & Sell signals to take entry and exit
how to trade :
Buy/Long when " BUY " signal appears
Sell/Short when " SELL " signal appears
take profits near support and resistance lines / close position on the break of it
* Customized Switches to on/off Guppy , S/R levels
* When guppy is blue longs are profitable and when red shorts are profitable
*DM for access

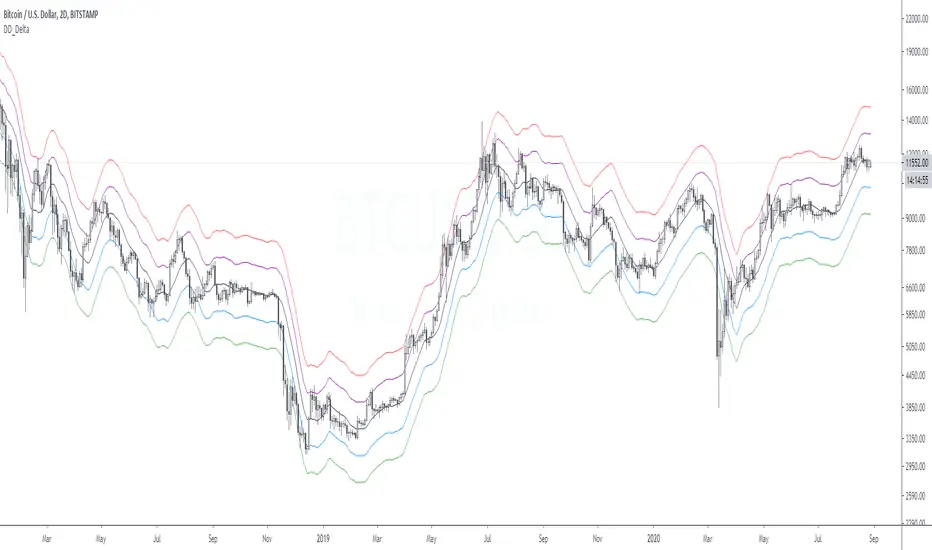
DD_DeltaDescription:
The DD_Delta Indicator is a mean reversion indicator based on the concept of moving average and fibonacci level multiples. The middle blue line corresponds to the 13 MA with the orange and red lines lines being a factor and inverse of 1.414 and 1.272 of the blue line respectively. Price usually retraces from the purple and red (green and blue) lines towards the back line. Also, the direction of the ribbon indicates the nature of the market - upwards: bull, downwards, bear.
Best TF to use this on: 2D.
For access, DM me.
BITCOIN Miners Revenue VS Price Correlation OscillatorUse 3D(3-day candle) as timeframe for best reading.
------
original template for Correlation indicator was created by obaranova. credit goes to her.

Bitcoin Correlated Market DirectionIdentifies which major market is "controlling" Bitcoin and what direction that market is moving in.
Helps to identify confluence of trend or potential turning points for Bitcoin.
Blue = stocks in control and bullish
Purple = stocks in control and bearish
Orange = gold in control and bullish
Red = gold in control and bearish

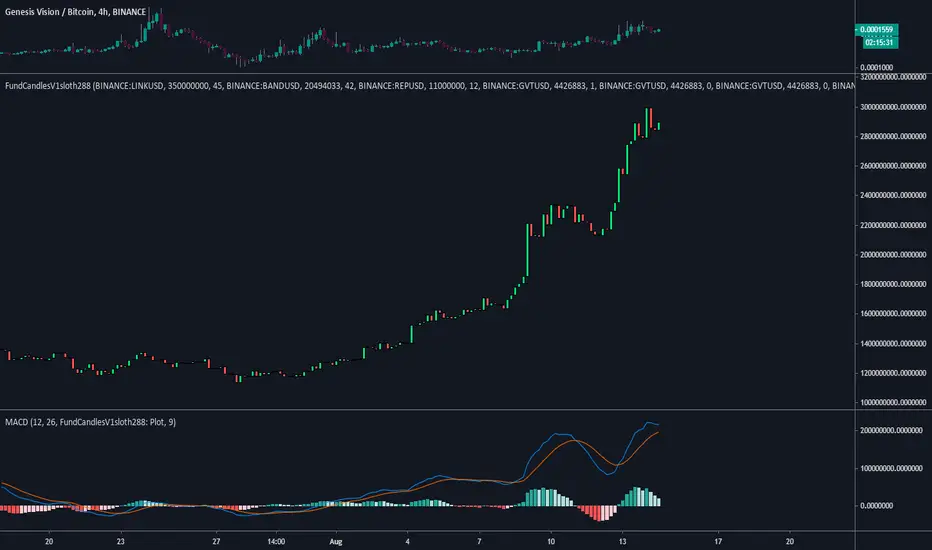
FundCandlesV1sloth288FundCandlesV1sloth288 is an indicator I decided to put together so I can track how funds are doing on $GVT Genesis Vision.
Using a standard MACD or RSI indicator you can change source to use the FundsCandles values to determine if its a good time to enter or exit different funds on the platform.
What you need to know...
Currently all securities need to pair the same, (USD / BTC ).
Security 01, 02, 03 etc etc to maximum of 10 need to be in "BINANCE:LINKUSD" format.
Manually need to input circulating supply from CMC to get the proper ratios for index.
Allocation is the % of the funds exposure to said security.
Inputting the values does not track previous reallocation's, the whole chart will be if the history of the fund was using up to date settings.
Values on the right is the Marketcap of the fund.
Standard settings is of Oracle Basket on the platform made by Somnium Funds as of Aug 13 2020.
Next update will be after GV includes traditional stocks onto the platform for managers to diversify their current allocations into them.
Kaya RSI BASED INFLATION INDICATORUse your own risk.
This indicator aims look inflation of your emita according to the BTC and XAU. Also you can use Dxy too. The main idea of behind of this indicator is rsi. But not normal rsi :).
For example. If green(XAU) line upper then xau going to up better than BTC and your emita. If red line (BTC) is upper, thats mean buying BTC can be more profitably. Blue line (named Normal means this is your emita) is upper that mean your emita is can be more profitably than the others. You can think opposite for lower situations.
Be aware this is not mean percent rising or declining. This is just understanding for which of them (relatively) moving how according to the rsi.
Maybe it can using for positons too. But I didnt test it. So be carefull.
Best Regards.

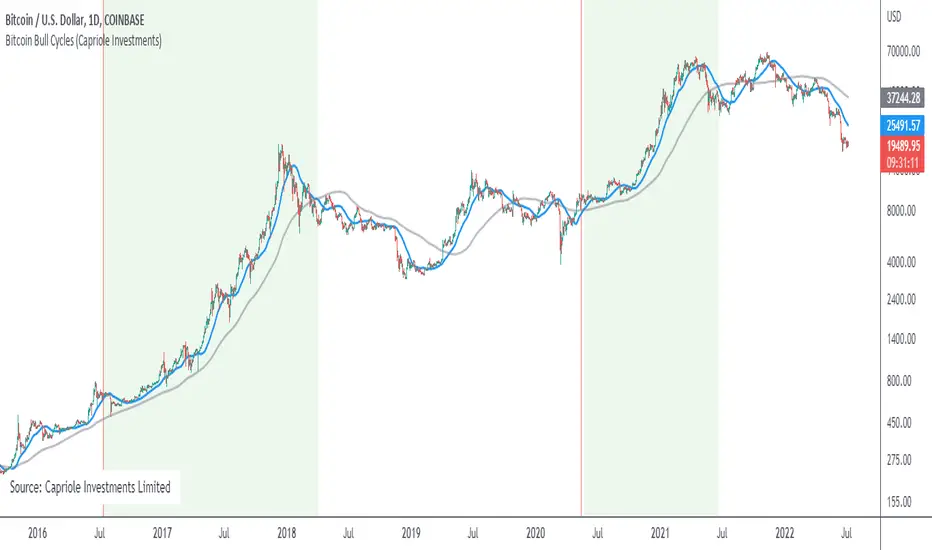
Bitcoin Bull CyclesA simple indicator that identifies the primary upswing of Bitcoin following each Halving, the "Bull Cycle".
A "Bull Cycle" is identified as the first period of positive momentum after each Halving date, defined as the 50 Daily Moving Average (DMA) being above the 200 DMA.