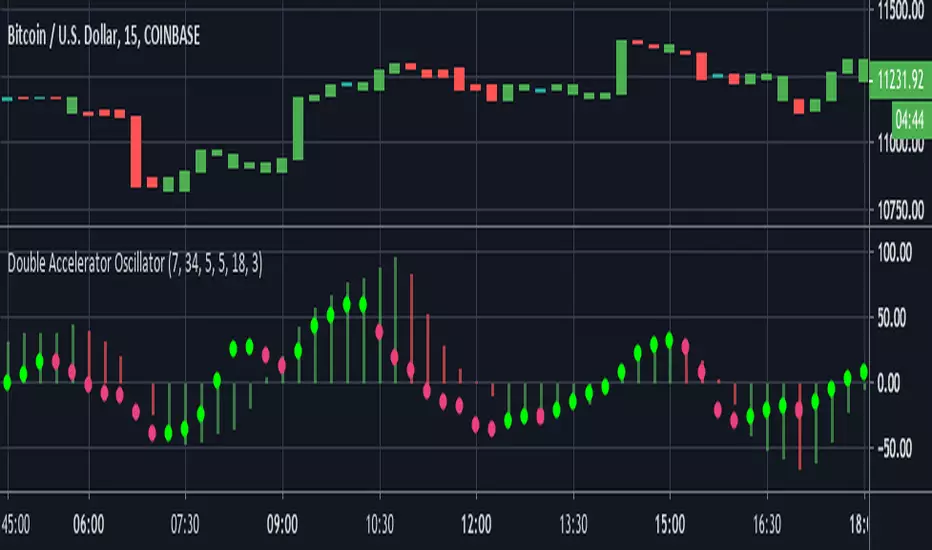
Double Accelerator OscillatorThis is a modified version of Bill Williams' Accelerator. The Accelerator measures the difference between the Awesome Oscillator(another Williams indicator) and its 5 day SMA.
This script plots 2 accelerators rather than 1. Users can define the lengths of the fast and slow SMA's used in the Awesome Oscillator calculation by adjusting the options in the input menu.
We set the default the lengths of the fast and slow SMA's used in the first Awesome Oscillator calculation as 34 and 7 periods. Then to find the Accelerator Oscillator, the difference between the Awesome Oscillator and its 7 period SMA is calculated. The second Accelerator uses shorter window lengths than the first. The fast SMA length is 5 by default and the slow SMA length is 18. Finally, the length of the Awesome Oscillator SMA used to calculate the second Accelerator Oscillator is 3.
By utilizing two Accelerator Oscillators with increasingly shorter window lengths, this indicator identifies changes in momentum very well.
The red and green histogram represents the first Accelerator Oscillator. It is green when the Accelerator is increasing and red when it is decreasing. I found this layout to be more practical than the standard, which plots the AC as green when it is greater than 0 and red when less than zero. The second Accelerator Oscillator is plotted as the bright green and pink circle line. It uses the same coloring conditions as above.
Btc!


MACD Profit CandlesThis tool is simple yet very effective. It creates new candles on the chart based on the MACD.
Candles are green when MACD is increasing and red when it is decreasing. All lengths can be adjusted in the input menu and there is an option to plot the signal line.
The rules for using it are pretty simple:
1.Buy on Green
2.Sell on red
~Happy Trading~

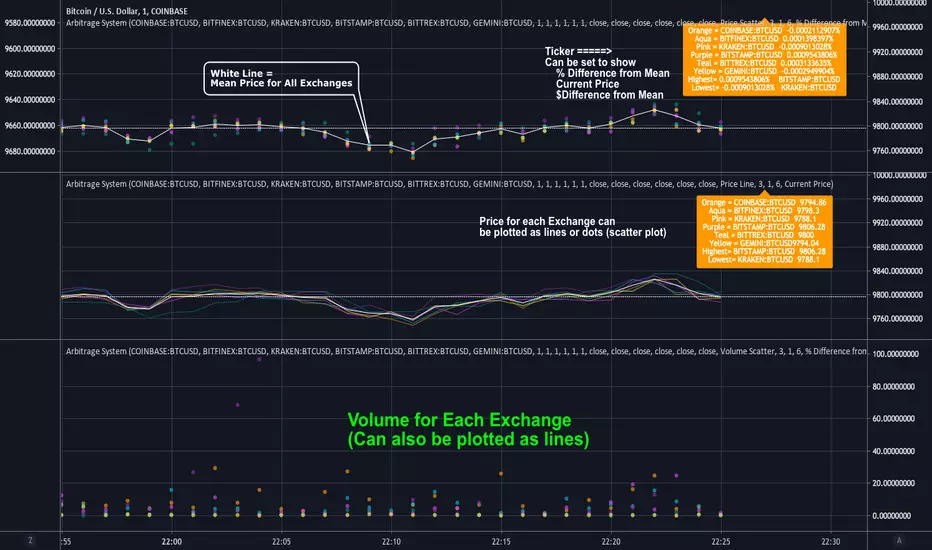
Arbitrage SystemThis script allows you to track the price and volume movement across 6 different exchanges. By default, it is configured for BTC and pulls price and volume data from Gemini, Bitfinex, Bittrex, Bitstamp, Coinbase and Kraken.
Users can use the input options menu to choose which exchanges or symbol is used. It has 4 different modes:
1.Price Scatter: Plots the prices from each exchange around one center white line that represents the mean price across all 6 exchanges.
2. Price Line: Same thing as above, except lines are used instead of circles.
3. Volume Scatter: Plots the volumes for each exchange as colored circles, similar to a scatter plot.
4. Volume Line: Same as above except lines are used instead of circles.
The label in the top right corner displays the current price for each exchange. This can be configured in the input menu and can display
-Current Price
-% Difference from Mean
-$ Difference from Mean
This label also displays the highest and lowest price (or % diff) amongst the 6 exchanges.
Prices are pulled in 1 minute intervals, but the mean price line(white) can be adjusted to show 5, 15, 30, 1 hour or 2 hour avg price across all 6 exchanges.
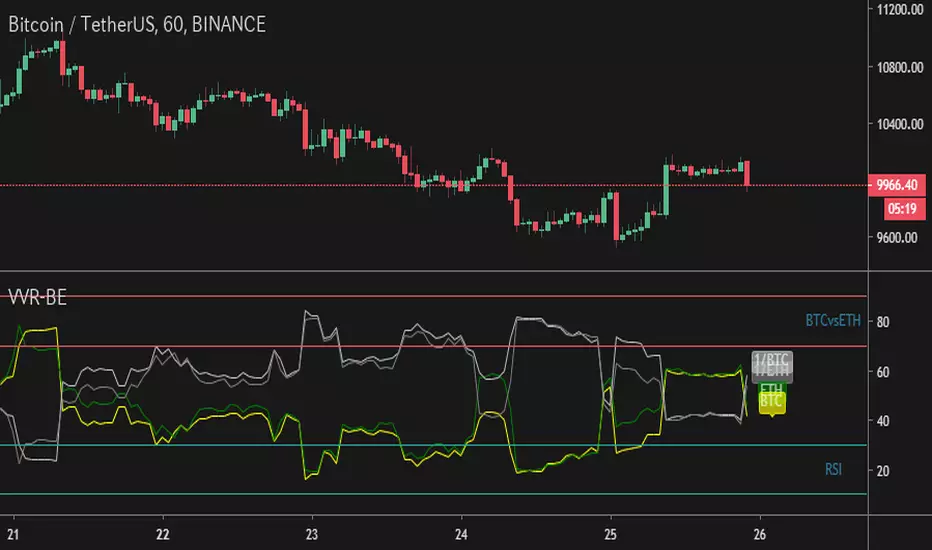
Volatility Index Oscillator LargeCap [aamonkey]There are two versions of this indicator (Large and Small Cap).
Both work exactly the same the only difference are the default coins selected.
What does this indicator do?
- can be used on any timeframe
- plots the percentage change of the candles of the selected timeframe of 9 LargeCap coins (Default: ETH, EOS, TRX, IOTA, XLM, ADA, ATOM, Tezos, BTC)
- +1 line for the chart you are currently on (Default: red line)
Why use this indicator:
- compare selected coins to the LargeCap coins in terms of volatility
- see correlations in price movements
- see which coin outperforms the others
- find coins that are behind
Settings:
- pairs, exchanges, and colors changeable
- always write the pairs and exchanges in caps!

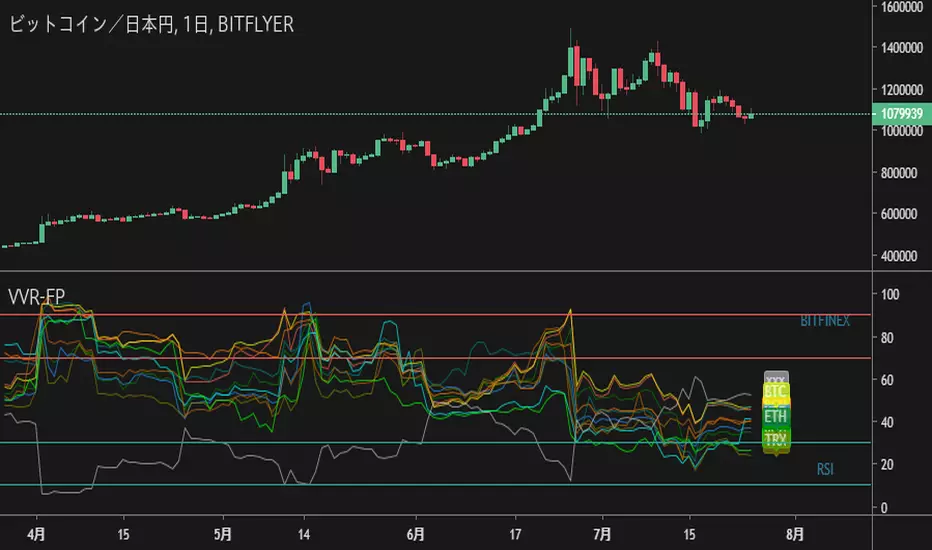
Volatility Index Oscillator SmallCap [aamonkey]There are two versions of this indicator (Large and Small Cap).
Both work exactly the same the only difference are the default coins selected (and this version compares only 9 coins in total instead of 10).
What does this indicator do?
- can be used on any timeframe
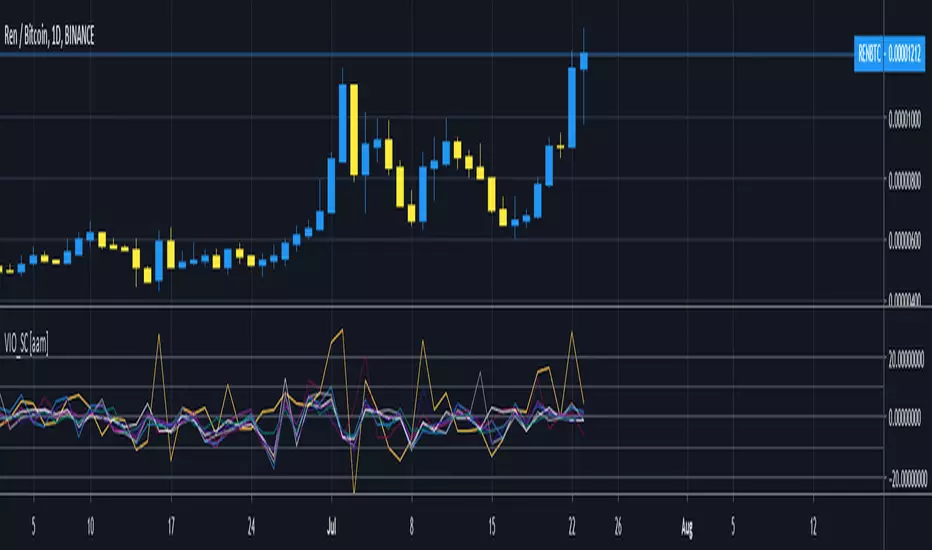
- plots the percentage change of the candles of the selected timeframe of 8 SmallCap coins (Default: REN, LOOM, MANA, ENJ , KNC, ZRX, BNT, REP)
- +1 line for the chart you are currently on (Default: red line)
Why use this indicator:
- compare selected coins to the SmallCap coins in terms of volatility
- see correlations in price movements
- see which coin outperforms the others
- find coins that are behind
Settings:
- pairs, exchanges, and colors changeable
- always write the pairs and exchanges in caps!
Adaptive Momentum Oscillator(AMO)Here is a new experimental indicator that we've been developing that is focused on gauging momentum.
The indicator fluctuates above and below zero, but instead of using zero as the threshold for differentiating positive and negative momentum, it uses an 89 period median(plotted as the thick white line).
The momentum over the previous 10 periods is then calculated and then smoothed using a 6 period Exponential Moving Average (EMA). This, as well as the choice to use a median as the central divider were done to eliminate the whipsaws that are often generated when making strategies based on pure momentum and crossings above/below 0. The EMA alternates between lime green when it is above the median and pink when it is below. The area between the EMA and median is filled in green when EMA > median and pink when the EMA is less than the median.
Then, a 29 period Simple Moving Average of momentum is calculated. Here, going with a SMA over EMA and a longer window(29) seemed to make sense as it is counteracts the high responsiveness of the EMA. The SMA is green when greater than the median and red when less than the median.
There's two ways to trade using this system. One way would be to go long when the momentum EMA crosses over the white median line and turns lime green, then short when it crosses back under the median line and turns white. Another option is to go long under the same conditions, but short when both the EMA and SMA are above the median and the EMA crosses under the SMA.
Not sure if this exact configuration has already been created by someone, but it'll be interesting to see how it holds up with more backtesting and then running it fully automated.
-Strategy version coming soon-

DBT MoMo v.4DBT MOMO
Introduction: The MoMo is a TradingView indicator designed to evaluate momentum and give the user signals according to momentum shifts, strength, extensions, traps, and divergence. It’s an all in one oscillator that will make reading price action near term and long term much easier.
Part One: Strength
The MoMo consist of two major parts. A 3-candle back formula and a 24-candle back formula. The 3-candle back is called the Price Line (the histogram on the MoMo). The 24-candle back is called the Trend Line (the line on the MoMo). Both lines are placed into a range from 20 to -20. It can go higher than 20 or lower than -20, but this is extremely rare and short lived.
A positive number indicates a bullish bias, a negative number indicates a bearish bias. When the Price or Trend line are ascending while below 0 this indicates that the bearish momentum is weakening. When the Price or Trend line are descending while above 0 this indicates that the bullish momentum is weakening.
In a strong trend the Trend Line will likely flatten out around 15 or -15. While the Trend Line is flat the Price Line will likely shift rapidly, this can lead to bull and bear traps, we will discuss this in the Trap section.
A rare, but powerful signal from the MoMo is when the Price and Trend Lines “pinch” and begin to move in the same direction. If this is happening the trader should be looking to follow the direction of these lines.
Part Two: Extensions
When both Price and Trend Lines are above 10 or below -10 this will begin to signal an extension.
Purple: Indicates the bears are extended to the downside and a pullback or trend reversal upward is likely.
Gold: Indicates the bulls are extended to the upside and a pullback or trend reversal downward is likely.
When only the Trend Line is above 10 the MoMo will shade the upper range red. This indicates the Trend is becoming bullish or entering an extension. If the Trend Line cannot maintain above 10 for long and breaks below 10 this indicates it’s an extension and trend will most likely continue downward.
When only the Trend Line is below -10 the MoMo will shade the upper range green. This indicates the Trend is becoming bearish or entering an extension. If the Trend Line cannot maintain below -10 for long and breaks above -10 this indicates it’s an extension and trend will most likely continue upward.
When the green or purple shading have turned off take the lowest point, this is considered a support level or a local bottom.
When the red or gold shading have turned off take the highest point, this is considered a resistance level or a local top.
The trader can preemptively trade the purple or gold warnings but be warned these warnings can go on for a long time if the trend is very strong. It is the same mentality of an overbought or oversold RSI, except the MoMo extensions have a much higher strike rate.
To avoid preemptively trading these extensions the trader should wait for confirmation on the Price Line and on price action. The Price Line (histogram) should be moving upward during a purple extension to begin showing a bottom. The Price Line (histogram) should be moving downward during the gold extension to begin showing a top.
Part Three: Traps
The relation between the Price Line and Trend Line can create trading signals for bull and bear traps. When the Trend Line is flattened out around 15 or -15, indicating a strong trend is in place, and the Price Line is rapidly moving towards the midline this may indicate a trap is forming.
When the Trend Line is flat around 15 and the Price Line begins moving towards 0, if the Price Line reaches 0 or close to 0 and the Trend Line is still flat, a trap has begone. Once the Price Line shifts from decreasing (red) to increasing (green) the trap is playing out. Therefore, the trader should look to exit short positions or enter long positions.
When the Trend Line is flat around -15 and the Price Line begins moving towards 0, if the Price Line reaches 0 or close to 0 and the Trend Line is still flat, a trap has begone. Once the Price Line shifts from increasing (green) to decreasing (red) the trap is playing out. Therefore, the trader should look to exit long positions or enter short positions.
Part Four: Divergences
The MoMo is exceptional at finding divergences with the Price Line and occasionally the Trend Line.
To find a divergence with the MoMo the trader must look for when the histogram is not following price action completely.
Bullish Divergence: Price makes a lower low, MoMo makes a higher low.
Bearish Divergence: Price makes a higher high, MoMo makes a lower high.
Hidden Bull Divergence: Price makes a higher low, MoMo makes a lower low.
Hidden Bear Divergence: Price makes a lower high, MoMo makes a higher high.
For Access or Questions: Private message us. Thank you.

Oasis Trading Suite LiteOasis Trading Suite Lite
Introduction: The Oasis Trading Suite is a TradingView indicator designed to make following trend and finding key pivot points very easy. It provides the trader with advanced trend coloring for candles, pivot points both high and low, and a trail that will follow price and give signals when a “buy the dip” or “sell the rally” opportunity is presented. This is a Lite version that only showcases the candle coloring.
Part One: Candle Coloring
The Oasis Trading Suite colors candles based on a trending bullish or bearish bias; this will override the default red/green coloring of candles which is based on closes.
Bullish Candles will be denoted with a green color by default.
Bearish Candles will be denoted with a red color by default.
Neutral Candles will be denoted with a gray candle by default. These are candles that do not have a trending bias.
For Access or Questions: Private message us. Thank you.
For the Full Version go here.

NVT (original) - Network Value to TransactionsI'm reposting the NVT indicator that was originally available for public use in TradingView.
NVT Signal is a Bitcoin-specific study to get a view on data flowing through the blockchain.
It has been used to predict tops in Bitcoin price.
I've set up this indicator for it to be possible to base the calculations on custom:
Transaction Periods
Overbought levels
Oversold levels
The indicator plots in any BTCUSD spot, futures, BLX index and BTCEUR.
It paints in intraday time frames, but Daily time frame is the correct one to interpret the 'official' read of it.
For that reason, I've enabled by default an option that forces the NVT to display the Daily value even though the time frame could be higher or lower.
Please consider unchecking this setting if you'd like to experiment with another type of reads (i.e. in weekly time frame).
Additionally, it allows the following settings:
Signal Line Plot . Added the possibility to plot a Signal Line based on EMA.
Signal Line Cross . Show/Hide Crosses with the Signal Line.
Alerts based on Signal Line . Predefined Tradingview Alerts on the Cross of the Signal Line.
OverBought Background . Highlight the background based on OB Condition.
OverBought Alert . Predefined Tradingview Alerts based on OB Condition.
OverSold Background . Highlight the background based on OS Condition.
OverSold Alert . Predefined Tradingview Alerts based on OS Condition.
Please check our blog article showing multiple practical ideas about trading the NVT indicator: medium.com
Credit for this idea goes to Willy Woo woobull.com
and Dmitry Kalichkin twitter.com

Triple Coppock CurveThe Coppock Curve is a zero-centered momentum oscillator that relies primarily on rate of change calculations. The Coppock Curve in its most basic form is already a great indicator, especially for spotting shifts in momentum. But, we wanted to see how we could modify it to get some better performance out of it.
As the ‘cop’ function demonstrates, the Coppock Curve has a pretty simple calculation. The first step is to calculate the rate of change at a longer and shorter window length. Next, the sum of the two rate of change values is calculated and finally a weighted moving average of a user defined length is calculated(this is the Coppock Curve).
The ‘cop()’ function set the foundation to allow us to implement our modifications. As you can see in the graph, there are 3 different lines (2 histogram and 1 normal line) comprising the Coppock values based on the rate of change of high, low, and closing prices. We liked this layout because it allows traders to easily identify the curve’s pivots and the balance of negative vs. positive momentum.
The Coppock Curve based on high prices is plotted as the teal histogram, wile the pink histogram represents the Coppock Curve of low prices. The curve based on closing prices is the red and green alternating line plotted on top of the two histograms.
We included some notes on the chart to help with interpreting the three curves.
There are two common approaches traders can take when trading with the indicator:
1. Trade based on closing price curve: Go long when line changes from bearish(red) to bullish(green). Then, go short when same line changes from bullish to bearish.
2. Trade based on crossings of the zero-line. This could be based on the high, low, or closing price curves, but closing price is the safest bet. So, go long when it crosses from negative into positive territory and short when it crosses under the zero line from positive into negative territory.

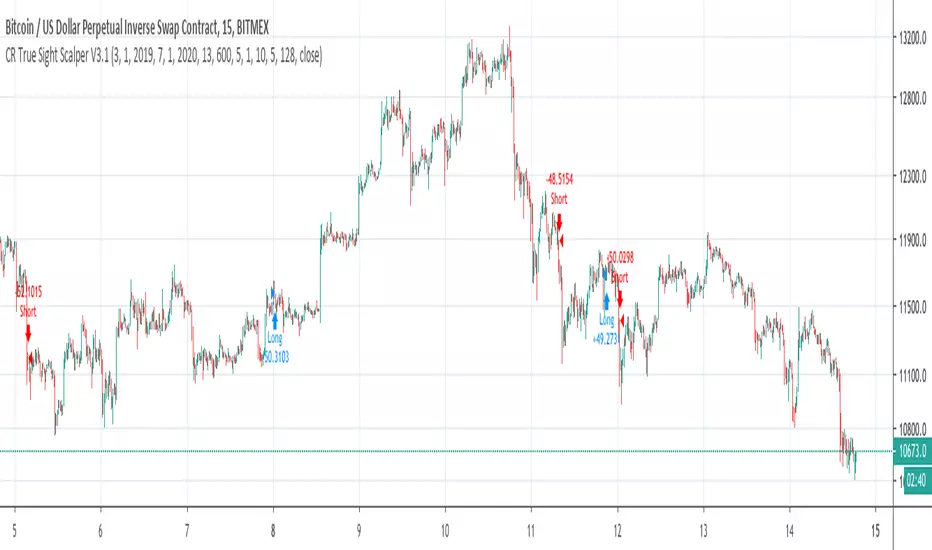
CR True Sight Scalper V3.1True Sight Scalper V3.1 is an incompatible update to V3.0, with much smaller losses.
$100,000 Initial capital.
From 2019-04-04 to 2019-07-14
Brandon BollSecond day at Pinescript and I am attempting to tweak the Bollinger Bands directed strategy to send alerts to Zignaly in order to automate long buy/sells.
I've left in the short script though for completeness.
The buy and sell instructions work perfectly but I don't know how to do a cancel order alert (as included in the original strategy)

3PDivLong
Test 2 : 27 June - 11 July 2019
- 5 m chart (best profit)
- 0.075% commission (Bitmex)
- leverage 1x

Bitcoin Prices InfoPanelHello traders
This script is based on the great Ricardo Santos InfoPanel script
It will display all the Bitcoin prices
The script is public so you can adjust according to your own needs
PS
You might have to scroll right on your chart to see the panel
Enjoy :)
Dave

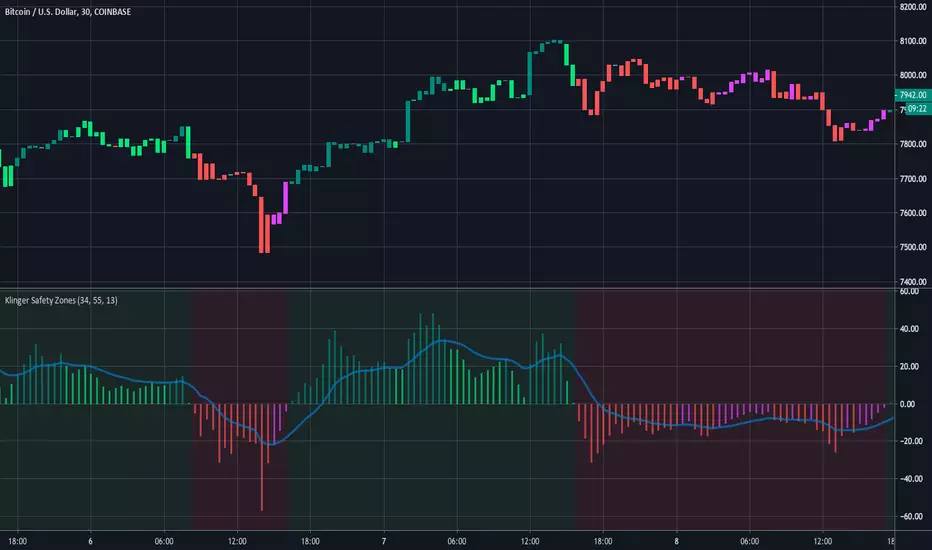
Klinger Safety ZonesThis indicator is based on the Klinger Volume Oscillator, or KVO. The KVO is pretty cool since it can track long-term changes in money flow (both into and out of a market), as well as respond and predict short term price fluctuations.
The Klinger Oscillator determines the direction (or trend) of money flow based on the high, low, and closing price of the security. It then compares all three values (HLC/3) to the previous period’s values to determine how volume should be factored into the KVO. If the current period’s price is greater than that of the previous period, then volume is added. It is subtracted, however, if the price is less than the previous period. This utilization of volume is what makes it an accurate tracker of money flow and a valuable confirmation indicator. This value is often called volume force or the “trend” line.
A fast and slow EMA of the volume force are then calculated. The fast EMA has a smaller window length, while the slow EMA has a larger window. Traders can adjust the lengths of each EMA in the input option menu, but we chose the standard 55 and 34 period lengths as the default settings. We are finally left with the actual KVO value after subtracting the slow EMA from the fast EMA.
The Klinger Oscillator uses a signal line similar to the MACD and many other indicators. The default length for it is 13, but that length can also be adjusted in the input menu. A shorter length will result in more responsiveness but possibly more false signals and whipsaws.
The Chart and Interpretation:
The histogram shows the KVO series. Remember, since the Oscillator represents the difference between the fast and slow EMA, the KVO is bullish when it is greater than zero and bearish when it is less than zero.
When the KVO is greater than zero, the background on the chart is green, meaning that the trend is bullish and traders should look to go long. On the flip side, the background is red when the KVO is less than zero meaning traders should look to go short.
The aqua line plotted on top of the histogram is the signal line.
Here is a quick summary of the histogram colors:
(if KVO > 0 and KVO > signal)
then (color = teal)
if (KVO > 0 and KVO < signal)
then (color = lime)
if (KVO < 0 and KVO < signal)
then (color = red)
if (KVO < 0 and KVO > signal)
then (color = pink)
Users can choose to have the candles change color to match the KVO histogram color by adjusting the setting in the input menu.
~Happy (and safe) trading~
indicator StrategyBITMEX5 FOR LONG BUY2This indicator was developed for trading using RCI .
It performs well in day trading and swing trading.
* Signal conditions for long entry *
It is displayed when the short-term RCI crossovers the lowerband.
* Take profit condition *
It is displayed when the short-term RCI crossunders the lowerband.
* Optimized the entry conditions using CM_Williams_Vix_Fix created by ChrisMoody.
************************
Hello everyone!
I am very pleased with your evaluation.
This script is a masterpiece of the current stage of successful development of a technical analysis of cryptocurrencies over two years.
This has been published for cryptocurrency fans like you, but it may be closed in the near future.
If you like this indicator, please support money for my activities.
We would like to use that money as an activity cost for further indicator updates and better strategy development.
This development work is very hard and requires careful attention, but I am passionate about making them successful.
The amount of money does not matter.
The value you felt was that amount.
BTC
39LbiVReUjxX7k2gqWxQeDAVJtYfTCREzB
LTC
MVAJG4ubzugi2jxZ6P6wqXJXA3RqzmNqYK
ETH
0x7c5715b87a268993c4d78086016015b39985c835
USDC
0x7c5715b87a268993c4d78086016015b39985c835
Thank you.

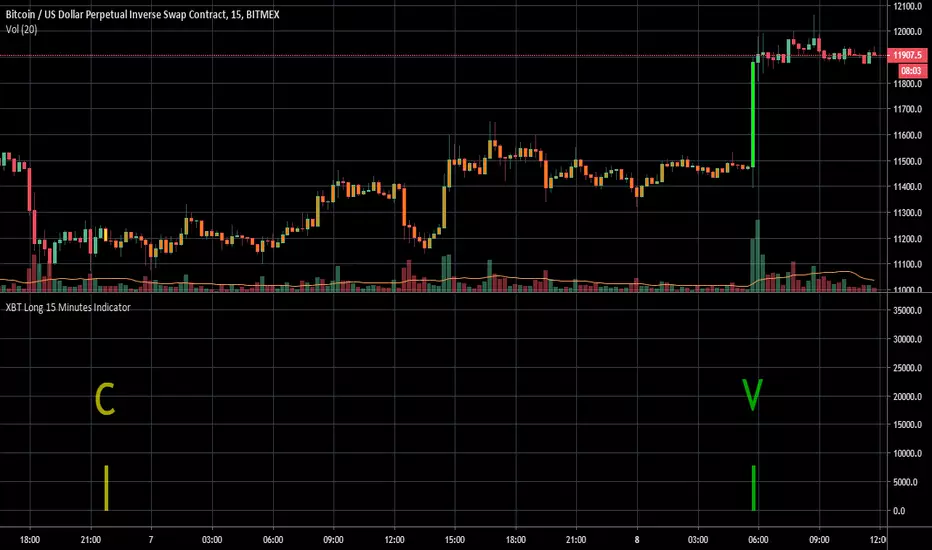
XBT Long 15 Minutes IndicatorXBT Long 15 Minutes Indicator shows Buy and Sell signals on XBT / Bitmex.
Open Long position with "C" and close it with "V".
It was designed to use it in 15 Minutes Scale.
Stop Loss: 3.3%.
Stop Gain: 4.3%.
Statistics from 5/1/19 untill 7/8/19.
23 Win Trades.
8 Loss Trades.
Effectiveness: 74.2%.
Profit: 66.3%.
I use it with 10X leverage.
PROFIT FACTOR: 3.75.
I am using it from 6/1/19.
You are responsible for the use.
I can not assure the future success.
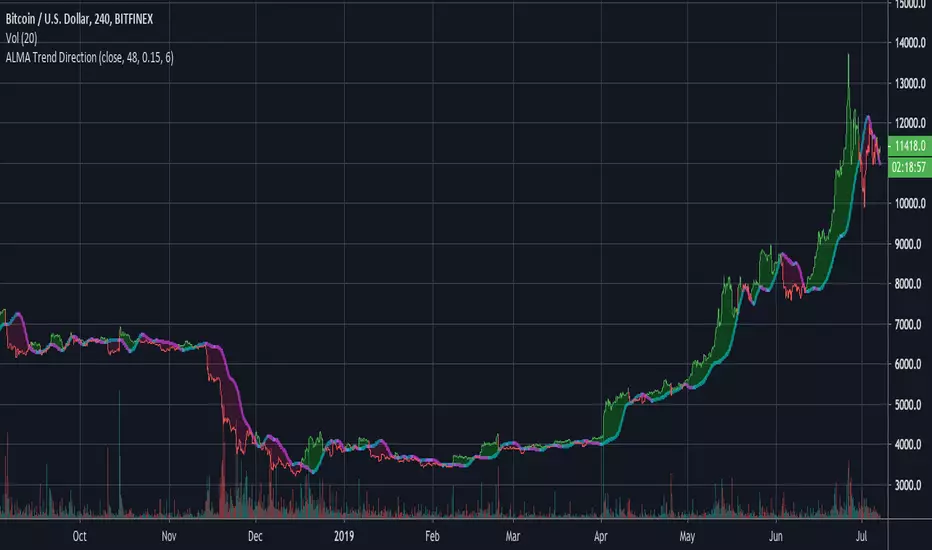
ALMA Trend DirectionHere is a very simple tool that uses the Arnaud Legoux Moving Average(ALMA). The ALMA is based on a normal distribution and is a reliable moving average due to its ability to reduce lag while still keeping a high degree of smoothness.
Input Options:
-Offset : Value in range {0,1} that adjusts the curve of the Gaussian Distribution. A higher value will result in higher responsiveness but lower smoothness. A lower value will mean higher smoothness but less responsiveness.
-Length : The lookback window for the ALMA calculation.
-Sigma : Defines the sharpe of the curve coefficients.
I find that this indicator is best used with a longer length and a 4 Hour timeframe. Overall, its purpose is to help identify the direction of a trend and determine whether a security is in an uptrend or a downtrend. For this purpose, it is best to use a lower offset value since we are looking to identify long-term, significant price movement rather than small fluctuations.
The Chart:
The ALMA is plotted as the aqua and pink alternating line. It is aqua when bullish and pink when bearish.
The low price for each candle is then compared to the ALMA. If the low is greater than the ALMA, then there is a bullish trend and the area between the candles and ALMA is filled green. The area between the ALMA and candles is filled red when the low price is less than the ALMA.
The difference between the slow ALMA and candles can reveal a lot about the current market state. If there is a significant green gap between the two, then we know that there is a significant uptrend taking place. On the other hand, a large red gap would indicate a significant downtrend. Similarly, if the gap between the two is narrowing and the ALMA line switches from aqua to pink, then we know that a reversal could be coming shortly.
~Happy Trading~
Abacus (CMF + Stoch. + Chop.) StrategyThis strategy combines uses Chaikin Money Flow, Stochastic Oscillator, and the Choppiness Index to determine trend strength and direction and generate entry and exit signals. This is a strategy adaptation of our earlier CMF + Stoch + Choppiness Index indicator.
