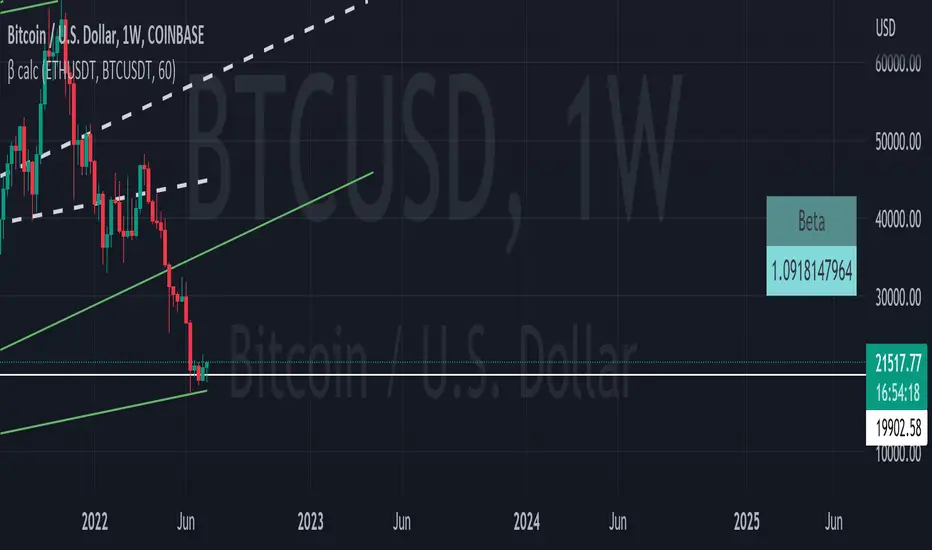
Beta CalculatorBeta is a measure of an asset's volatility relative to the market (the S&P500 is the most widely used index for this). A beta of 1 indicates that the asset moves exactly like the market, a beta < 1 indicates that the asset is less volatile than the market, and a beta > 1 means that the asset amplifies market movements.
This tool is used to calculate easily the Beta coefficient of an asset using 4 parameters :
- Symbol : The Asset's Ticker
- Reference : The Market Index Ticker
- Lookback Candles : The number of candles to include in the calculation
- (Implict) Resolution : The timeframe you are using, defines the precision
Calculator
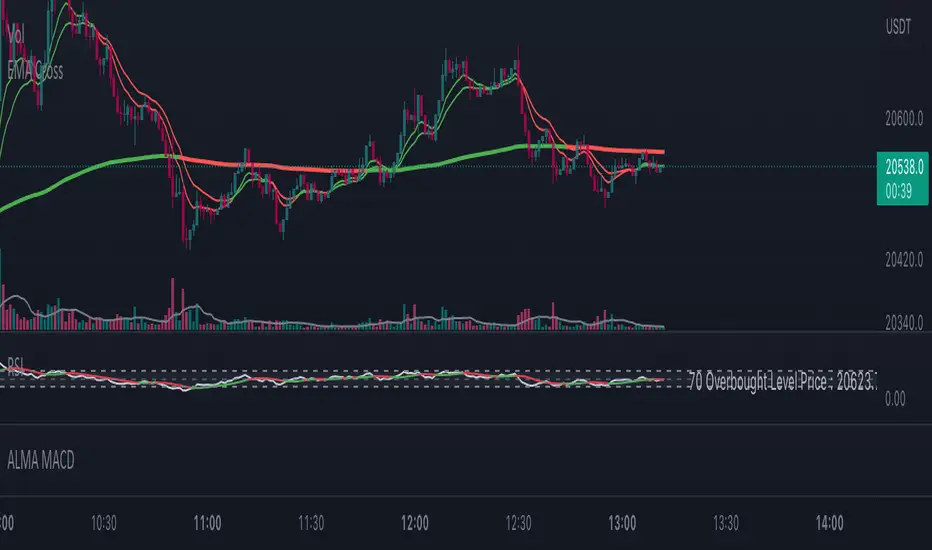
RSI + rCalcThis is a modification of the TradingView RSI.
I have added HMA and ALMA options to the MA settings and also the option for a colour change on RSI cross.
A reverse calc has also been added. This will display the MA cross/Overbought/Oversold price predictions. There is also the option to display an entered RSI or Price for a prediction display.
All colours and modifications can be turned on/off.
Enjoy! :)
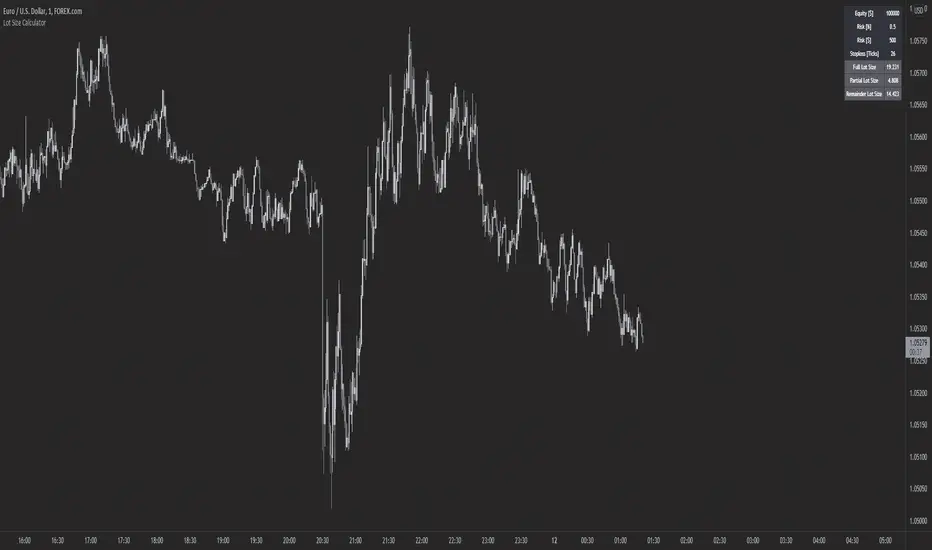
Forex Lot Size CalculatorTo use indicator you need to provide enter and stop prices(you can drag these lines also). Also you able to set your Account Size in USD, Risk in % and Commission you pay your broker per lot.
Indicator calculates all this information and provides you with Lot Size(with commission) you need to open a position and target prices for 2R and 3R(also includes commission).
Feel free to comment and request new features.

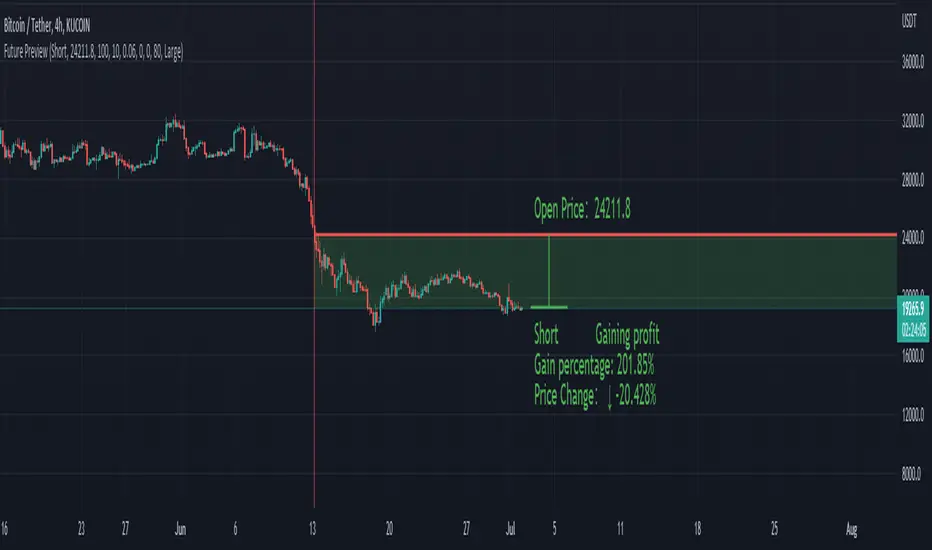
Future PreviewFuture Preview
Calculate real-time future order profit with open price, leverage and commission fee. Simple and straight forward. If you need any additional feature, please leave a comment below. I am glad to help.
Usage:
When adding Future Preview to chart, it will ask order open time and open price on the chart by clicking with left mouse on the desired value. These value can be changed lately, as well as the leverage and commission fee. Default leverage is 10 and default commission fee is 0.06% (taker).
There will be two horizontal lines. The solid longer line is the open price line, it shows the order open price. The shorter line moving with real-time price is the current price line, it shows the current price. There will be preview data shows on top or below the price line. Open price line is red for short order and green for long order. The current price line is red when the order is losing and it is green when it profiting. The back ground color follows the color of current price line. Background color transparency and gain/loss color can be changed in options.
There will be one horizontal line on the left if the option of showing open time is on (default is on). It shows the time stamp when current order opened.
After adding Future Preview to chart, there is option to add Taking Profit(TP) or Stop Loss(SL) to the chart.
Font size can be changed in option
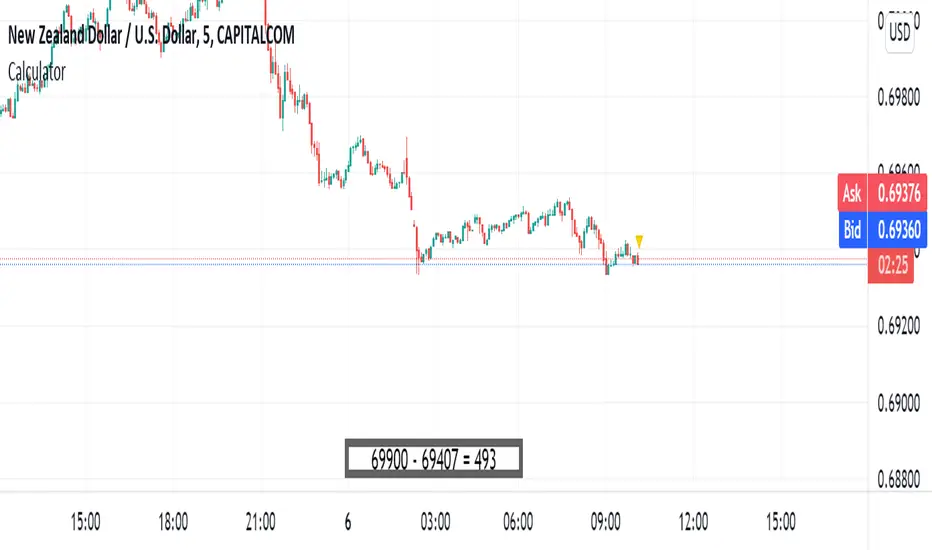
pineCalc- Calculator for PineHello and welcome to v1.00 of pineCalc - the calculator for Pine
A sleek, quick, and discrete calculator in a window pane in your chart!
Right now it supports basic math operation and series of two numbers but will try to update it and don't hesitate to comment any ideas
SOME FEATURES:
- Supports decimal numbers.
- Switch statement with option to choose Addition, Subtraction, Multiplication , or Division
- Choose any two numbers to use math on
- Inputs, Math Type and Result Output

crypto Position Size CalculatorCrypto Position Size Calculator
this indicator helps you to figure out the position size your trade . and its only used for crypto
the indicator needs to fill the input section in order to give you the information table that includes position size .
The input section consists two section the first section you will give the trade info like entry , stop loss and take profit .
then the next section its about your account balance and risk per trade . then you can get your position size .
you can have also option where you can display your table like bottom right , bottom left or top right its your choice.
special thanks : Ahmed busury
special thanks : Aj group family

Forex Lot Size Calculator [AKCHOOO]Forex Lot Size Calculator based off stop loss (ticks), also shows the lot size needed for taking partials (based of % of trade to close partial position).
credits
inspired by @DewMic
adapted from @hanabil
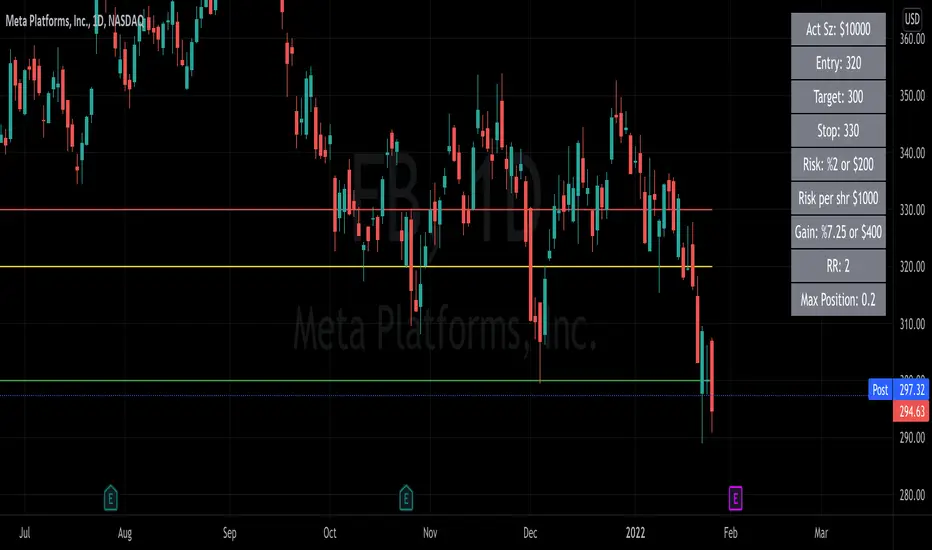
[TTI] Position Sizing Calculatorb]HISTORY AND CREDITS –––––––––––––––––––––––––––––––––––––––––––––––––––––––
"Perhaps the greatest secret to top trading and investing success is appropriate money management or what we now call POSITION SIZING" - Dr. Van Tharp, Definite Guide to Position Sizing (Market Wizard Book #1)
For those of you who have studied position sizing you know the power it can have to the bottom line of your portfolio.
WHAT IT DOES ––––––––––––––––––––––––––––––––––––––––––––––––––––––––––––––
The indicator allows you to quickly determine your position size after you decide to open a trading or investing position. Additionally, it gives you targets in terms of R-multiples (R) that tell you at what price level you achieve 2R or 200% return to a given risk.
The indicator also has the option to print these levels on chart for you.
You can use the calculator for the loaded ticker or other ticker that you wish.
1️⃣ Percent Calculator
👉 Choose position size (%) of total trading portfolio. General guideline here is 25% to be maximum (as per Mark Minervini criteria)
👉 Choose stop loss (%) of total position. This means that if you have 100k portfolio and your position size is 25% (25k), how much of that 25k are you willing to lose in order to asses you are wrong.
OR
2️⃣ Dollar Value Calculator
👉 Choose Stop Price ($) - general guidance is to use technical stop price.
👉 Choose Amount to risk ($) - this is the absolute amount of money you are willing to risk on a position
Both 1️⃣ & 2️⃣ calculate the targets and the target prices in order to determine where to take profits
Additionally, you get instant information for:
👉 How many shares you ought to buy
👉 What is the total size of the position to open
👉 What is your stop amount (either in $ terms or in $ of portfolio)
👉 What is the Risk to Total Equity with the current parameters.
HOW TO USE IT –––––––––––––––––––––––––––––––––––––––––––––––––––––––––––––
✅ STEP 1
Choose ticker and input the price at which you open a position
✅ STEP 2
Choose 1️⃣ Percent Calculator OR 2️⃣ Dollar Value Calculator
Depending on the parameters you use to open a position
✅ STEP 3
Review the table and the Additional data section to see how much Shares you ought to buy and what is the Risk To Total Equity
✅ STEP 4
Put Alerts for Stop Loss and Take Profits

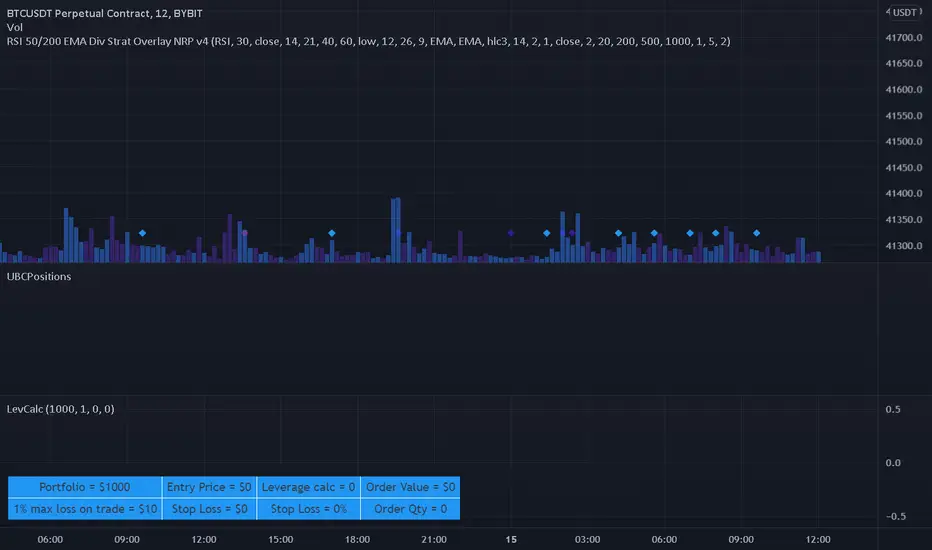
Leverage CalculatorThis script is intended to be used as a risk management calculator.
It will calculate the best leverage to use based on the maximum percentage of loss you are willing to incur on your trading portfolio.
Also calculates the order value and order qty based on your inputs.
Please note this calculator does not take into account any trading fees imposed by the exchange you are using.
*** Only risking 1% to 5% of your portfolio is considered good risk management ***
*** Not financial advice ***
------ Settings Inputs -----------------------------------------------------------------------------------------------------
"Portfolio Size" -- enter your portfolio balance
"% Willing to lose on this trade" -- enter the percent of your portfolio you are willing to lose if the stop loss is hit
"Entry Price" -- enter the price at which you will enter the trade
"Stop Loss Price" -- enter the price at which your stop loss will be set
----------------------------------------------------------------------------------------------------------------------------
------ Outputs -------------------------------------------------------------------------------------------------------------
"Portfolio" -- displays the portfolio balance entered in settings
"max loss on trade" -- displays the % loss entered in settings and the corresponding amount of your portfolio
"Entry Price" -- displays the entry price entered in settings
"Stop Loss Price" -- displays the stop loss price entered in settings
"Stop Loss %" -- displays the calculated percentage loss from the entry price
"Leverage calc" -- displays the calculated leverage based on your max loss and stop loss settings
"Order Value" -- displays the value of the order based on the calculated leverage
"Order Qty" -- displays the calculated order qty based on the calculated leverage
Risk Reward Position Size CalculatorThis can be used for Stocks or Options
This is a position size calculator. You must enter your Account size, Risk %, Entry, Stop, and Target. Then it will calculate your Max Position size, Risk Reward, Dollar gain and more.
It is completely customizable so you can change what you want the table to be showing.
It also can plot your entry, stop and target that you enter into the settings.
Position Size CalculatorPosition size calculator!
Lotsize is calculated by using properties described below.
Properties:
- Show position size: Will only be visible on 5m - 15m - 60m chart
- Account Currency:
- Account Size: Between 0 and 10 000 000 units of currency
- Risk: Between 0 and 100%
- Stoploss: Between 0 and 200 pips
- Textcolor
- Contract sizes for different assets:
- Indices: SPXUSD, DE30, NAS100, US30
- Bonds: ZB, ZN, ZF
- Gold: XAUUSD
- Oil: XTIUSD
- Currency futures: 6A, 6B, 6C, 6E, 6J, 6N, 6S
Other symbols can be added by request.
Enjoy!

SPY Option returns calculations This script allows you to calculate returns on double butterfly options, specifically for 0 DTE and 1 DTE(days to expiration) for options that have expiration on Monday, Tuesday and Friday(Mostly SPY). The script is bi-directional, meaning it will calculate the returns on a put and call butterfly simultaneously, not just a put or just a call butterfly. The script was developed to calculate how much return could be made on opening a double butterfly option by opening a position right at the open of the day on a 0 DTE option. The script rounds the price up or down to the nearest strike price at open. From there you would need to chose how far to select your options from the opening strike price. You would also need to select how many contracts you would like to open, negative - is selling an option positive + is buying an option. As an example the script is defaulted to a 0,2,4 strike position with buying 1 contract at the 0, selling 3 contracts at the +/- 2 strike and selling 2 contracts at the +/- strike. The default is set to an unbalanced double butterfly as it allows a better credit collection than a standard butterfly. To change to a standard butterfly change the # of contracts to 1 -2 and 1 respectively.
The script defaults a return of 0 on Tuesdays and Thursdays as there are no 0 DTE options available on those days.
If you have questions about script ask ... if you have questions about options ... the answers will likely take too much time to answer.

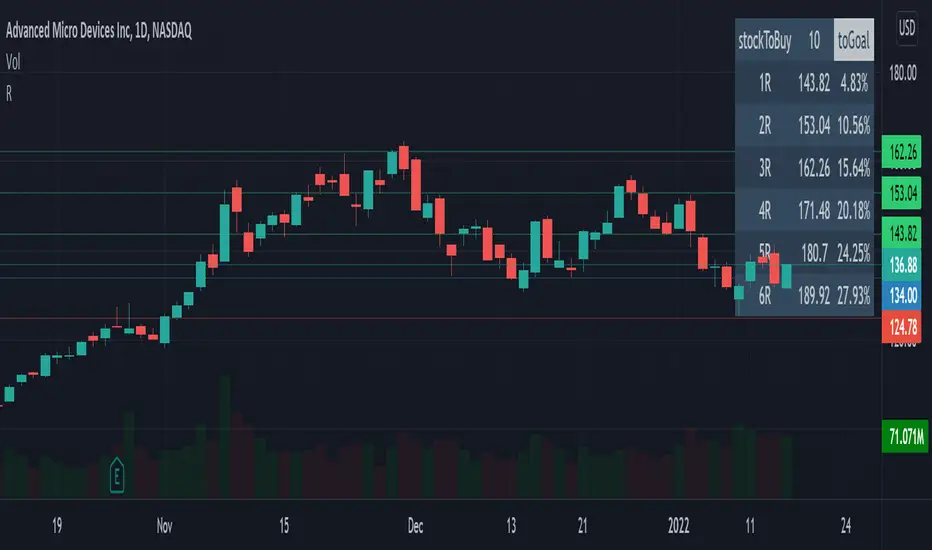
R-Calculator
Visualise your possible 1R to 6R prices, based on your Risk($), entry and stoploss price, and see the distance until the goal is fulfilled.
It also provides you with a suggested amount of stocks to buy, so if you lose, it will match -1R.
SignalsThis script allows you to calculate position size, and future profit, loses.
- You can add 3 target values and 1 stop loss
- Optionally you can display table, position it as you like, and see risk ratio
Plans:
- add profit loss to the labels

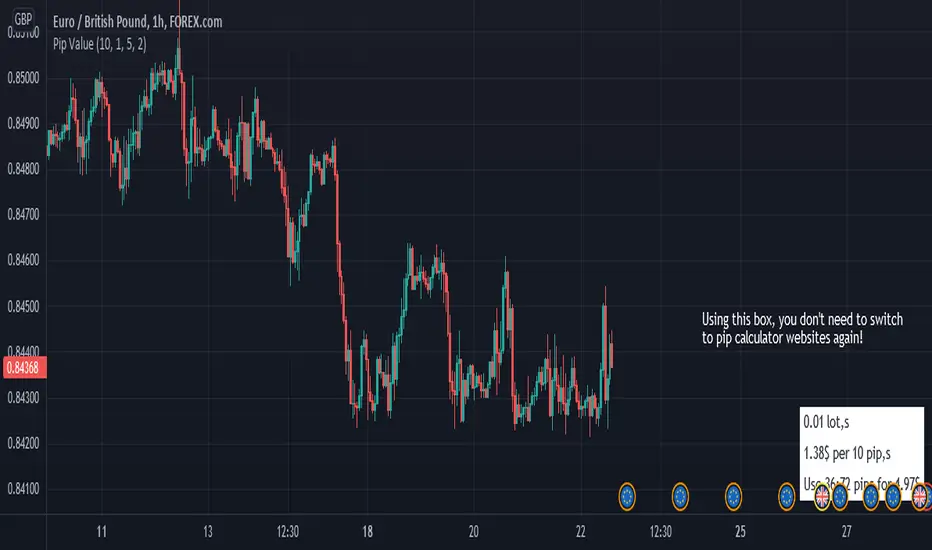
Pip Value Calculator(Original by ashkanpower)Japanese below / 日本語説明は下記
With this indicator, you can calculate profit and loss amount based on pips.
The original indicator is developed by ashkanpower and I have modified enabling to select account currency and font color.
Account currency can be selected from USD, JPY, EUR, GBP, AUD and THB.
Profit/loss amount can be calculated with the selected account currency.
Note: No spreads and commissions included. This is just for simulation only.
It works for forex only.
Original : Pip Value
Thank you @ashkanpower for inspiring me!
----------------------
Pipsを金額換算できるインジケーターです。
ashkanpower氏作成のインジケーター”Pip Value“を口座通貨の選択、フォントカラーの選択を可能なように改良しています。
選択可能な口座通貨は米ドル、日本円、ユーロ、ポンド、豪ドル、タイバーツです。
ポジションを立てる前の損益金額のシミュレーションにお使いください。
(ブローカーによって異なるスプレッドや手数料は含まれません。)
※FXの通貨ペアのみで動作します。
オリジナル : Pip Value

Pip ValueThis simple tool helps you manage your risk by calculating the exact price for pips.
it only works for forex pairs.
RISK calculatorA calculator for assessing and calculating risk.
In the settings, you enter the following data:
The size of your deposit (USD).
Trading leverage with an indication of the type of margin (cross or isolated).
Direction of the transaction (LONG or SHORT).
Input price (USD).
Lot size - select percentages, contracts or USD.
Take size - select the percentage or price (check box to display).
The size of the stop-loss - select the percentage or price (a check mark to display).
You can choose to display the liquidation price (check mark).
You can select the language: EN (English) or RU (Russian).
👉 On the screen, the indicator will visually display your position, specify the amount of income in case of take profit and the amount of loss in case of stop loss as a percentage, ROE and USD.
The liquidation price may give a small error, and it may definitely differ from the calculated one if you open other positions using a common deposit - 👉 consider this 👈
If you have any questions, you can write to me in private messages or in Telegrams (the address is in my signature).
------------------------------------
Калькулятор для оценки и расчёта риска.
В настройках Вы вводите следующие данные:
Размер Вашего депозита (USD).
Торговое плечо с указанием типа маржи (перекрёстная или изолированная).
Направление сделки (LONG или SHORT).
Цена входа (USD).
Размер лота - выбираете проценты, контракты или USD.
Размер тейка - выбираете проценты или цену (галочка для отображения).
Размер стоп-лосса - выбираете проценты или цену (галочка для отображения).
Можете выбрать отображение цены ликвидации (галочка).
Можете выбрать язык: EN(английский) или RU(русский).
👉 На экране индикатор отобразит визуально Вашу позицию, укажет размер дохода в случае тейк-профита и размер убытка в случае стоп-лосса в процентах, ROE и USD.
Цена ликвидации может давать небольшую погрешность, и однозначно может отличаться от расчётной, если Вы открываете другие позиции используя общий депозит - 👉 учитывайте это 👈
По всем вопросам Вы можете писать мне в личные сообщения, либо в Telegram (адрес в моей подписи).

RSI Back-calculation■Purpose of this script
Back-calculate the stock price limit based on the RSI formula
■Logic overview
This time, RSI calculation formula by Cutler is adopted.
In this formula, RSI is calculated from the ratio of the sum of price movements and the sum of price increases during a fixed period.
This script back-calculates future stock prices from past stock price data and set RSI values.
Therefore, you can receive the offer of the buy price in the oversold phase and the offer of the sell price in the overbought phase with reference to the RSI index.
■How to use
・Enter the following on the parameters input screen
・sauce (usually close)
・Reference period(14 is optimal by J.W. Wilder)
・RSI target value (Generally, buy below 30 and sell above 70)
・When to ask for stock price (After the latest bar closing price is decided: next. The latest bar is moving: current.)
For example, when selecting a daily chart, before trading hours: , during trading hours:
when selecting a weekly chart, the closing price is not fixed, for example on Wednesday:

[HuD] Position SizingCalculate Position Sizing based on user input :
1. Capital
2. Entry Price
3. Stop Loss
4. Risk %
5. Risk Reward Ratio. Advisable to set RRR minimum 1.5
Indi will :
1. Plot Entry, Take Profit and Stop Loss Line
2. Calculate Position Sizing in RM and Total Unit and Lot
3. Gross Profit ( not including Brokerage Fees )

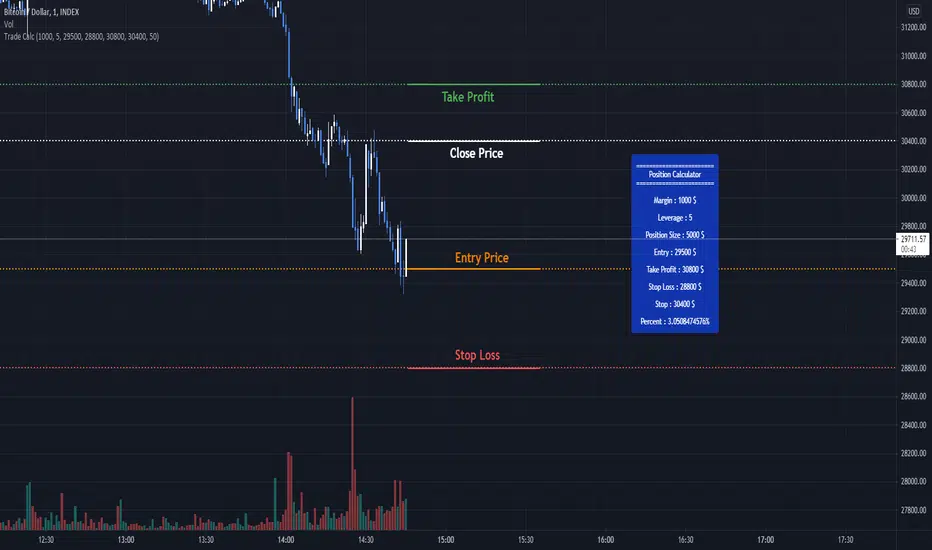
Trade Calculator by RealmixA clean Trade Calculator for any Asset, which calculates everything you need to know.
This script is a modified version of the Position Calculator by Mysteriown. Link:
I try to make it a bit better for Futures Trading.
Artharjan Profit & Loss CalculatorHi,
Artharjan Profit and Loss Calculator allows users to calculate Profit and Loss of their trades and see it on the chart itself
Users are supposed to select either Long or Short, Enter quantity and enter traded price. The live P&L will be plotted on the chart.
Happy trading :-)
Rahul

Position calcCurrent script was created to help faster calculate possible gain or loss from a furure trade. Making money management a bit simpler, by changing values you can adjust proper trade leverage and see possible target values
