Volatility-Dynamic Risk Manager MNQ [HERMAN]Title: Volatility-Dynamic Risk Manager MNQ
Description:
The Volatility-Dynamic Risk Manager is a dedicated risk management utility designed specifically for traders of Micro Nasdaq 100 Futures (MNQ).
Many traders struggle with position sizing because they use a fixed Stop Loss size regardless of market conditions. A 10-point stop might be safe in a slow market but easily stopped out in a high-volatility environment. This indicator solves that problem by monitoring real-time volatility (using ATR) and automatically suggesting the appropriate Stop Loss size and Position Size (Contracts) to keep your dollar risk constant.
Note: This tool is hardcoded for MNQ (Micro Nasdaq) with a tick value calculation of $2 per point.
📈 How It Works
-This script operates on a logical flow that adapts to market behavior:
-Volatility Measurement: It calculates the Average True Range (ATR) over a user-defined length (Default: 14) to gauge the current "speed" of the market.
-State Detection: Based on the current ATR, the script classifies the market into one of three states:
Low Volatility: The market is chopping or moving slowly.
Normal Volatility: Standard trading conditions.
High Volatility: The market is moving aggressively.
Dynamic Stop Loss Selection: Depending on the detected state, the script selects a pre-defined Stop Loss (in points) that you have configured for that specific environment.
Position Sizing Calculation: Finally, it calculates how many MNQ contracts you can trade so that if your Stop Loss is hit, you do not lose more than your defined "Max Risk per Trade."
🧮 Methodology & Calculations
Since this script handles risk management, transparency in calculation is vital.
Here is the exact math used:
ATR Calculation: Contracts = Max Risk / Risk Per Contract
⚙️ Settings
You can fully customize the behavior of the risk manager via the settings panel:
Risk Management
-Max Risk per Trade ($): The maximum amount of USD you are willing to lose on a single trade.
Volatility Thresholds (ATR)
-ATR Length: The lookback period for volatility calculation.
-Upper Limit for LOW Volatility: If ATR is below this number, the market is "Low Volatility."
-Lower Limit for HIGH Volatility: If ATR is above this number, the market is "High Volatility." (Anything between Low and High is considered "Normal").
Stop Loss Settings (Points)
-SL for Low/Normal/High: Define how wide your stop loss should be in points for each of the three market states.
Visual Settings
-Color Theme: Switch between Light and Dark modes.
-Panel Position: Move the dashboard to any corner or center of your chart.
-Panel Size: Adjust the scale (Tiny to Large) to fit your screen resolution.
📊 Dashboard Overview
-The on-screen panel provides a quick-glance summary for live execution:
-Market State: Color-coded status (Green = Low Vol, Orange = Normal, Red = High Vol).
-Current ATR: The live volatility reading.
-Suggested SL: The Stop Loss size you should enter in your execution platform.
-CONTRACTS: The calculated position size.
-Est. Loss: The actual dollar amount you will lose if the stop is hit (usually slightly less than your Max Risk due to rounding down).
Who is this for?
-Discretionary and systematic futures traders on MNQ (/MNQ or MES also works with small adjustments)
-Anyone who wants perfect risk consistency regardless of whether the market is asleep or exploding
-Traders who hate manual position-size calculations on every trade
No repainting
Works on any timeframe
Real-time updates on every bar
Overlay indicator (no signals, pure risk-management tool)
⚠️ Disclaimer
This tool is for informational and educational purposes only. It calculates mathematical position sizes based on user inputs. It does not execute trades, nor does it guarantee profits. Past performance (volatility) is not indicative of future results. Always manually verify your order size before executing trades on your broker platform.
Calculator

Universal Lot Size Calculator (Forex, Index, Metals)Multi-functional lot size calculator with support for various instruments
🎯 MAIN FEATURES:
Universal — works with Forex, indices, metals, and custom instruments
Auto-detect — automatically detects instrument type by ticker
Precise position sizing - considering risk and currency conversions
Currency conversion — automatic conversion between deposit currencies
Advanced visualization — entry, stop-loss, take-profit lines
Smart table — convenient display of all parameters
⚙️ SETTINGS GROUPS:
📈 Instrument Settings
Instrument Type — selection: Auto, Forex, Index, Metals, Custom
Custom Contract Size — manual contract size configuration
Use Manual Exchange Rate — manual rate for currency conversion
💰 Account & Risk Settings
Deposit Currency — account currency (USD, EUR, GBP, CHF, JPY)
Account Size — deposit amount
Risk in % — risk percentage from deposit
🎯 Price Levels
Entry Price — entry price
Stop Price — stop-loss price
Target Price — take-profit price
Color settings for each line
📊 Risk/Reward Settings
Manual Target Price — manual TP setting
Show R Levels — display profit levels in R multiples
Show only last R level — show only the last R level
Number of R Levels — number of R levels (1-10)
🎨 Line Styles & Table Appearance
Line style settings (solid, dashed, dotted)
Line width
Table position and size
Color schemes
📈Supported instrument types:
Forex — standard lot 100,000
Indices — E-mini futures (US100=20, SP500=50, US30=5, DAX=25)
Metals — Gold=100 oz, Silver=5000 oz
Custom — user-defined contract size
📱 KEY FEATURES:
- Auto instrument detection:
Indices: US100, SP500, US30, DAX
Metals: XAUUSD (Gold), XAGUSD (Silver)
Forex: all currency pairs
- Smart table with key parameters:
Instrument type and contract size
Account size and risk
Entry/exit prices
Calculated lot size
- Visual elements:
Dynamic level lines
Labels with profit/loss calculations
R-levels for target prices
- Currency conversion:
Automatic rate fetching
Support for USD, EUR, GBP, CHF, JPY
Manual rate setting when needed
⚠️ IMPORTANT NOTES:
Contract sizes may vary between brokers
For CFD brokers use Custom type with Contract Size = 1
During weekends currency rates may be unavailable — use manual rate
When trading in different currencies verify conversion accuracy
🚀 HOW TO USE:
Select instrument type (Auto for auto-detection)
Set deposit size and account currency
Define risk percentage (1-100%)
Specify prices for entry, stop-loss, and take-profit
Use calculated lot to open positions
⚠️ RESETTING CALCULATIONS:
To reuse the calculator with new price levels, you need to:
Right-click on the indicator's table/chart
Select "Reset Points" from the context menu
OR manually update all three price levels (Entry, Stop Loss, Take Profit) in the settings

Multi-Account Lot Calculator (@JP7FX)Multi-Account Lot Calculator (JP7FX)
Multi-Account Lot Calculator shows a single trade idea across multiple accounts and currencies. It builds a panel on the chart that displays risk per account and the lot size needed for a chosen stop distance and R multiple.
Trade and asset settings
You define the shared trade settings once: direction (long or short), stop loss distance in pips, risk to reward, and entry price or use close.
The script supports Forex, stock, crypto, XAU/USD and index/CFD, with automatic or manual pip size and contract size. It also includes inputs for index point size and value per point when using index or CFD symbols.
Entry, SL and TP visuals
The script plots entry, stop loss and take profit lines on the chart.
Labels can show the exact prices and the R multiple for the take profit.
Optional zones between entry and SL, and entry and TP, can be drawn on the right side of the chart.
A lock feature lets you freeze the trade window and price levels manually or when price touches entry. When locked, the script can keep zones visible using line fills and can auto extend the right edge as new bars print.
Multi account panel
Up to six accounts can be configured at the same time.
For each account you can set:
• a custom name
• account balance
• account currency (USD, EUR, GBP, AUD, NZD, CAD, CHF, JPY)
• risk mode (percent or cash)
• preset risk percent or fixed cash risk
The panel calculates, per account:
• risk amount in that account’s currency
• lot size for the given stop loss distance
Currency conversion
Risk and lot sizing use the symbol’s quote currency and convert it into each account currency with request.currency_rate.
A fallback conversion rate can be set if live data is not available.
Table layout and style
The on-chart table shows columns for Account, CCY, Balance, Mode, R%, Risk Amt and Lot.
You can choose the panel position, border width, title and subheader colours, row colours and optional zebra rows.
Use cases
This tool is intended for traders who run several accounts or prop firm accounts in different currencies and want a single view of position size per account for the same trade idea.

Position Size Tool [Riley]Automatically determine number of shares for an entry. Quantity based on a stop set at the low of day for long positions or a stop set at the high of the day for short positions. As well as inputs like account balance risk per trade. Also includes a user-defined maximum for percentage of daily dollar volume to consume with entry.

Position Size Calculator + Live R/R Panel — SMC/ICT (@PueblaATH)Position Size + Live R/R Panel — SMC/ICT (@PueblaATH)
Position Size + Live R/R Panel — SMC/ICT (@PueblaATH) is a professional-grade risk management and execution module built for Smart Money Concepts (SMC) and ICT Traders who require accurate, repeatable, institution-style trade planning.
This tool delivers precise position sizing, R:R modeling, leverage and margin projections, fee-adjusted PnL outcomes, and real-time execution metrics—all directly on the chart. Optimized for crypto, forex, and futures, it provides scalpers, day traders, and swing traders with the clarity needed to execute high-quality trades with confidence and consistency.
What the Indicator Does
Institutional Position Sizing Engine
Calculates position size based on account balance, % risk, and SL distance.
Supports custom minimum lot size rounding across crypto, FX, indices, and derivatives.
Intelligent direction logic (Auto / Long / Short) based on SMC/ICT structure.
Advanced Risk/Reward & Profit Modeling
Real-time R:R ratio using actual rounded position size.
Live PnL readout that updates with price movements.
Gross & net profit projections with full fee deduction.
Execution Planning with Draggable Levels
Entry, SL, and TP levels fully draggable for fast scenario modeling.
Automatic projected lines backward/forward with clean label alignment.
TP and SL tags include % movement from Entry, ideal for SMC/ICT journaling.
Precise modeling of real exchange fee structures
Maker fee per side
Taker fee per side
Mixed fee modes (Maker entry, Taker exit, Average, etc.)
Leverage & Margin Forecasting
Margin requirements displayed for 3 customizable leverage settings.
Helps traders understand capital commitment before executing the trade.
Useful for futures, crypto perps, and CFD setups.
Clean HUD Panel for Rapid Decision-Making
A full professional trading panel displays:
Target & actual risk
Position size
Entry / SL / TP
TP/SL percentage distance
Gross profit
Net profit (after fees)
Fees @ TP and @ SL
Live PnL
Margin requirements
Optimized for SMC & ICT Workflows
Perfect for traders using:
Breakers, FVGs, OBs
Liquidity sweeps
Session models
Precision entries (OTE, Displacement, Rebalancing)
Leverage-based execution (crypto perps, futures)
How to Use It
Attach the indicator to your chart.
Set account balance, risk %, fee model, and leverage presets.
Drag Entry, SL, and TP to shape the setup.
View instant calculations of: Position size; R:R; Net PnL after fees; Margin required
Use it as your pre-trade checklist & execution model.
Originality & Credits
This script is an original creation by @PueblaATH, released under the MPL 2.0 license.
It does not copy, modify, or repackage any existing TradingView code.
All logic—including the fee engine, margin calculator, responsive HUD, dynamic risk model, and visual execution system—is authored specifically for this indicator.

Micro/Mini P&L [LDT]Overview
Micro/Mini P&L is a risk and P&L visualization tool built primarily for futures traders.
It provides accurate dollar-based calculations for either micros or minis, regardless of which contract type you are currently charting.
The indicator automatically detects your instrument (NQ, MNQ, ES, MES, YM, RTY, CL, GC, etc.) and adjusts point-value data accordingly, allowing you to chart one contract while evaluating risk for another.
This removes the need for manual conversions and keeps your position data consistent at all times.
Although optimized for futures, the tool also works on any other asset for general trade-level visualization.
Features
• Automatic instrument detection for major futures markets including NQ/MNQ, ES/MES, YM/MYM, RTY/M2K, CL/MCL, GC/MGC and others.
Point-value logic adjusts instantly based on the detected symbol ensuring accurate calculations without manual configuration.
• Micro/Mini display toggle, allowing you to calculate dollar values for either contract type regardless of which contract is on your chart.
Useful for traders who prefer charting minis whilst trading micros or the opposite.
• Trade-level visualization, including Entry, Take Profit and Stop Loss levels with automatically drawn lines and optional TP/SL zone shading for clear and structured display on the chart.
• Dynamic P/L calculations, showing both point-based and dollar-based metrics in real time.
This includes TP/SL dollar values, points to target/stop, real-time P/L and an optional risk-reward ratio.
• Adaptive risk table, displaying contract counts from 1 up to your selected maximum, total dollar risk for each row and highlighting your chosen contract size.
This provides a straightforward method for evaluating risk, scaling and position sizing.
• Customizable display options, including color settings, label visibility, extension length, bar offsets and table positioning.
This allows the tool to remain clean, unobtrusive and easy to integrate into any chart layout.
Purpose
This tool is designed to give futures traders a clear, consistent and reliable way to view dollar-accurate risk per contract without performing manual conversions.
Whether you trade micros or minis, the displayed values always align with your selected contract type, even when charting the opposite market.

calculator contracts MNQ PIPEGAVTRADESThis is a Risk Management indicator that calculates the exact contracts to trade based on your defined Max Risk ($) and Stop Loss Ticks.
It displays all key Position Sizing metrics (including Account Capital and Risk %) in a fixed table on the chart.

Lot Size CalculatorLot Size Calculator for Gold (XAU)
This indicator helps traders calculate the proper lot size for Gold (XAU) based on their entry, stop loss, and risk amount in USD.
You can set your entry and stop levels directly on the chart, and adjust your dollar risk from the settings panel.
The indicator measures the distance between entry and stop to calculate the position size that matches your selected risk.
A clean, customizable table displays key values such as Risk, Entry, Stop, Target, Lots, and Pips.
You can easily hide specific rows, change colors, and adjust layout options to fit your chart style.
Designed specifically for Gold traders, this tool provides a simple and visual way to manage risk directly on the chart.

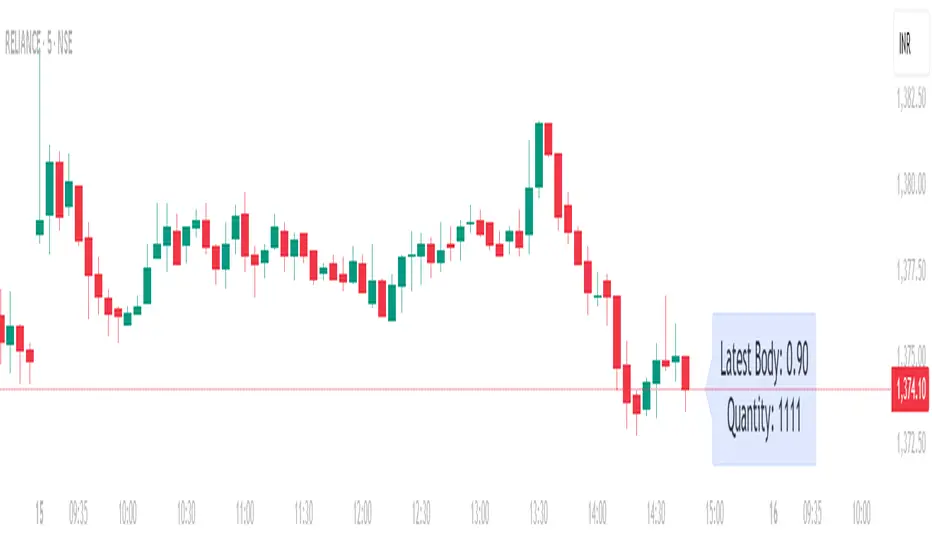
Position Size calculatorOverview
This indicator automatically calculates the average candle body size (|open − close|) for the current trading day and derives a position size (quantity) based on your fixed risk per trade (default ₹1000).
For example:
If today’s average candle body = ₹3.50 and risk = ₹1000 → Quantity = 285
How It Works:
The indicator calculates the absolute difference between open and close (the candle’s body) for every bar of the current day.
It averages those body sizes to estimate the average daily volatility.
Then it divides your chosen risk per trade by the average body size to estimate an appropriate quantity.
It automatically resets at the start of each new day.
Why Use It
While risk size can be derived manually or using TradingView’s built-in Long/Short Position Tool, this indicator provides a faster, more practical alternative when you need to make quick trade decisions — especially in fast-moving intraday markets .
It keeps you focused on execution rather than calculation.
Tip
You can still verify or fine-tune the quantity using the Long/Short Position Tool or a manual calculator, but this indicator helps you react instantly when opportunities appear.
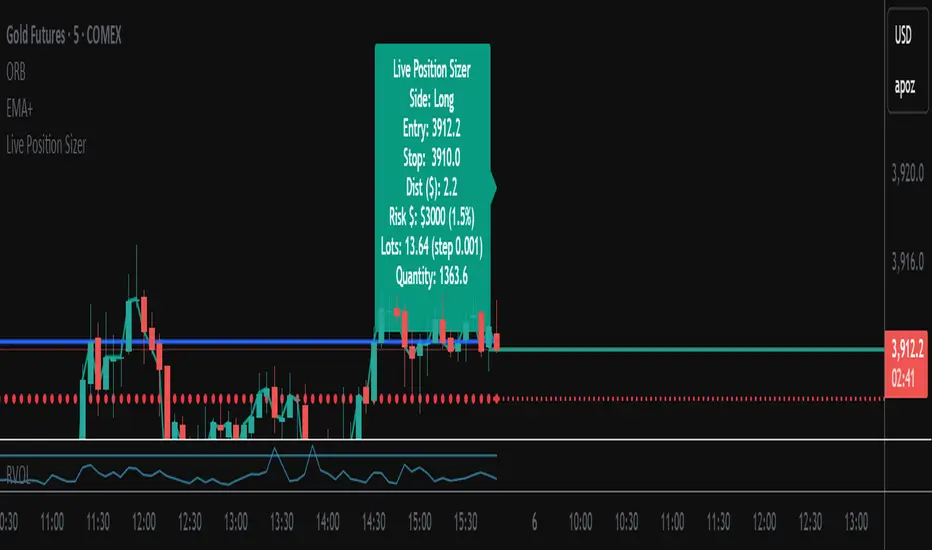
Live Position SizerThis position calculator locks onto the live price in real time and calculates your lot and quantity size for you. Best for scalping if you don't want to open a limit order. You input all the necessary data (Account size, risk, SL placement, LONG/SHORT position, etc...) It also has a nifty feature of allowing you the ability to see TP brackets (+1R, +2R, +3R).
The best way I have used it is seeing where my potential SL will go before I consider opening a position and inputting that. Then when I'm ready to open a position, I already have it calculated for me.
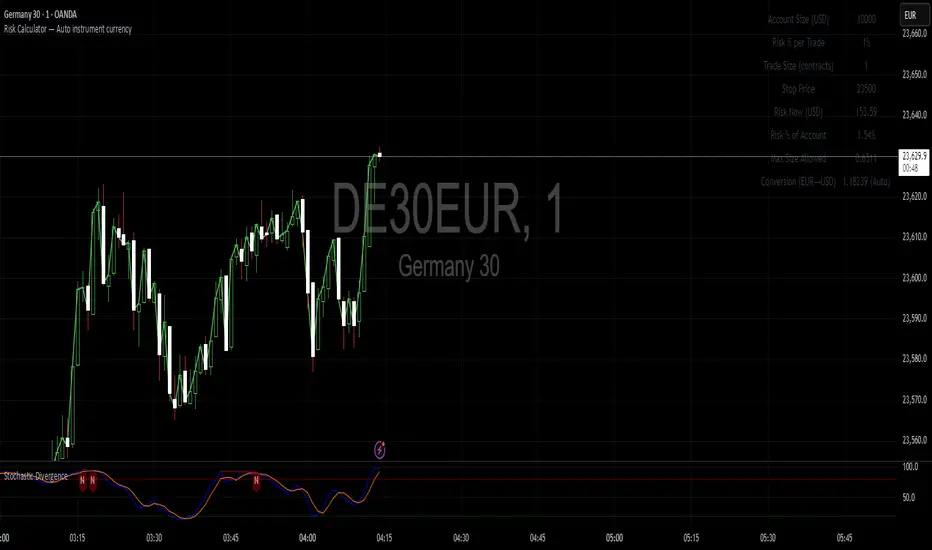
Risk Calculator You can enter your account size and your stop-loss level, and the calculator will display the risk you are taking both as an actual monetary value and as a percentage of your account. If your account currency differs from the instrument’s currency, you can also input a conversion factor to see the risk in your account currency.
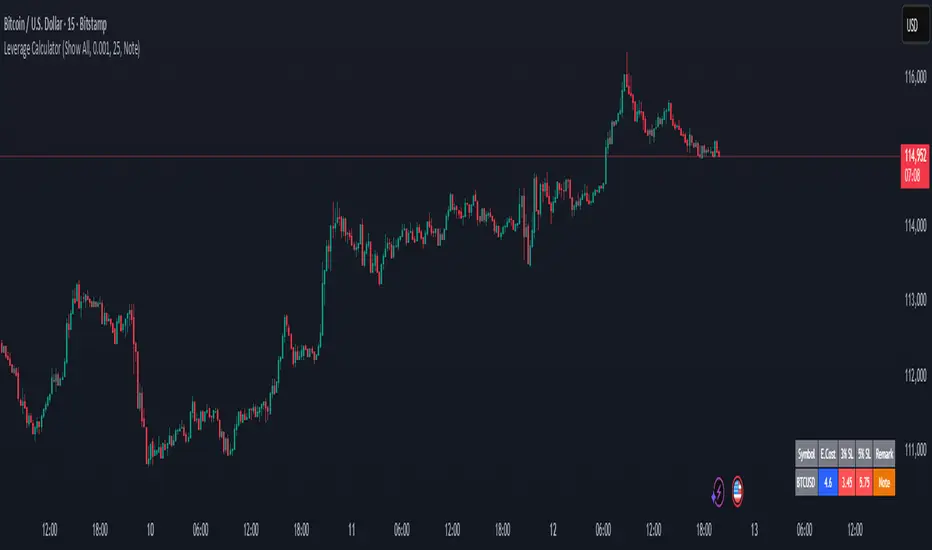
Margin Cost Calculator Screener - Taylor V1.2# Leverage Position Cost Calculator & Stop Lose Cost Screener #
Designed to provide traders with crucial insights into their leveraged positions directly on the TradingView chart.
Key Features:
> Dynamic Display: Choose to view only the estimated entry cost, or a comprehensive overview including potential losses at specific stop-loss levels, and a custom remark.
> Contract Size Input: Easily specify the contract size for your trades.
> Leverage Level Input: Set your desired leverage level, with helpful tooltips explaining the margin requirements for various leverage ratios (e.g., 25x, 10x, 5x) and an included fee estimate.
> Cost Calculation: Accurately calculates the estimated entry cost for your position based on the current market price, contract size, and leverage.
> Stop-Loss Projections: It projects potential losses for stop-loss orders set at 3% and 5% below the entry price, helping you manage risk effectively.
> Clear Table Visualization: All calculated data is presented in a clean, organized table anchored to the bottom-left of your chart, making it easy to reference at a glance.
> Symbol Identification: Automatically displays the short ticker symbol for the asset you are analyzing.
This tool is invaluable for traders who utilize leverage and need a quick, visual way to understand their financial exposure and potential outcomes before entering or managing a trade.
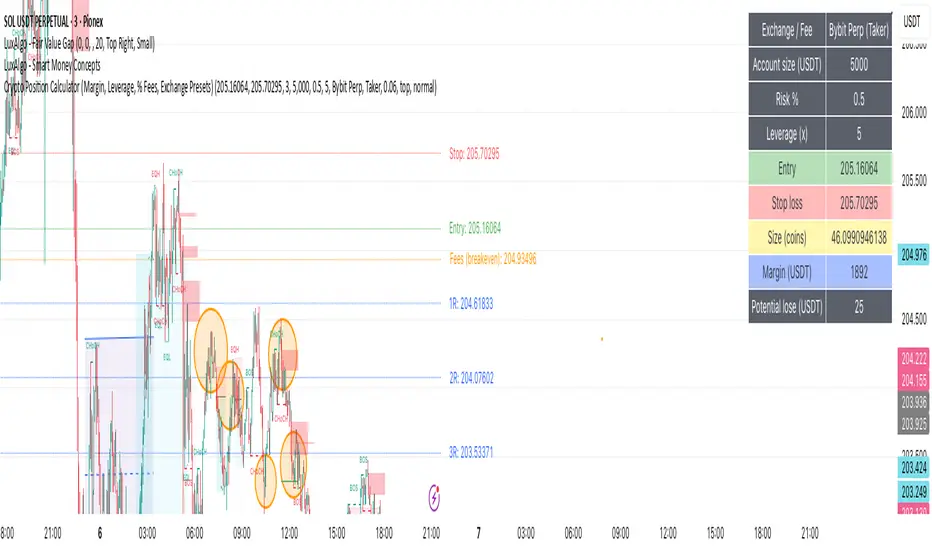
Crypto Position CalculatorAlpha2Million - Crypto Position Calculator (Margin, Leverage, % Fees, Exchange Presets)
This script is a crypto trading risk & position calculator built directly into TradingView.
It helps futures/perpetual traders size positions, calculate margin requirements, and visualize risk-to-reward levels on the chart — with exchange fee presets for real-world accuracy.
• Position Sizing by Risk %
• Enter account size and % risk per trade.
• Script calculates exact position size (coins) based on SL distance.
• Leverage & Margin
• Shows required notional and margin (USDT) for the trade.
• Exchange Fee Presets
• Supports Binance, Bybit, Pionex, MEXC, Gate.io, KuCoin, HTX.
• Maker vs Taker fee selection.
• Custom option to enter your own per-side fee %.
• Fee Breakeven Line (Orange)
• Plots the exact price level you need to reach to cover entry + exit fees.
• Lets you see how far price must move before you are at true breakeven.
• Risk vs Reward Calculation
• Risk is calculated on price movement only (SL distance).
• Profit targets include fees, so “1R / 2R / 3R (net)” lines show realistic levels.
• Smart Table Display
• Account size, leverage, entry, stop, target.
• Position size (coins), notional (USDT), required margin.
• Risk at SL, fees (round trip), fee breakeven move/price.
• Profit @ TP (after fees) and net RR.
Position Size CalculatorPosition Size Calculator
This open-source Pine Script® indicator helps traders manage risk by calculating position size, margin, and risk/reward based on account size, leverage, entry, stop-loss, and take-profit. It features a customizable table and optional chart lines/labels for clear trade planning across stocks, forex, crypto, and futures.
What It Does
- Position Size: Computes units to trade based on risk percentage and stop-loss distance, capped by leverage.
- Margin: Calculates initial margin in base currency and USD, with account size percentage.
- Risk/Reward: Shows risk-reward ratio, percentage price movements, and USD gains/losses.
- Visualization: Displays results in a table and optional chart lines/labels with customizable styles.
How It Works
- Precision: Adjusts price formatting using syminfo.mintick for accuracy across assets.
- Calculations: Position size = accountSize * (riskPercent / 100) / |entry - stoploss|, capped by accountSize * leverage / entry. Margin = positionSize / leverage. Risk-reward = |takeprofit - entry| / |stoploss - entry|.
- Display: Table shows metrics; optional lines/labels plot entry, stop-loss, and take-profit with percentage and USD details.
How to Use
- Set Inputs:
1- Account Size (USD): Your capital (e.g., 1000).
2- % Risk per Trade: Risk tolerance (e.g., 1%).
3- Leverage: Broker leverage (e.g., 1x, 10x).
4- Entry, Stop Loss, Take Profit: Trade prices.
5- Show Lines and Labels: Enable chart overlays.
- Customize: Adjust table position, colors, and line styles (Solid, Dashed, Dotted).
- View Results: Table shows position size, margin, and risk/reward. Chart lines/labels (if enabled) display prices, percentages, and USD outcomes.
- Apply: Use metrics for trade execution; modify code for custom features.
Notes
- Ensure valid inputs (entry ≠ stop-loss, both positive) to avoid “N/A”.
- Open-source: Inspect or extend the code for your needs.
- Contact the author via TradingView for feedback.

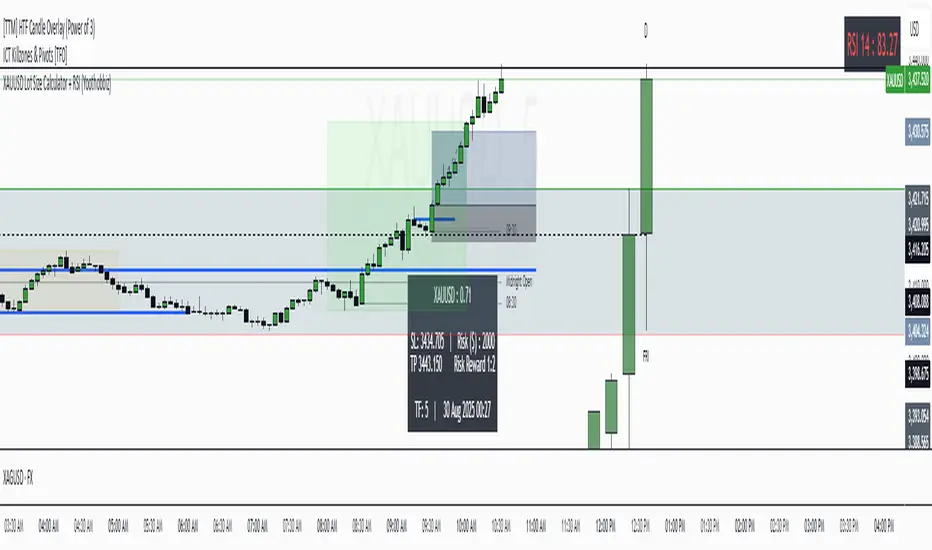
XAUUSD Lot Size Calculator + RSI (Yoothobbiz)This indicator is designed for Gold traders on the 5-minute timeframe (M5) who want a clear and editable lot size, stop loss, and take profit calculator directly on their chart.
✨ Features:
📌 Dynamic Lot Size Calculation – based on account capital, chosen risk %, and stop loss distance.
⚖️ Risk/Reward Management – automatically displays TP level using a customizable risk/reward ratio (e.g., 1:2, 1:3, etc.).
🛑 Stop Loss in Points & Price – calculates SL from recent M5 highs/lows, including spread.
🎯 Take Profit in Price & Points – automatically adjusted to your risk/reward ratio.
💵 Risk in USD – instantly shows how much capital is at risk per trade.
🕒 Custom Time Zone Support – displays the real trading time (default UTC-4 for New York), fully editable for any user.
⏱ Timeframe Label – clearly shows the working timeframe (M5 by default).
🎨 Fully Editable Display Panel:
Position (6 corners available).
Font family, size, style (bold/italic).
Text and background colors.
Adjustable spacing between lines.
🔑 How to Use:
Set your capital and risk % in the settings.
Adjust spread (in points) if needed.
Choose your risk/reward ratio.
The panel will display:
Recommended lot size for XAUUSD
Stop loss (price + points)
Take profit (price + ratio)
Risk in $
Timeframe & real-time clock
📍 Notes:
Optimized for XAUUSD (Gold) and the 5M timeframe.
Works on any asset/timeframe, but SL logic is based on M5 candle highs/lows.
Ideal for traders who want a fast and disciplined risk management tool right on their chart.
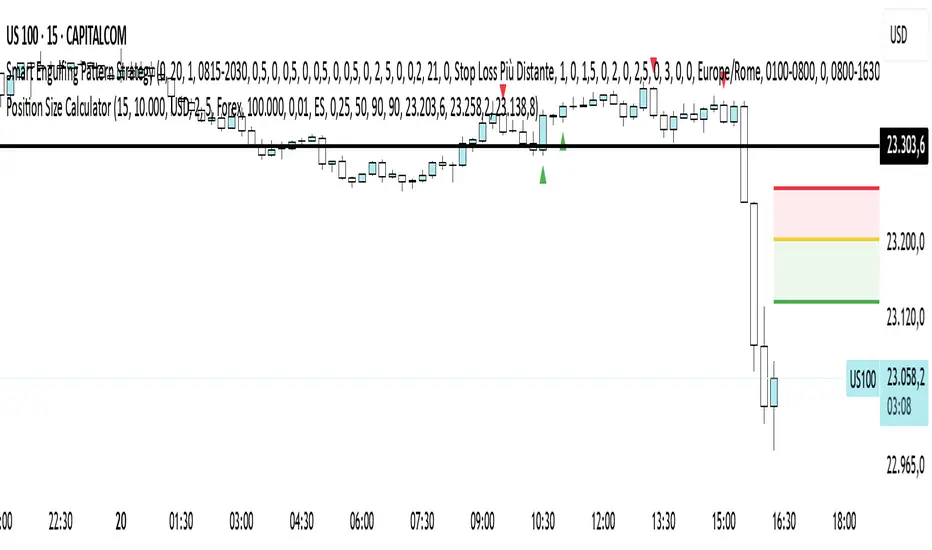
Index Position Size Calculator for [US30 / US100 / SP500]What it does
This tool helps you size positions consistently for index trades on US30 (Dow Jones), NAS100 (Nasdaq-100), and SP500 (S&P 500). Enter your account balance, risk %, and your planned Entry / Stop-Loss / Target and the script calculates:
• Position Size (rounded to your lot/contract step)
• Risk-to-Reward (R/R)
• Potential P/L in USD based on your inputs
• Visual Entry / SL / TP lines with green/red zones and concise labels
Supported contract styles
Choose a preset for common products (e.g., CFD $1/pt, YM/NQ/ES futures, MYM/MNQ/MES micros) or override the economics yourself. You remain in control of the two key levers:
• $/point — how many dollars you gain/lose per 1 index point per contract/lot
• Point size — how many price units equal 1 index point on your chart (often 1.0, but some brokers use 0.1 or 0.5)
Inputs
• Account Balance ($) and Risk % per trade
• Index: US30 / NAS100 / SP500
• Contract: CFD / Futures (YM, NQ, ES) / Micros (MYM, MNQ, MES)
• $/point: auto from Contract or manual override
• Point size: auto from Index or manual override
• Position size step: rounding (e.g., 1 for futures, 0.01 for CFDs)
• Entry / SL / TP: typed values (snapped to tick), with on-chart zones and labels
• Display toggles for lines and labels
How the math works
• StopPoints = |Entry − SL| ÷ PointSize
• ProfitPoints = |TP − Entry| ÷ PointSize
• Position Size = (AccountBalance × Risk%) ÷ (StopPoints × $/point)
• R/R = ProfitPoints ÷ StopPoints
• Potential P/L = PositionSize × Points × $/point
How to use (quick start)
1. Select Index and Contract.
2. Confirm $/point and Point size match your broker’s specs.
3. Enter Entry / SL / TP for the trade idea.
4. Read the Position Size, R/R, and Potential P/L in the info box.
5. Adjust for fees, spreads, and slippage as needed.
Notes & limitations
• Broker symbols can vary. Always verify $/point and Point size for your instrument before risking capital.
• The script does not place orders and does not generate trade signals; it’s a sizing/visualization tool.
• Results can differ across brokers due to pricing, spreads, minimum lot sizes, and execution rules.
• Use on the intended indices; you’ll see a reminder if you load it elsewhere.
Changelog highlights
• Pine v6, constant-safe inputs, tick-snapping, global fills (no local-scope errors).
• Robust label handling and optional minimal chart markers.
Disclaimer
This script is provided for educational purposes only and does not constitute financial advice or a recommendation to buy or sell any security or derivative. Trading involves risk, including the possible loss of principal. Always do your own research, verify contract specifications with your broker, and consider testing in a demo environment before trading live.

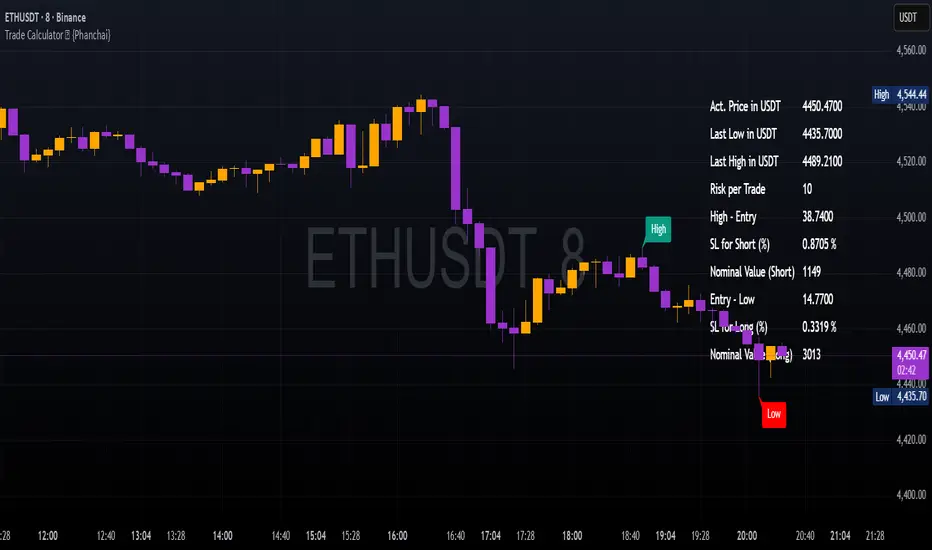
Trade Calculator {Phanchai}Trade Calculator 🧮 {Phanchai} — Documentation
A lightweight sizing helper for TradingView that turns your risk per trade into an estimated maximum nominal position size — using the most recent chart low as your stop reference. Built for speed and clarity right on the chart.
Key Features
Clean on-chart info table with configurable font size and position.
Row toggles: show/hide each line (Price, Last Low, Risk per Trade, Entry − Low, SL to Low %, Max. Nominal Value in USDT).
Configurable low reference: Last N bars or Running since load .
Low label placed exactly at the wick of the lowest bar (no horizontal line).
Custom padding: add extra rows above/below and blank columns left/right (with custom whitespace/text fillers) to fine-tune layout.
Integer display for Risk per Trade (USDT) and Max. Nominal Value (USDT); decimals configurable elsewhere.
Open source script — easy to read and extend.
How to Use
Add the indicator: open TradingView → Indicators → paste the source code → Add to chart.
Pick your low reference in settings:
Last N bars — uses the lowest low within your chosen lookback.
Running since load — tracks the lowest low since the script loaded.
Set your capital and risk:
Total Capital — your account size in USDT.
Max. invest Capital per Trade (%) — your risk per trade as a percent of Total Capital.
Tidy the table:
Use Table Position and Table Size to place it.
Add Extra rows/columns and set left/right fillers (spaces allowed) for padding.
Toggle individual rows (on/off) to show only what you need.
Read the numbers:
Act. Price in USDT — current close.
Last Low in USDT — stop reference price.
Risk per Trade — whole-USDT value of your risk budget for this trade.
Entry − Low — absolute risk per unit.
SL to Low (%) — percentage distance from price to low.
Max. Nominal Value in USDT — estimated max nominal position size given your risk budget and stop at the low.
Scope
This calculator is designed for long trades only (stop below price at the chart low).
Notes & Assumptions
Does not factor fees, funding, slippage, tick size, or broker/venue position limits.
“Running since load” updates as new lows appear; “Last N bars” uses only the selected lookback window.
If price equals the low (zero distance), sizing will be undefined (division by zero guarded as “—”).
Risk Warning
Trading involves substantial risk. Always double-check every value the calculator shows, confirm your stop distance, and verify position sizing with your broker/platform before entering any order. Never risk money you cannot afford to lose.
Open Source & Feedback
The source code is open. If you spot a bug or have an idea to improve the tool, feel free to share suggestions — I’m happy to iterate and make it better.
Crypto Position Size CalculatorPosition Size Calculator for Crypto.
This indicator uses the current price and a selected stop loss to calculate your position size without having to work it out elsewhere!
Simply set your account size, desired risk percentage and stop loss level and it will work out how many lots and the dollar value of your desired position.
Hope you enjoy!

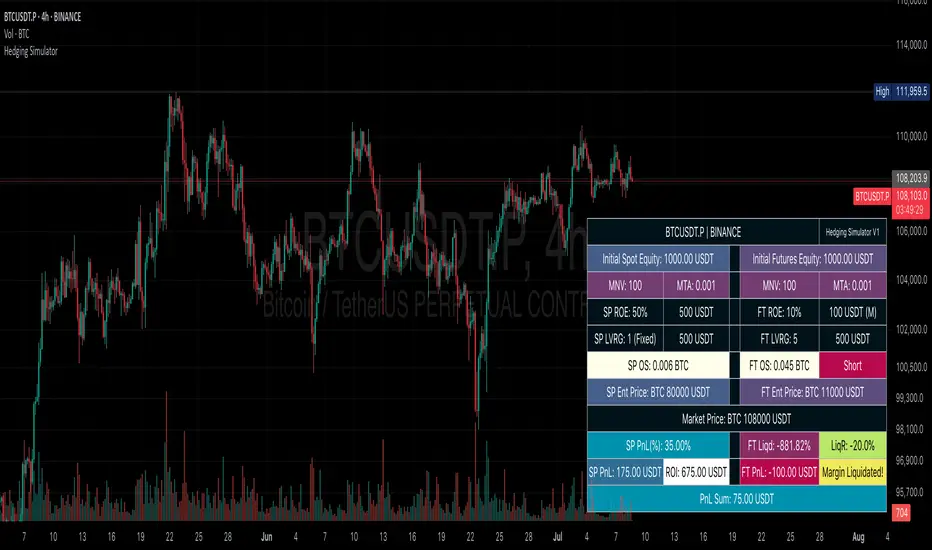
Hedging SimulatorHedging Simulator
The Hedging Simulator is a straightforward hedging tool designed to simulate potential profit and loss outcomes from combined Spot and Futures positions in the cryptocurrency market.
Users can define their equity allocation separately for both spot and futures, allowing for flexible and realistic scenario modelling.
The tool also incorporates MNV (Minimum Notional Value) and MTA (Minimum Trade Amount) parameters to estimate order sizes based on symbol-specific trading rules set by exchanges. While the results may differ slightly from actual exchange calculations, the simulator aims to provide a close approximation for general understanding.
📌Note: Crypto-Only - This tool is designed specifically for cryptocurrency trading and is not intended for use with traditional financial instruments.
Entry Price: Users can input custom entry prices for both spot and futures trades to simulate from specific market positions.
Live Price: The entry price fields for both spot and futures support Live Price based on the currently viewed symbol on your chart.
📌Note: In the real market, spot and futures prices are not always identical—there can be a price gap between them. While the difference is typically small, it's important to understand that the live price shown is only for rough estimation purposes and may not reflect the exact trading price on your chosen exchange.
Expecting Market Price: This represents the projected or target price to simulate potential profit and loss across the hedged position based on market movement.
📌Note: Profit and loss calculations exclude all trading fees. Actual results in live markets may vary due to fees, slippage, and exchange rules.
Feedback: If you notice any bugs, errors on calculation, or have suggestions for better calculations or new features, feel free to share your thoughts. Your feedback helps improve the tool and will be considered for future updates.
⚠️ Disclaimer: This simulator is intended for educational and illustrative purposes only. It does not constitute financial advice or guarantee trading results. Market conditions may vary, and all trading carries inherent risks. Users are solely responsible for any decisions made based on this tool and bear full responsibility for their own trading outcomes.
NQ Position Size CalculatorNQ Position Size Line Calculator is designed specifically for Nasdaq 100 futures (NQ) and micro futures (MNQ) traders who want to maintain disciplined risk management. This visual tool eliminates the guesswork from position sizing by displaying distance lines and contract calculations directly on your chart.
The indicator creates horizontal lines at 10-tick intervals from your stop loss level, showing you exactly how many contracts to trade at each distance to maintain your predetermined risk amount. Whether you're trading regular NQ contracts or micro MNQ contracts, this calculator ensures you never risk more than intended while providing instant visual feedback for optimal position sizing decisions.
How to Use the Indicator
Step 1: Configure Your Settings
Stop Loss Price: Enter your exact stop loss level (e.g., 20000.00)
Risk Amount ($): Set your maximum dollar risk per trade (e.g., $500)
Contract Type: Choose between:
NQ (Regular): $5 per tick - for larger accounts
MNQ (Micro): $0.50 per tick - for smaller accounts or conservative sizing
Display Options:
Max Lines: Number of distance lines to show (default: 30)
Show Labels: Toggle tick distance and contract count labels
Line Color: Customize the color of distance lines
Label Size: Choose tiny, small, or normal label sizes
Step 2: Read the Visual Display
Once configured, the indicator displays:
Stop Loss Line:
Thick yellow line marking your exact stop loss level
Yellow label showing the stop loss price
Distance Lines:
Dashed red lines at 10-tick intervals above and below your stop loss
Lines appear on both sides for long and short position planning
Labels (if enabled):
Green labels (right side): For long positions above your stop loss
Red labels (left side): For short positions below your stop loss
Format: "20T 5x" means 20 ticks distance, 5 contracts maximum
Step 3: Use the Information Tables
The indicator provides two helpful tables:
Position Size Table (top-right):
Shows common tick distances (10, 20, 40, 80, 160 ticks)
Displays risk per contract at each distance
Contract count for your specified risk amount
Total risk with rounded contract numbers
Settings Table (bottom-right):
Confirms your current risk amount
Shows selected contract type
Displays current settings for quick reference
Step 4: Apply to Your Trading
For Long Positions:
Look at the green labels on the right side of your chart
Find your desired entry level
Read the label to see: distance in ticks and maximum contracts
Example: "30T 8x" = 30 ticks from stop, buy 8 contracts maximum
For Short Positions:
Look at the red labels on the left side of your chart
Find your desired entry level
Read the label for tick distance and contract count
Example: "40T 6x" = 40 ticks from stop, sell 6 contracts maximum
Step 5: Trading Execution
Before Entering a Trade:
Identify your stop loss level and input it into the indicator
Choose your entry point by looking at the distance lines
Note the contract count from the corresponding label
Verify the risk amount matches your trading plan
Execute your trade with the calculated position size
Risk Management Features:
Contract rounding: All position sizes are rounded down (never up) to ensure you don't exceed your risk limit
Zero position filtering: Lines only show where position size is at least 1 contract
Dual-sided display: Plan both long and short opportunities simultaneously

Position Size CalculatorIt calculates the risk per trade using two methods: Margin-Based (percentage of total Account Balance) or Equity-Based (percentage of Total Balance minus minimum balance). Displayed as a compact, customizable label on the main chart, it’s perfect for traders seeking quick, precise risk calculations.
Key Features
Two Calculation Options:
Margin-Based: Risk as a percentage (0-5%) of your total account balance.
Equity-Based: Risk as a percentage (0-50%) of (Total balance - Minimum balance).
Flexible Risk Input: Manually enter any risk percentage with 0.01% precision (e.g., 1.75%).
Customizable Display:
Repositionable table (9 positions, e.g., top-right, middle-center).
Four table sizes (XL, L, M, S) with text scaling (large, normal, small, tiny).
Adjustable cell color, text color, and transparency
Margin-Based Risk Calculation:
Set “Total Margin” (e.g., $10,000).
Enter “Risk Percentage (%)” (0 to 5%, e.g., 1.75%).
Equity-Based Risk Calculation:
Set “Total Equity” (e.g., $15,000).
Set “Minimum Balance” (e.g., $5,000).
Enter “Equity Risk Percentage (%)” (0 to 50%, e.g., 1.75%).
Display Settings:
Choose “Calculation Method” (Margin-Based or Equity-Based).
Select “Table Position” (e.g., top_right).
Select “Table Size” (XL, L, M, S; default M).
Customize “Table Cell Color”, “Table Text Color”, and “Table Cell Transparency”.

Position Size CalculatorThis indicator is a Position Size Calculator designed for stock traders. It calculates the optimal number of shares, investment amount, and potential risk (in ₹) based on your account size, selected risk percentage (0.05% to 0.20%), entry price, stop loss, and brokerage charges. The output is neatly displayed in a table on the chart, helping you manage risk and position sizing efficiently while trading.

Position Size CalculatorPosition Size Calculator - User Guide
A simple tool to calculate optimal position size based on your risk preferences, visualize trade levels, and automatically determine trade direction.
Introduction
The Position Size Calculator is a TradingView indicator designed to help traders calculate the optimal position size for their trades based on account size and risk tolerance. This tool visually represents entry, stop loss, and take profit levels while automatically calculating the appropriate position size to maintain consistent risk management.
Getting Started
Setting Up Your Account Parameters
Setting Price Levels
Understanding the Visual Elements
Adjusting Your Trade on the Chart
Reading the Information Panel
1. Getting Started
After adding the indicator to your chart, you'll see three horizontal lines representing:
Yellow line: Entry price
Green line: Take profit price
Red line: Stop loss price
The indicator automatically detects whether you're planning a Long or Short trade based on the position of your take profit relative to your entry.
2. Setting Up Your Account Parameters
In the "Position Calculator" settings group:
Account Size : Enter your total account balance
Account Currency : Set your account currency (USD, EUR, etc.)
Risk (%) : Enter the percentage of your account you're willing to risk per trade (e.g., 2%)
Instrument Type : Select your trading instrument (Forex, Futures, Stocks, or Crypto)
Value per 0.01 lot per tick : Enter the value of 0.01 lots per tick (for most Forex pairs, this is $1 per pip for 0.01 lot)
Minimum Lot Size : Set the minimum lot size allowed by your broker (usually 0.01 for Forex)
3. Setting Price Levels
In the "Price Levels" section:
Entry Price : The price at which you plan to enter the trade
Stop Loss Price : Where you'll exit if the trade goes against you
Take Profit Price : Your target price where you'll take profits
If you set Entry Price to 0, it will default to the current price. If Stop Loss or Take Profit are set to 0, they'll default to 5% below or above entry price respectively.
4. Understanding the Visual Elements
Yellow line : Your entry price
Green line : Your take profit level
Red line : Your stop loss level
Green zone : The profit zone (between entry and take profit)
Red zone : The loss zone (between entry and stop loss)
Information panel : Shows all calculations and trade details
5. Adjusting Your Trade on the Chart
The beauty of this tool is its interactivity:
You can drag any of the lines directly on the chart to adjust entry, stop loss, or take profit
If you drag the take profit above the entry , the indicator automatically sets up for a Long trade
If you drag the take profit below the entry , it automatically configures for a Short trade
All calculations and visuals update in real-time as you adjust the lines
This means you can quickly test different scenarios and see how they affect your position size and potential profit/loss.
6. Reading the Information Panel
The information panel displays:
Account details : Your account size and currency
Risk information : Your percentage risk and the equivalent monetary amount
Position Size : The optimal lot size calculated based on your risk parameters
Price levels : Entry, Stop Loss, and Take Profit with distances in ticks
Risk/Reward ratio : Shown as 1:X (where X is the reward relative to 1 unit of risk)
Potential outcomes : The exact amount you stand to gain or lose on this trade
Trade direction : Whether this is a Long or Short trade
Visual Settings
You can customize the appearance in the "Visual" settings group:
Adjust colors for profit and loss zones
Change the transparency of colored zones
Toggle the filling of spaces between lines
Adjust how far the lines extend beyond the last candle
Practical Tips
Always double-check your "Value per 0.01 lot per tick" setting for the specific instrument you're trading
For Forex major pairs, the standard is usually $1 per pip for 0.01 lots
For other instruments, consult your broker's specifications
The indicator works best when you place your stop loss at a logical market level (support/resistance, swing high/low) rather than a fixed percentage
Final Thoughts
This Position Size Calculator helps remove emotion from your trading by objectively calculating your position size based on your predefined risk parameters. It ensures that you maintain consistent risk across all your trades, regardless of the stop loss distance, which is a key component of successful risk management.
Remember: The most important goal in trading is capital preservation. This tool helps you ensure that each trade risks only what you've decided is acceptable for your trading strategy.