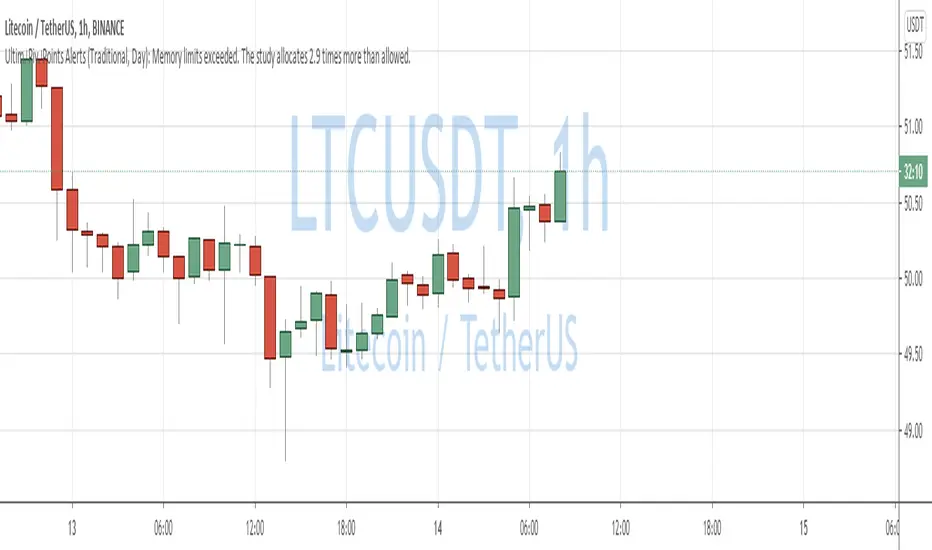
QuantNomad - Ultimate Pivot Points AlertsCreated a universal script for pivot points alerts.
In the script, you can choose one of 4 pivot point types: Traditional, Fibonacci, Woodie, and Camarilla.
You are able to create separate alerts for every level or create one for price crossing any level.
For separate levels, you can choose: "Cross", "Crossover" and "Crossunder".
You can also choose to show/hide:
Historical Levels
Levels Values
Current Levels - Levels calculated on the current period, on close of the period they will become valid levels for next periods. These levels do not participate in alerts calculations.
Because of some TradingView limitations, alerts won't be fired for the first bar of the session.
In the script used new v4 plotting features, so will be able to plot levels and labels nicely. Unfortunately, there is a limit on the number of consecutive lines you can plot on the plot (around 50), so historical lines in the past will disappear after 6-7 periods.
And remember:
Past performance does not guarantee future results.
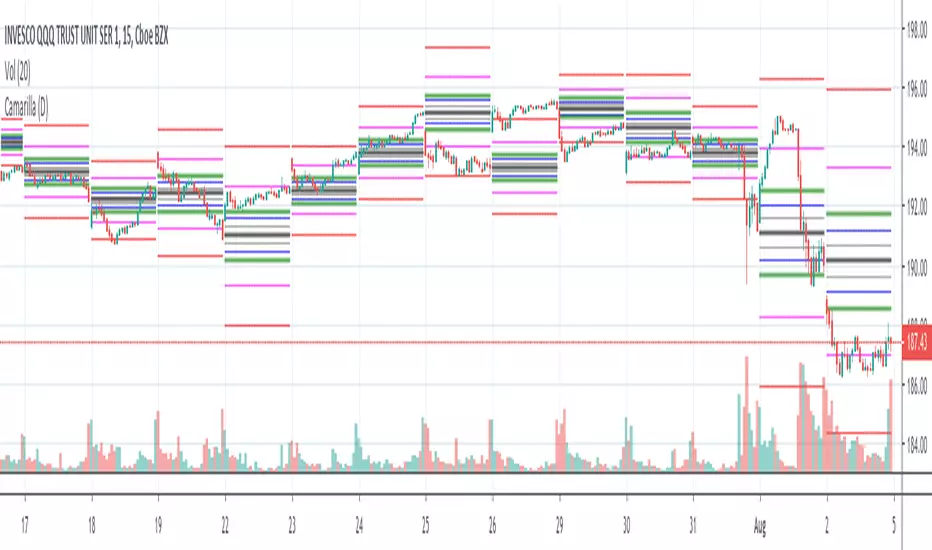
Camarilla Pivot Points
Camarilla Pivots (D,W,M) Secrets of a Pivot BossPrimarily for equities as no provision has been made to control the timing at which the open close high low are determined, indeed, I see no straightforward mechanism to do so in Pinescript.
Development aided by: but with the entirely different calculations presented in "Secrets of a Pivot Boss" by Franklin Ochoa. And far cleaner and less-redundant code.
To trade the indicator, watch the H3,H4,H5 and L3,L4,L5 bars. There are two built-in strategies. Depending on pivot width, sell at H3 and buy at L3 with stop at H4/L4 or above. For strongly trending environments: buy at H4, cover at H5--similarly for downtrends.


Combined MTF Camarilla Pivots (HA + Candles)This is a fairly basic (but hopefully useful) indicator that combines three time-frames of Camarilla pivots into one.
Default time-frames are:
Weekly
Monthly
Yearly
Time-frames can be modified as you wish, they are just set to these as I generally only trade higher intervals (just note that formatting labels will not change - but you can update these as needed).
The Camarilla pivots displayed are as follows:
R3, R4, R5, R6
Pivot line (Middle/Base)
S3, S4, S5, S6
R1/S1 & R2/S2 are excluded to make way for R5/S5 & R6/S6 - as these are more useful for the majority of traders. The formula for levels 5/6 are always up for debate, as no official formula has ever been released. I've used what I consider a mid, or consensus calculation.
By default all historical pivot levels are displayed, as there can be some benefit to mapping these forward once the relevant period has ended. If people find it's too cluttered I'll look into having an option to display the current period only.
Unfortunately, TradingView doesn't allow labels on plots (seems like such a basic feature to be missing, but there you go), so you'll have to learn the colours/linewidths.
Oh, and there's a checkbox to enable pivots to be calculated on Heiken-Ashi prices/candles rather than default prices/candles. This heavily modifies the location of the Camarilla Pivots, but I've found that in certain situations you can get some great results.
Let me know your thoughts/comments/suggestions.
Cheers
DD

Hybrid Pivot Zones [DW]This is an experimental study designed to identify potential areas of support and resistance using a hybrid between Camarilla and Fibonacci pivot calculations.
The levels are calculated by taking 110% of the previous interval's range multiplied by 8.33%, 16.67%, 25%, 50%, 61.8%, 78.6%, 100%, 127.2%, 141.4%, and 161.8%, then adding them above and below the interval open.
Custom bar colors are included.

CamarillaStrategy -V1 - H4 and L4 breakout - exits addedExits added using trailing stops.
2.6 Profit Factor and 76% Profitable on SPY , 5M - I think it's a pretty good number for an automated strategy that uses Pivots. I don't think it's possible to add volume and day open price in relation to pivot levels -- that's what I do manually ..
Still trying to add EMA for exits.. it will increase profitability. You can play in pinescript with trailing stops entries..

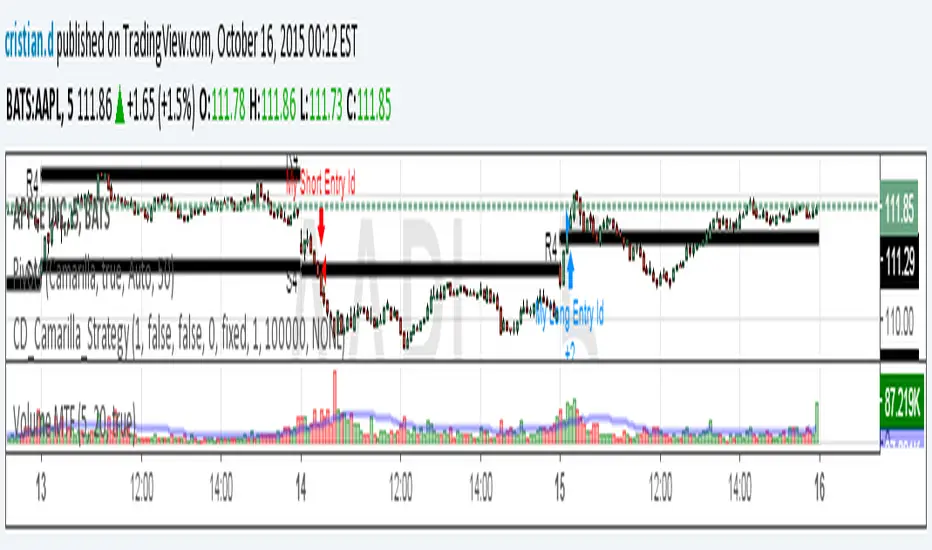
Camarilla Strategy - breakouts of H4 and L4Breakout strategy of H4 and L4 levels. Manual entries and exits - higher profits BUT because I am a novice in pinescript,
Can someone please:
1. Show me how to add exit strategy lines : close> ema(close,3) for exit short and opposite for long. I added myself but I can't make it to work in relation to camarilla entries; instead it shows all ema crossings..
2.Why some entries over/above my pivots are not shown.. Example:11.15 AM (short) and 13.10 PM (long) AAPL, October 15, today? Today would've been 3 signals, not one..
Thank you in advance for any advice. I am a strong Camarilla follower, but I am not a coder.