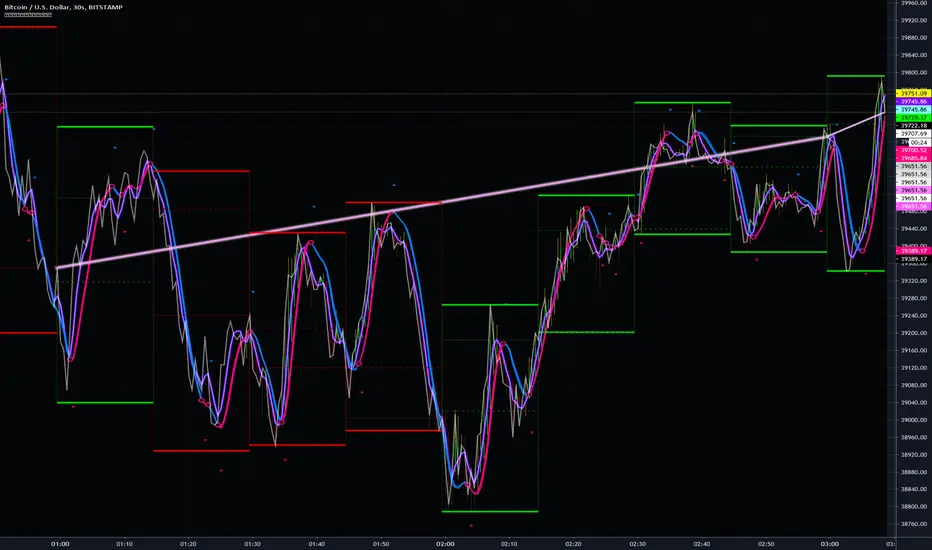
Pumpenomics Price-action Levels (OHL M)Simple price-action levels in regards to the OHL and M levels.
Levels available:
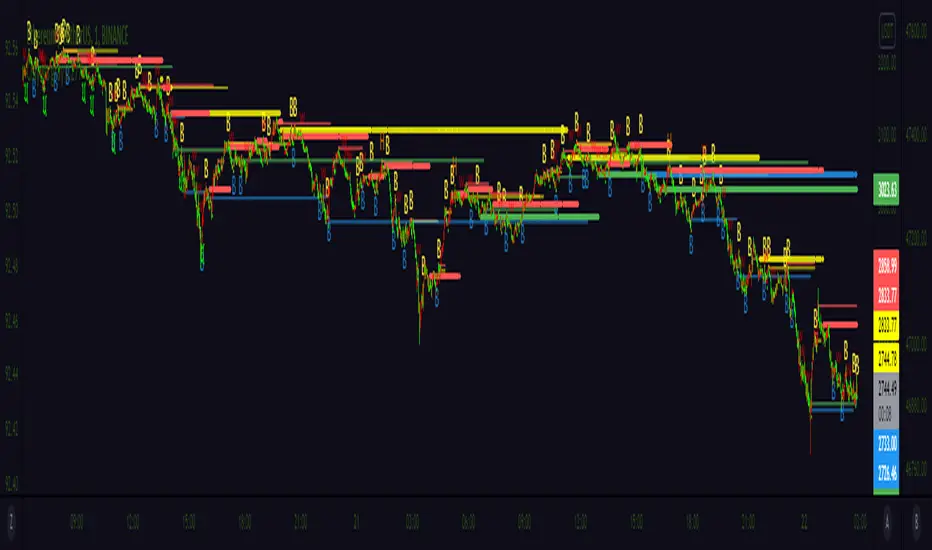
Open (Orange)
High (Green)
Low (Red)
Middle [ /2] (Aqua)
Timeframes available:
1H, 4H, Daily, Weekly, Monthly, Quarterly, Yearly
Enjoy!
-
Inspired by Long Term Levels (4h, D, W, M, Q, & Y) by scarf
Penunjuk Pine Script®