FX Mini-Day/Index Dividers V2This is a combination of the Mini-Day Separator Indicator, timings based off the research by Tom Henstridge/@LiquiditySniper and additional Index KZ delineations, based on ICT's 2022 Youtube Mentorship.
*It borrows some minor code from Enricoamato997 . Credit where it is due!
This is a joint effort by myself, @vbwilkes / Offseason Vince and @Tom_FOREX / TraderTom on the Index/Index Future portion.
Index Future Example
Forex Example
Analisis Candlestick

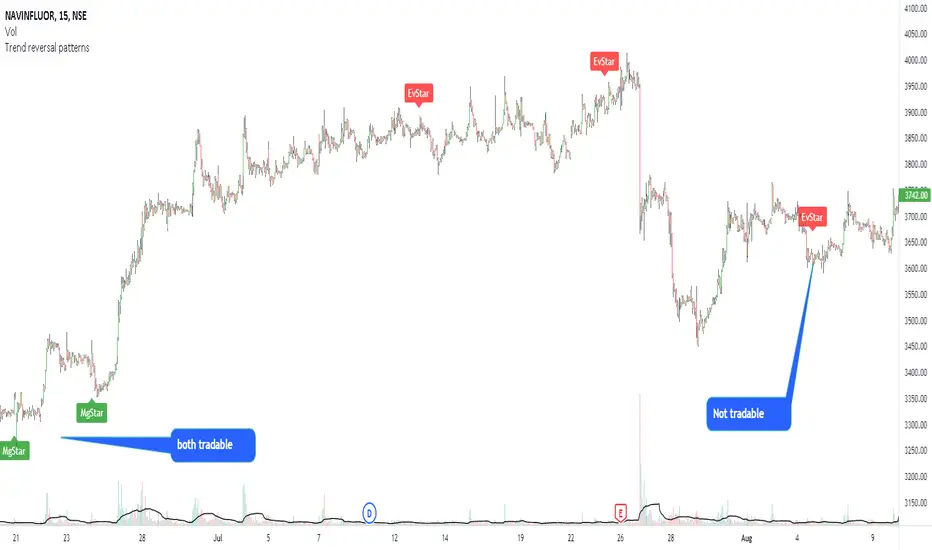
Modified morning and evening starsThis script highlights modified version of evening and morning star candlestick patterns. Volume has also been added in the script to create convergence of volume with price action.
It is recommended to use these patterns for positional trading. It is advised to use
Morning star at the bottom of the downtrend
Evening star at the top of the uptrend
Avoid entries against above recommendations
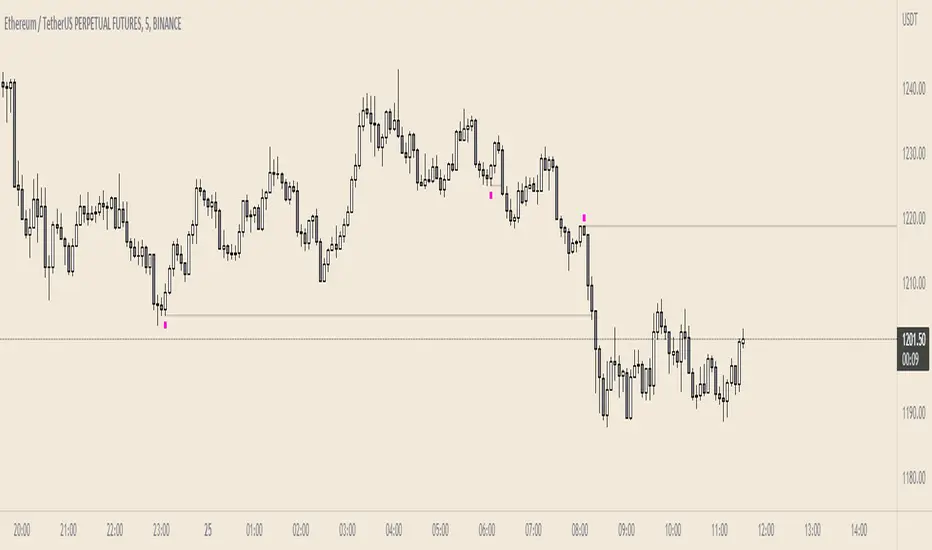
Failed AuctionAs we know, buyers and sellers take part in the market auction.
A failed auction is where price could not tick above or below a specific price. This means that there were no buyers willing to buy or sellers willing to sell beyond that price. Price then moves away in the other direction.
The failed auction acts as a magnet and becomes a target to revisit sooner or later. The failed auction is a successful/finished auction once it has been satisfied.
On the indicator, two adjacent candles with the exact same high or low are marked. The icon will appear on the high or low of the 2nd candle. This notifies us that there was a failed auction.
If you are in a trade, you can use the failed auction to hold onto the trade longer. If you are not in a trade, you should be cautious if a failed auction rests above or below you limit order.
Icons and colours are customisable. An option to have plotted lines for the failed auction is included.
Works on all timeframes.
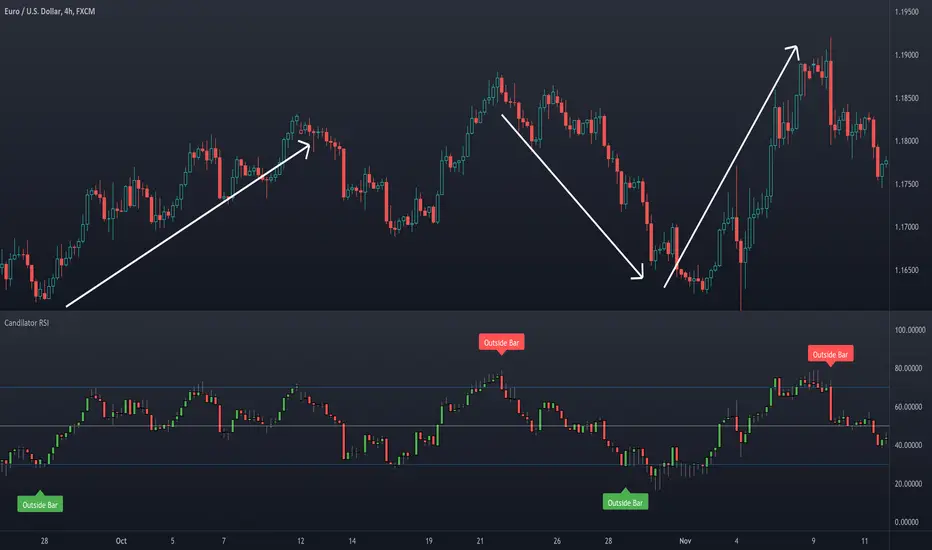
Candilator RSI [AstrideUnicorn]OVERVIEW
The name Candilator comes from blending the words "candlestick" and "oscillator". And as the name suggests, this indicator is a good old RSI plotted as a candlestick chart. To produce a candlestick chart, Candilator RSI calculates four RSI's based on the open, high, low, and close time series. It also has a candlestick patterns detection feature.
HOW TO USE
You can use Candilator RSI as a normal RSI to analyze momentum, detect overbought and oversold markets, and find the oscillator's divergences with the price. You can also get creative and apply all sorts of technical analysis to the RSI candlestick chart, including candlestick patterns analysis.
Candilator RSI can automatically scan the price for some candlestick patterns in the overbought and oversold zones. This feature can help detect price reversals early.
SETTINGS
The indicator settings are divided into two groups: Main Settings and Pattern Detection. In the Main Settings, you can find standard RSI settings. In the Pattern Detection part, you can turn on and off the automatic search for a particular candlestick pattern.
Chop Zone - SamXThis is my spin on the Chop Zone indicator. It was forked from the built-in TradingView Chop Zone indicator. There were several reasons for this effort...
The built-in indicator version had no real configuration options
It was hard-coded to use the 34-period EMA with fixed span sizes for identifying price range
There was no real context to the meaning of default color scheme
The separation points of the chop zone bars was at a fixed 1.43-degree scale
Note: If left at default settings, this indicator will exactly match the built-in Chop Zone indicator.
WARNING : Please be sure you understand the potential impact and implications before adjusting any of the settings in the "Advanced Configuration" section!!!
Chop Zone with discrete/standard coloring:
Chop Zone with gradient fill:
Moving Average angle plot with gradient fill:

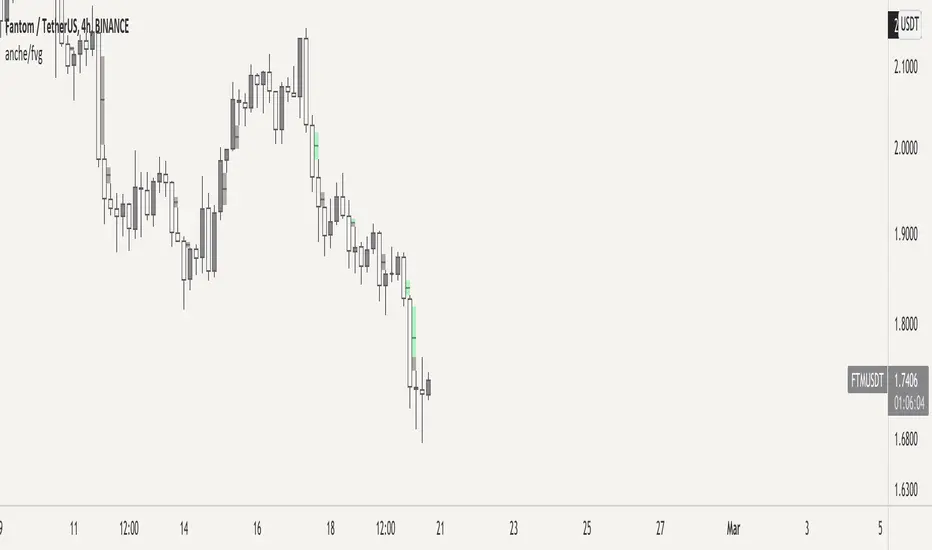
Fair Value Gap by AncheIndicator that plots boxes for fair value gaps (also known as imbalances or inefficiencies)
fair value gaps are a very useful concept in price action trading, as they provide a trader with information about where a lot of orders were injected creating this inefficiency in the market. This inefficiency can become a magnet for price in the future to resolve this inefficiency as there are many resting orders. A trader can use this information to target a fair value gap, or to look for a potential entry for a long/short making it a good POI.
you have the possible to extend boxes to the right of the screen or to edit their width
fair value gaps tend to get mitigated, to restore the balance. This indicator gives you the option to define a mitigation using a full fill or a 0.5 fill. You can also define what to use for mitigation: candle bodies or candle wicks.
there are some other indicators for fair value gaps, although I haven't found one that let's me define a 0.5 mitigation, this indicator suits my trading style
Pattern Recognition Pullback Strategy profit calculatorThis script has been designed for use in botting Crypto spot / futures.
The intended use is send signals to a 3commas bot setup for the exchange. The bot uses candle measuring percentile nearest rank filters and range
breakouts to decide if the market is trending. When the market is trending it will look for pullbacks below a moving average and buy in the trend direction on a pullback discount. This is the profit calculator part of the script
With this script you will not be able to send tradingview signals, that is because it is a payed premium service and for security reasons I am the only one with access to making signals from this script.
I provided a user manual:
drive.google.com

Pattern Recognition Pullback StrategyThis script has been designed for use in botting Crypto spot / futures.
The intended use is send signals to a 3commas bot setup for the exchange. The bot uses candle measuring percentile nearest rank filters and range
breakouts to decide if the market is trending. When the market is trending it will look for pullbacks below a moving average and buy in the trend direction on a pullback discount.
With this script you will not be able to send tradingview signals, that is because it is a payed service and for security reasons I am the only one with access to making signals from this script. I will be uploading a second script which is the profit calculator. This way you can toy around to find your preferred settings for the bot and see the results it could have made.
I provided a user manual:
drive.google.com

[TT$] Trade Tracker - By BlueJayBirdUSE:
- For visually tracking your trades in a floating pane (label).
- Most of the features are described in the image.
MAIN FEATURES:
- Better long-position and short-position tool wannabe.
- Visual data for tracking your trade position.
- Automatic setting of some common values in trades risk management.
- Switching from long-position to short-position can be done by just dragging the target or the entry point around.
EMOJIS:
- ⏰ Entry time: : Confirmed manually when the tool is added to the chart.
- 🎲 Entry: Confirmed manually when the tool is added to the chart.
- 🎯 Target: Confirmed manually when the tool is added to the chart.
- ⛔ Stop-Loss: Set automatically by the code.
- 🪓 Break Even: Set automatically by the code.
- 👻 Else: Set manually from the settings.
- 💲 Current: Automatic.
NOTES:
- Be aware of the "time zone" feature. Change it to the time you're currently using for your trades.
- QUOTE use is really optional. I'd rather not use it.
- The 👻 is just an extra feature. Do whatever you want with it (example: for pointing out a dangerous zone).
- 💱: "Fee" feature is not working, but it will. Sorry for that.

Naked Bar Upward ReversalAMEX:SPY
The Naked Bar Upward Reversal is a three bar candlestick pattern with an inside candle as a entry point. This pattern is bullish since it has a candle closing red from the previous candle; the most bearish pattern possible. The following inside candle is a reversal of its previous candle with an open above the previous candle's close. Look to buy the next open above the inside candle's close.
This is a bullish reversal pattern and should be used in this context. Successful entries are found in corrections along an upward trend, or buying into a dip. Performance drops when the pattern appears at tops. To improve profitability, use a cluster of evidence to enhance the performance of this pattern. The intended time frame is within the daily and weekly.

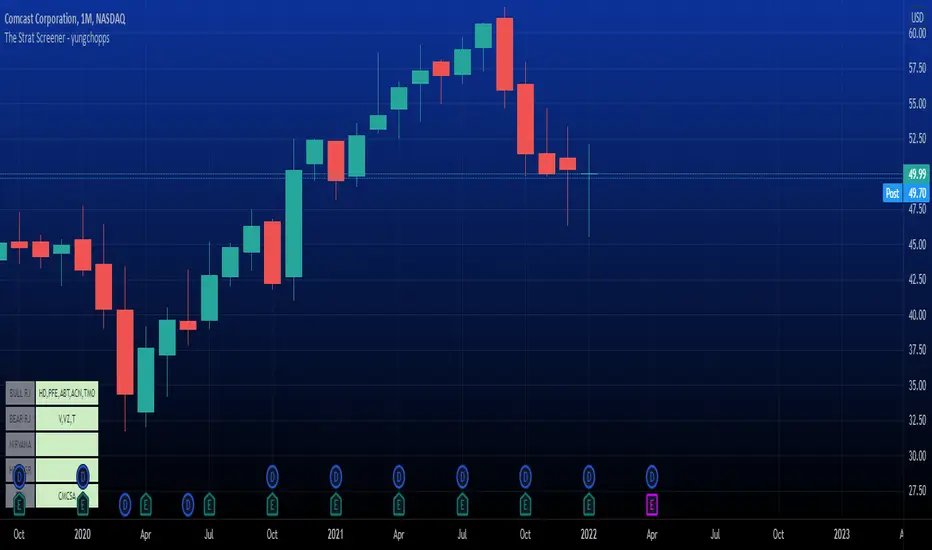
The Strat Screener - yungchoppsThis indicator scan up to 40 tickers of your choice for bullish and bearish Randy Jackson setups. Randy Jackson setups are 2u-2u-2d-2u for bullish cases and 2d-2d-2u-2d for bearish cases. If a ticker has a possible RJ setup, the ticker name will be display on the table depending if it is bullish or bearish. The only thing you need to do it change one of the default tickers to the ones you desire and the table will update if there are any RJ setups. The indicators search for RJ setups on the current timeframe that you are on.
Randy Jackson setups are part of the 'Strat' candlestick analysist. More information about the Strat can be found on the internet and YouTube. This indicator reads the previous candles of every selected ticker and searched for a RJ setup. If one exist, it will update the table with the tickers name. I will add more setups in the future.
This is a screener. This indicator really just makes it easier to scan many indicators at once. Its not hard to use... just place it on the chart and it will do the work for you. Hopefully mods find this enough of a description...
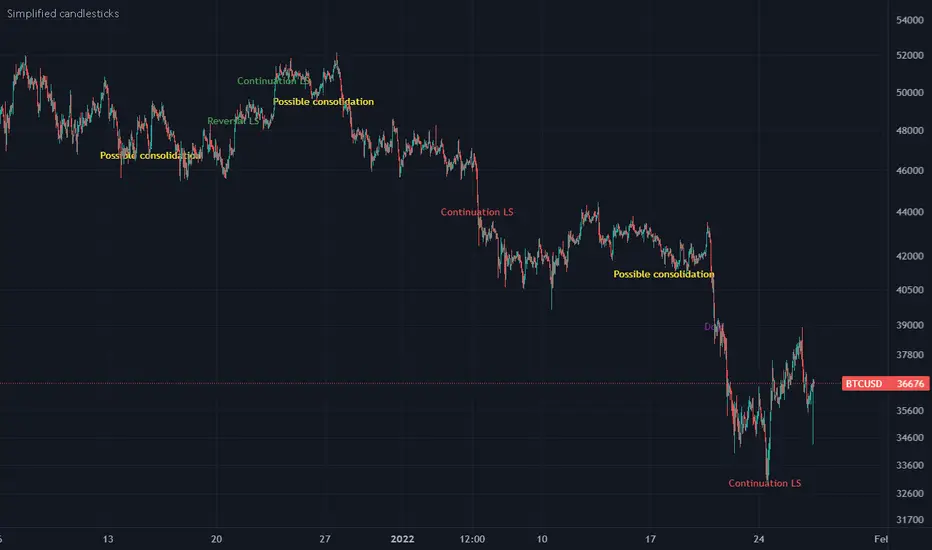
Simplified candlesticksSimplified candlesticks tracks sticks for their body and wick
- For Long bars sticks ( LS ) tracks and marks them on down trend as continuation and reversal if moves appositive direction.
- For largest wicks on ends marks as regular Doji
- For large wicks and medium body marks as possible consolidation
- For only bottom bigger wick as bears weakness if trend down and possible reversal if trend is up.
- For only upper bigger wick as bulls weakness if trend up and possible reversal if trend is down
DOJI FU IndicatorIndicator is designed to paint a doji, the size of which can be adjusted in settings.
Provided there is a valid doji, the following candle is a 'FU candle' or an 'Institution' candle. This candle wicks above/below the doji and takes liquidity from above or below.
Colours can be changed
Red = Doji candle
Yellow = FU candle
Example shown on the 1hr chart, red doji indicating a change of trend upwards, the FU candle (yellow) takes liquidity from above and sweeps down.

WR-GAP DetectorIndicator that plot if price gap detected.
Gap Up detected when open current candle more than close previous candle.
Gap Down detected when open current candle less than close previous candle.
Consolidation Zone Hunter NPR BasedThis script will search for zones where the range between the high and low is lower than avg % nearest rank of last X bars.
After X(=30) bars of consolidating range it will signal that the market is in a range and draw the top, bottom and middle of that range.
When price breaks the consolidating range the range is cleared, this is where you long/short the breakout. After this it will look for the next range and do the same.
Visual Explanation

Trade Manager Pro - Quick Position Sizing This script allows the user to select directly on the chart the entry time/candle for a trade, its entry price, stop loss price and take profit price, and will quickly calculate the position size for the trade.
Some of the parameters that can be established by the trader in the indicator settings include the following:
-Account Size
-Leverage Multiple
-Risk % per trade
-% Trading Fee
A table with the outputs will be shown to the right of the chart, showing the following information:
-Margin used for the trade
-Leverage
-Total position size (Margin*Leverage)
-Position Type (Long or Short)
-Trading Fee $
-Stop Loss %
-Stop Loss $
-Take Profit %
-Take Profit $
-Risk/Reward Ratio
Note on its usage: When changing timeframes or tickers its better to exit the indicator and add it again to the chart, since TV doesnt reset its input functions when changing these.
Happy trading!!

[DisDev] 12 Candle|Round#|Future SessionsThis indicator has many components; below, each component is explained and how it can be used as a trading tool.
1) Future Lines
a. Vertical lines are projected into the future to mark the beginning of each of the three major markets, Tokyo, London, and New York.
b. When major markets open, this can cause an increase in price action. So this component provides the trader with a reminder of when the next major market opens.
c. Also, the days of the week are displayed to allow the user to backtest price reaction for certain days of the week easily (e.g., Major Markets reopening after the weekend).
2) 12 Hour Candle Sessions High and Low
a. As price intersects with the beginning of the session, the vertical line disappears, and two corresponding horizontal lines begin. These horizontal lines dynamically adjust to mark each session's high and low, and a semi-transparent box fills the space between the high and low lines.
b. The duration of each session is a three-hour window, which each consists of 12 Fifteen-Minute Candles. This marks the hour prior to equity markets open, the opening hour, and the post-open hour.
c. The sessions highs and lows can be selected within the settings show for a 24 hour period. This assists the trader with session range breakouts; three examples of how this could be traded are below.
Example 1
d. The Tokyo and London session high kept the price action within a range. Once it broke the range, the Tokyo and London session highs were used as support, resulting in a range breakout.
Example 2
e. The below picture shows price action failing to break London Session Low and New York Session High; this is followed by Tokyo Low acting as resistance and price moving down 9%.
Example 3
f. Below price action with an increased volume of 323% (based on the average of the last 10 bar) fails to break the Tokyo High on the 1st attempt. The second attempt fails on 241% volume. The third attempt at 475% breaks the range, completing the range breakout seeing a move of 3.4% in price.
4) High of Day (HOD) and Low of Day (LOD)
a. As the trading day unfolds, we mark the HOD (d-High) and LOD (d-Low) with blue dotted horizontal lines. Then at the start of the next trading day, the former High and Low become the Previous Day High (pd-High) and Low (pd-Low) and are changed to dashes.
b. These high and low levels add extra confluence with the session high and lows for Swing Failure Patterns (SFP) and confirmation of trends.
5) Round Numbers
a. As humans, it's hard to use just any number to make sense of things. We prefer to use round numbers. This is important for trading as many traders will automatically use round numbers as their stop losses.
b. This indicator component reminds users of this fact and displays round numbers such as 00, 25, 50, and 75. The indicator automatically calculates and displays lines for the round numbers for as many as twelve levels above and below the current price.
c. Below are examples of how round numbers are broken to trigger stop losses; you may want to break the habit of using round numbers as your stop losses.
Below is the indicator in full swing, displaying all the elements described above.

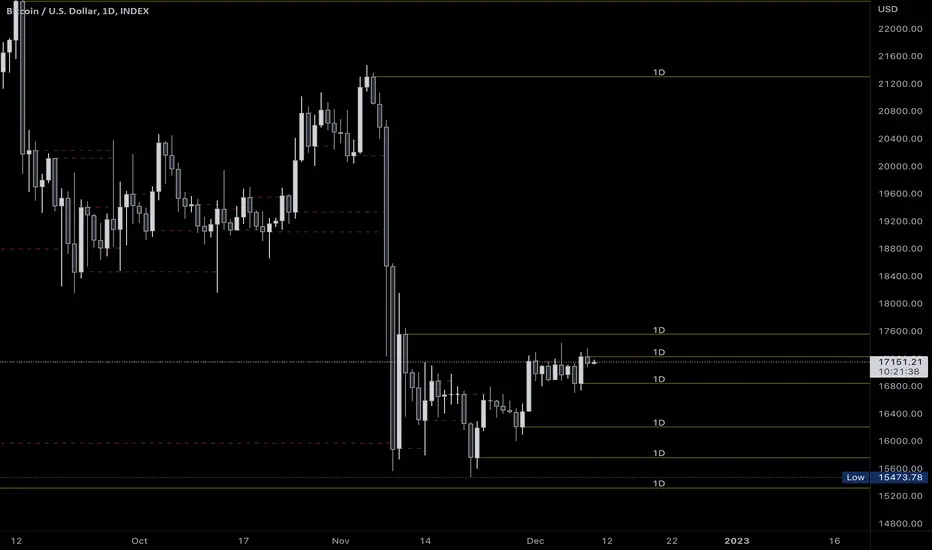
[BFR] Naked LevelsDetects significant naked levels(Levels that have not been touched since the candle closed) and draws them on chart. These provide excellent profit targets and often reversal levels.
Roadmap:
✅ Candle open
☑ Point of control
☑ Multiple timeframes
☑ Something else? Leave a comment.
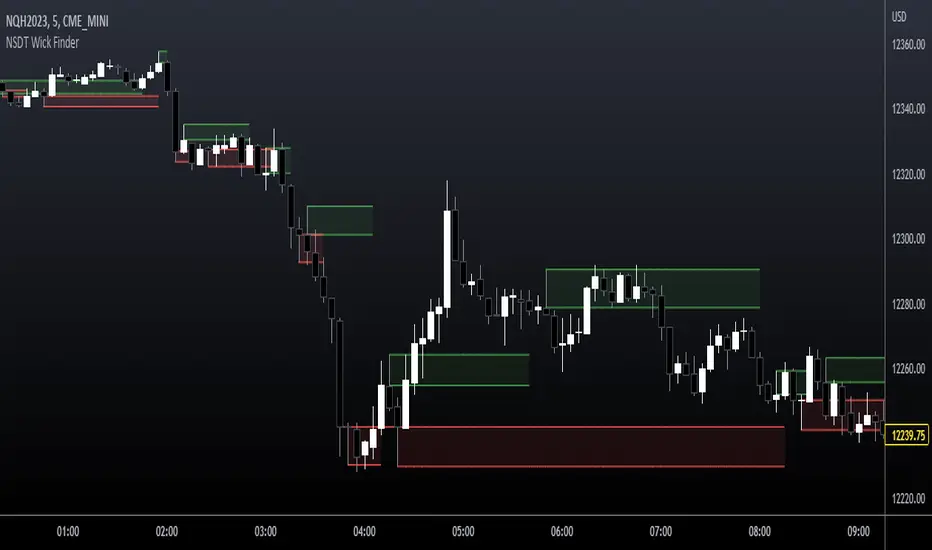
NSDT Wick FinderThis script finds wicks that are longer than the candle body and marks them as potential trading zones to be revisited. Lines, shading, and lookback can all be modified.
Full credit for original code goes to @Squam_Gobaloochee. We updated to Pinescript V5 and cleaned up code. We reached out to original for permission to repost publicly and open source.
J-BUY & SELLIntroduction
I have been tracking the technical indicator for a long time. In my experience, I have tried various combinations of the existing indicators in the chart but have not been able to get satisfactory results.
The trend analysis method needs a lot of focus and time. Therefore, rather than speculating the future trend, I focused on building a code which will be continuous in terms of indications and remove the speculation out of the strategy. Hence, allow for automation.
Indicator Strategy
This is a simple, yet powerful indicator primarily based on price action and its relationship with SMAs .
Each candle is compared with the moving averages and the output is shown as a buy and sell signal through Up & Down arrows. Up arrow is a buy indicator and Down arrow is a sell indicator.
However, you might see in some case there is no Buy or Sell signals indication on the candle. No worries, please follow the previous signal in these cases.
How to add the indicator into your chart
1. Click the “Indicators” tab in the Trading view chart Tool Bar.
2. In the “Indicator & Strategies” menu, click on Public Library option.
3. Search for the “J-BUY & SELL” in the search box.
4. Add the indicator by clicking on the result.
How to add Buy & Sell alert
In addition to the indicator, you can also set BUY & SELL alerts for any of the stock/ index/ commodities etc.
1. Hover your mouse cursor over the indicator on the chart.
2. Click on the three dots captioned as “More”
3. Choose the option “Add alert on J-BUY & SELL”
4. You can choose the alert “Buy Bar/ Sell Bar or both as per your requirement by pressing the “Create” button.
Change the Color of the Up & Down arrows
For changing the color of the arrows, please “double click” on the arrow and the color as per your choice.

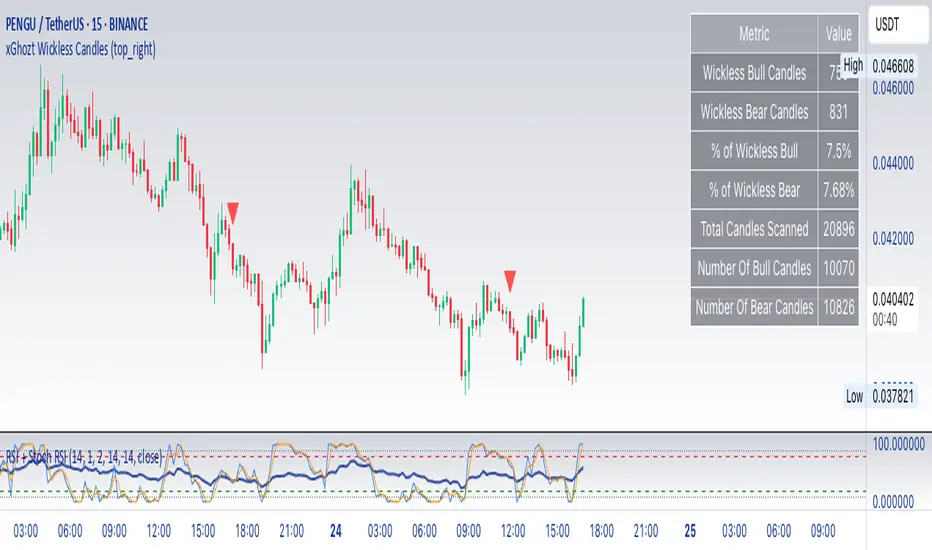
xGhozt Wickless CandlesSimple script showing candles missing an upper or downer wick. As candles tend to have a low and a high, they will most certainly form wicks. It is rare to have wickless candles on longer time frames, so it's more relevant on 1h and above.
What can you do about it?
If you see for example a Bitcoin 4h candle that hasn't form two wicks yet, there are high chances that the missing wick will be formed at one point or another, therefore you could take a trade in the direction of the missing wick. You can set alerts on wickless candles if needed.
The Strat Numbers & CombosThis indicator is an all-in-one " The Strat " script. This script displays the following:
The Strat candle numbers (1's, 2's, & 3's)
The Strat Combo labels along with trigger line
Pivot Machine Gun ( PMG ) dynamic labels
Hammer & Shooter candle labels
The Strat Candle Numbers label each candle, on any timeframe, either a 1, 2, or 3. 1's are inside bars of the previous candles. 2's take out only one side of the previous candle. And 3's go outside both sides of the previous candle.
The Strat Combo labels (which are made of the 1's, 2's, 3's outlined above) display labels when a Strat Combo occurs. The script displays a label, direction arrow, and trigger line for each Strat Combo. This indicator finds the following Strat Combos:
2-1-2 bullish reversal (BLR)
2-1-2 bullish continuation (BLC)
3-1-2 BLR
3-2-2 BLR
1-2-2 rev strat BLR
2-2 BLR
2-1-2 bearish reversal (BRR)
2-1-2 bearish continuation (BRC)
3-1-2 BRR
3-2-2 BRR
1-2-2 rev strat BRR
2-2 BRR
Double inside candles
The Pivot Machine Gun (PMG) labels any 5 or more consecutive candles that make higher lows or 5 or more consecutive candles that make lower highs. A PMG can continue going in its direction or it can reverse and come back through the range. The logic in this indicator dynamically finds each level in a PMG and draws a line for easy identification.
The script also identifies if the candle type is a Hammer, Inverted Hammer, Shooting Star, or Hanging Man. These candle types are highly likely reversal points in price action.The indicator will plot a shape with a color coded icon identifying the candle. The distance between the shape and the candles can be manually adjusted in the inputs section.
This indicator has many style options . The user can independently toggle on/off the Strat numbers, boxes around the Strat Combos, and Hammer and Shooter shapes. Also all of the colors used in this script can be changed from the inputs section, so a user can easily change colors to match their current color scheme.

RSI true swingsRelative Strength Index (RSI) is being used by majority of the traders to get benefitted based on the swings. But these swings are hard to Identify.
This Indicator uses 4 major factors for finding the potential reversal points:
RSI Crossover or crossunder
Relative volume
Overall volume against the moving average volume
Relative closing of the candles
Size of the bars
Please read Instructions carefully before using this indicator
Recommended entry is the OHLC4 of the signal bars.
If signal bar is too large, try to enter in the retracement when another signal comes either through indicator or through types of bars
when signals comes opposite to the trend, then try to wait for the next signal of same type. This creates a RSI-price divergence in confirmation by volume price action
Timeframe can be of your choice
Recommended stoploss should be swing highs or lows
