PLANBXPRESS PSYCHOLOGICAL LEVEL ENTRY MODELThis Indicator merges multiple professional trading concepts into one visual tool — helping traders identify momentum shifts, entry zones, and daily trading plans with volume confirmation.
It automatically detects trend direction, generates dynamic take-profit & stop-loss levels, and overlays key daily reference points such as VWAP, pivot, support, and resistance zones based on ATR and trend context.
⚙️ Main Components
1️⃣ Signal System
Detects trend bias using SMA-based logic.
Generates entry price, TP1–TP3, and SL dynamically from recent impulse ranges.
Updates signals automatically when trend bias changes or previous targets are hit.
Visual levels are drawn directly on the chart.
2️⃣ Volume Analysis
Compares current volume against a moving average (SMA).
Classifies volume as:
🟢 Strong (above 1.5× average)
🟡 Average
🔴 Weak (below 0.8× average)
Displays the current volume strength and trend bias in an on-chart table.
3️⃣ Auto Day Plan
Uses multi-timeframe ATR calculations to define:
Support / Resistance zones
Pivot & Balance areas
Daily VWAP
Auto Targets (ATR-based expansion levels)
Adapts automatically to selected base timeframe (1H, 4H, or Daily).
4️⃣ Trend Context
Dual EMA system (50 & 200) to confirm bullish/bearish structure.
Aligns expected direction with VWAP & pivot location for context-aware bias.
🎯 What You Get on Chart
📈 Automatic LONG/SHORT signals
🎯 TP1, TP2, TP3, and SL levels
📊 Volume strength meter
🧭 VWAP, pivot, support/resistance & balance zones
🎨 Clean visual layout for intraday and swing traders
🧩 Inputs
Parameter Description
lenImpulse Impulse range length
smaLen SMA length for trend bias
levelRatio SL/TP ratio multiplier
volLen Volume SMA length
baseTF Base timeframe for zones/VWAP
atrMult1 / atrMult2 ATR multipliers for target levels
fwdBars Extension range for future projection
💡 How to Use
Add the script to your chart and choose your preferred timeframe.
Observe signal direction (📈 LONG / 📉 SHORT) and TP/SL levels.
Confirm entries when:
Trend aligns with VWAP direction, and
Volume category shows Strong or Average.
Use Auto Day Plan levels (pivot, balance, VWAP) as intraday reaction zones.
Candlestick analysis

Sessions High & Low LevelsAutomatically plots high & low levels for multiple sessions. Clear session structure for intraday traders using price action, liquidity concepts, or session-based strategies.
Automatically plots the High & Low, for sessions such as London, New York, and Asia, with full customization for any custom session or timezone. These levels extend forward and adapt in real time, giving you a clear view of session-based structure and liquidity behavior.
Perfect for traders using ICT concepts, session narratives, or intraday market structure. Session ranges often act as key liquidity pools, breakout zones, and directional guides, this tool makes them easy to see at a glance.
Features:
Auto-plots High & Low for NY, London, and Asia sessions (customizable)
Fully customizable session times, colors, labels, and visibility options
Works across any assets

Previous Day OHLC with Fib LevelThe Previous Day OHLC indicator is designed to help traders identify key price levels from the previous trading session. These levels often act as important zones of support, resistance, and market reaction points during the current day’s price action.
This indicator automatically plots the Previous Day’s Open, High, Low, and Close on any intraday timeframe, making it a powerful tool for day traders, scalpers, and swing traders who rely on market structure and session behavior.

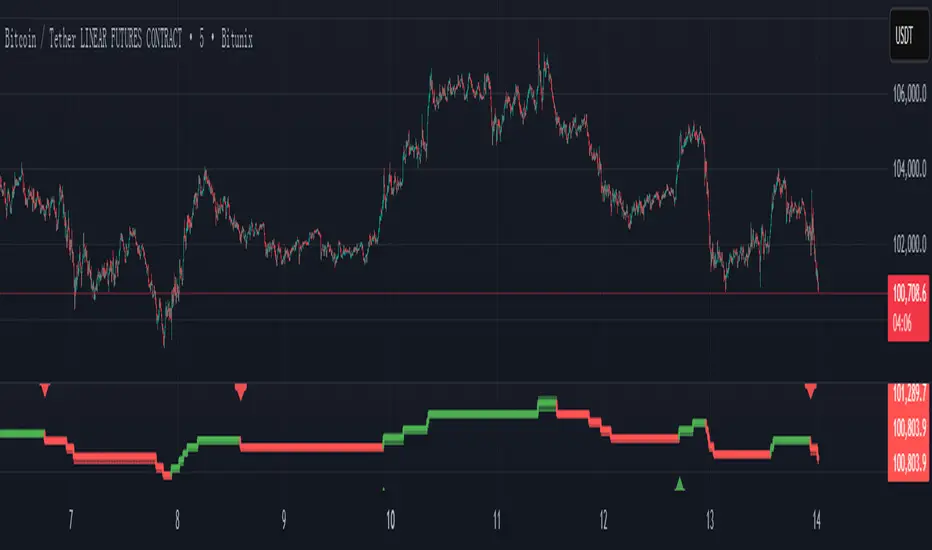
PLANBXPRESS ENTRYThe Combined Signal + Auto Day Plan + Volume indicator merges multiple professional trading concepts into one visual tool — helping traders identify momentum shifts, entry zones, and daily trading plans with volume confirmation.
It automatically detects trend direction, generates dynamic take-profit & stop-loss levels, and overlays key daily reference points such as VWAP, pivot, support, and resistance zones based on ATR and trend context.
⚙️ Main Components
1️⃣ Signal System
Detects trend bias using SMA-based logic.
Generates entry price, TP1–TP3, and SL dynamically from recent impulse ranges.
Updates signals automatically when trend bias changes or previous targets are hit.
Visual levels are drawn directly on the chart.
2️⃣ Volume Analysis
Compares current volume against a moving average (SMA).
Classifies volume as:
🟢 Strong (above 1.5× average)
🟡 Average
🔴 Weak (below 0.8× average)
Displays the current volume strength and trend bias in an on-chart table.
3️⃣ Auto Day Plan
Uses multi-timeframe ATR calculations to define:
Support / Resistance zones
Pivot & Balance areas
Daily VWAP
Auto Targets (ATR-based expansion levels)
Adapts automatically to selected base timeframe (1H, 4H, or Daily).
4️⃣ Trend Context
Dual EMA system (50 & 200) to confirm bullish/bearish structure.
Aligns expected direction with VWAP & pivot location for context-aware bias.
🎯 What You Get on Chart
📈 Automatic LONG/SHORT signals
🎯 TP1, TP2, TP3, and SL levels
📊 Volume strength meter
🧭 VWAP, pivot, support/resistance & balance zones
🎨 Clean visual layout for intraday and swing traders
🧩 Inputs
Parameter Description
lenImpulse Impulse range length
smaLen SMA length for trend bias
levelRatio SL/TP ratio multiplier
volLen Volume SMA length
baseTF Base timeframe for zones/VWAP
atrMult1 / atrMult2 ATR multipliers for target levels
fwdBars Extension range for future projection
💡 How to Use
Add the script to your chart and choose your preferred timeframe.
Observe signal direction (📈 LONG / 📉 SHORT) and TP/SL levels.
Confirm entries when:
Trend aligns with VWAP direction, and
Volume category shows Strong or Average.
Use Auto Day Plan levels (pivot, balance, VWAP) as intraday reaction zones.

QQQ Momentum Regime Rider (EMA + VWAP + ADX + Vol Pullback)My strategy catches intraday momentum, has a phenomenal return of 18% annually

300/200 EMA Spread HeatmapHighlights the difference between 300 and 200 EMA to indicated potential over extensions in breakout structures.


Fibonacci 3H Personalizada - NYIndicador desenvolvido para tracar fibos a cada 3 horas. utilizar para confluencia

5m FVGs Lorem Ipsum is simply dummy text of the printing and typesetting industry. Lorem Ipsum has been the industry's standard dummy text ever since the 1500s, when an unknown printer took a galley of type and scrambled it to make a type specimen book. It has survived not only five centuries, but also the leap into electronic typesetting, remaining essentially unchanged. It was popularised in the 1960s with the release of Letraset sheets containing Lorem Ipsum passages, and more recently with desktop publishing software like Aldus PageMaker including versions of Lorem Ipsum.

First Historical Candle Date daily intervalIndicator that displays a first historical candle on daily interval as a table at a top-right corner

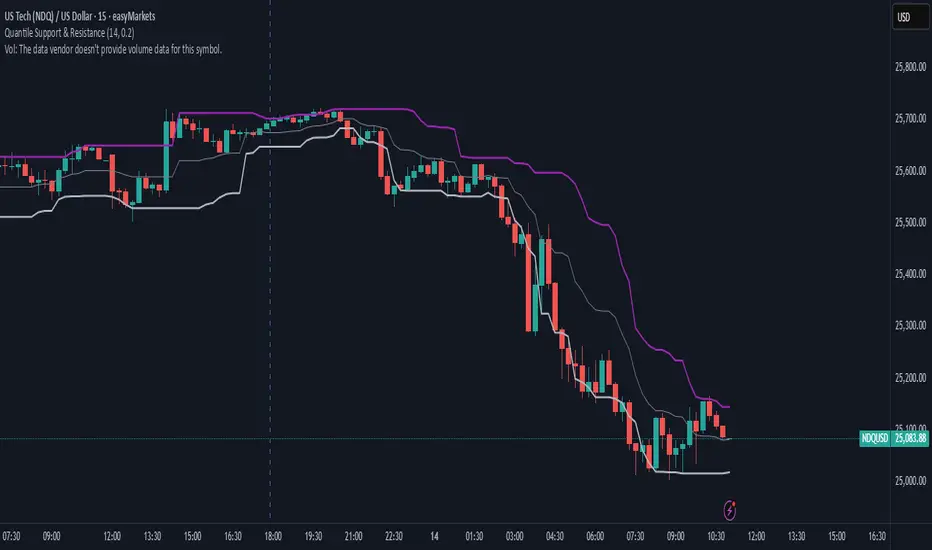
Quantile Support & ResistanceThis indicator plots dynamic support and resistance zones based on quantile logic — a statistically grounded method for identifying structural price boundaries.
Support Level: The price below which only a small percentage of lows fall (default: 10%). This approximates a strong demand zone.
Resistance Level: The price above which only a small percentage of highs rise (default: 10%). This approximates a strong supply zone.
Volatility-Adaptive: Levels adjust automatically to changing market conditions using a configurable lookback window.
Quantile Interpolation: Uses sorted price data and fractional indexing to estimate percentile thresholds with precision.
This tool is ideal for traders who want to visualize statistically significant price zones without relying on subjective drawing or fixed levels. It pairs well with breakout strategies, retest logic, and compression overlays.
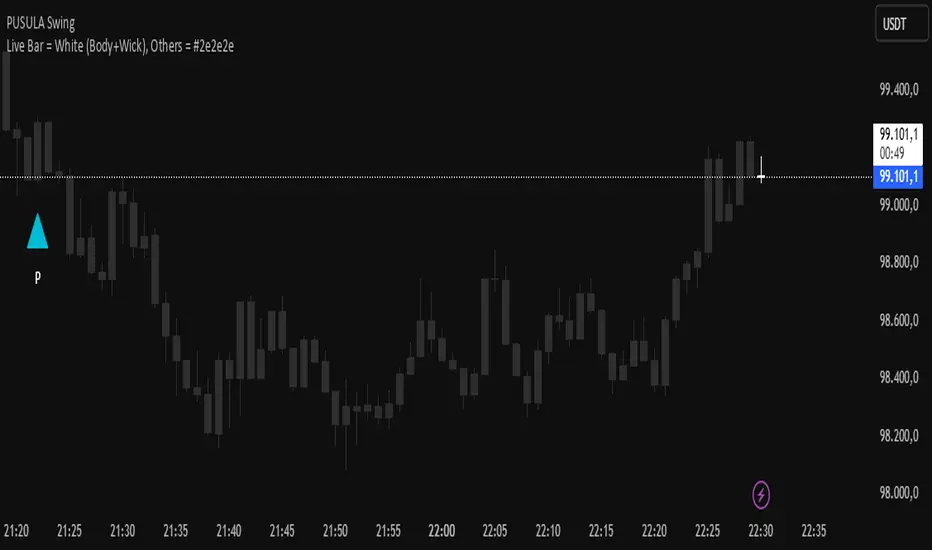
Live Bar = White (Body+Wick), Others = #2e2e2eThis script turns all candles gray, except for the last bar, which is the candle that hasn't closed and whose price is changing live. It makes that candle white so you can always spot the last candle on the chart more clearly. Enjoy!
YCGH ATH DrawdownHow the Indicator Measures Drawdown from ATH
The indicator continuously tracks and calculates the percentage decline from the all-time high (ATH) using a systematic approach.
ATH Tracking Mechanism
Dynamic ATH Calculation: The script maintains a persistent variable that stores the highest price ever reached. On each bar, it compares the current high with the stored ATH using ath := math.max(ath, high), updating the ATH whenever a new peak is reached.

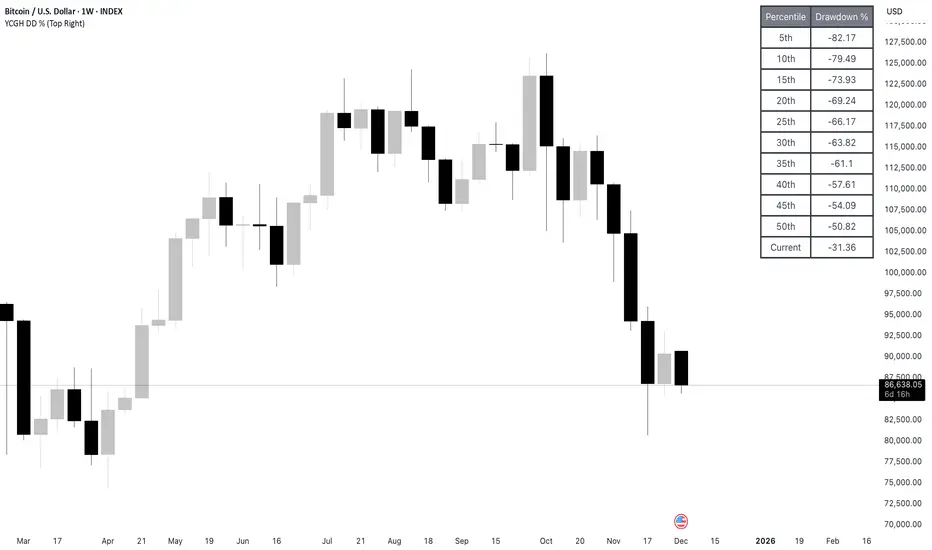
YCGH Drawdown PercentilesWhat This Indicator Does?
The Drawdown Percentiles indicator tracks how far below the all-time high (ATH) a stock or asset is currently trading, then displays statistical percentiles of historical drawdowns in a customizable table.
Percentile Analysis: It collects up to 5,000 historical bars of drawdown data, sorts them, and calculates user-selected percentiles (default: 10th, 30th, 50th) to show where current drawdowns rank historically.
Visual Display: A table shows each percentile threshold with color-coded drawdown values, helping you quickly assess whether the current drawdown is typical or extreme compared to historical patterns.
Practical Use Cases
Risk Assessment: Identify if current drawdowns fall within normal ranges or represent extreme conditions requiring position adjustments.
Entry/Exit Timing: Use percentile rankings to time entries during historically shallow drawdowns (better conditions) and reduce exposure during deep drawdowns.
Strategy Comparison: Compare drawdown patterns across different assets or trading strategies to evaluate risk-adjusted performance.
Taiwan Pagoda Chart (Triple)The code is open-source.
======================
Indicator Name
Taiwan Pagoda Chart
This is a technical analysis charting method similar to candlesticks but with different logic, designed to filter market noise and identify trend reversal points.
Key Features
Dynamic Pagoda Line Plotting
Unlike traditional candlesticks that plot every bar, the Pagoda line only updates when the price breaks above the previous high or below the previous low by a certain threshold.
Bullish (rising) bars are shown in green; bearish (falling) bars in red.
Multiple Optional Filters
T-value filter: Sets a minimum price change threshold to avoid signals from minor fluctuations.
Price percentage filter: Dynamically adjusts sensitivity based on a percentage of the previous Pagoda bar’s range.
ATR volatility filter: Uses Average True Range (ATR) to widen the threshold during high volatility and tighten it during low volatility.
Visual Design
Semi-transparent Pagoda structure for better visual context.
A bold central trend line to clearly show the underlying market direction.
Trading Signal Alerts
Bullish reversal (turning green): Potential buy signal.
Bearish reversal (turning red): Potential sell signal.
Optional on-chart labels (B / S) and support for TradingView alert notifications.
Highly Customizable
Users can freely adjust colors, line width, filtering rules, and signal visibility—making it adaptable to various trading styles.
Ideal Use Cases
Trend following
Reducing false breakouts
Helping medium-to-long-term traders identify high-probability entry and exit points