HTF Candle Breakout Fibonacci LevelsThis indicator automatically plots Fibonacci retracement levels on a lower timeframe (LTF) after detecting a breakout candle on a selected higher timeframe (HTF).
🔍 How It Works
When a candle on your selected HTF closes beyond the high or low of the previous candle, the indicator automatically draws Fibonacci levels on the LTF.
These levels remain visible until the next HTF candle is formed — allowing you to trade retracements with contextual precision.
⸻
⚙️ Customization Options
From the indicator settings, you can modify:
• The HTF candle timeframe (default is 1D)
• Fibonacci levels and colors
• Enable or disable “Show Only the Latest Levels” — ideal for live trading to keep the chart clean and focused.
⸻
🟪 HTF Candles Preview
After applying the indicator, you’ll see 3 vertical bars on the right edge of your LTF chart. These represent a live preview of the last three HTF candles and update in real-time.
If you prefer a cleaner chart, disable this feature via the “Show HTF Candles” toggle in the settings.
⸻
Feel free to reach out if you have any questions.
Candlestickpattern

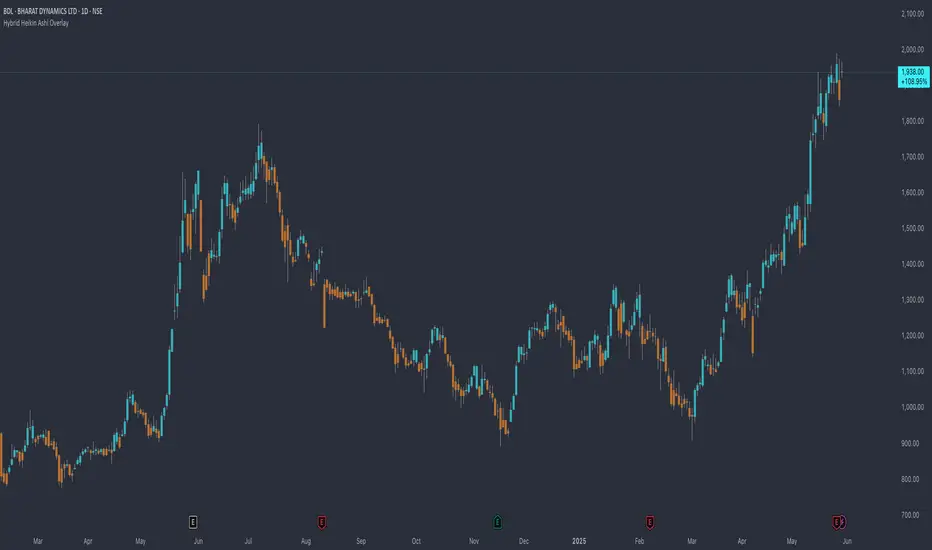
Hybrid Heikin Ashi OverlayHybrid Heikin Ashi Overlay
I personally like Heikin Ashi for its simplicity in showing clean trends. However, it tends to smooth out price action so much that we sometimes miss key signals from the actual candles.
This indicator overlays Heikin Ashi-style background colors while keeping regular candles intact — giving you the best of both worlds:
• Smoother trend visibility
• No loss of execution precision
• Customizable colors & transparency
🔹 No repainting
🔹 No strategy logic — purely visual
🔹 Designed to reduce clutter and help traders stay focused on structure
Created by: @yug_and_her
Candle Breakout Oscillator [LuxAlgo]The Candle Breakout Oscillator tool allows traders to identify the strength and weakness of the three main market states: bullish, bearish, and choppy.
Know who controls the market at any given moment with an oscillator display with values ranging from 0 to 100 for the three main plots and upper and lower thresholds of 80 and 20 by default.
🔶 USAGE
The Candle Breakout Oscillator represents the three main market states, with values ranging from 0 to 100. By default, the upper and lower thresholds are set at 80 and 20, and when a value exceeds these thresholds, a colored area is displayed for the trader's convenience.
This tool is based on pure price action breakouts. In this context, we understand a breakout as a close above the last candle's high or low, which is representative of market strength. All other close positions in relation to the last candle's limits are considered weakness.
So, when the bullish plot (in green) is at the top of the oscillator (values above 80), it means that the bullish breakouts (close below the last candle low) are at their maximum value over the calculation window, indicating an uptrend. The same interpretation can be made for the bearish plot (in red), indicating a downtrend when high.
On the other hand, weakness is indicated when values are below the lower threshold (20), indicating that breakouts are at their minimum over the last 100 candles. Below are some examples of the possible main interpretations:
There are three main things to look for in this oscillator:
Value reaches extreme
Value leaves extreme
Bullish/Bearish crossovers
As we can see on the chart, before the first crossover happens the bears come out of strength (top) and the bulls come out of weakness (bottom), then after the crossover the bulls reach strength (top) and the bears weakness (bottom), this process is repeated in reverse for the second crossover.
The other main feature of the oscillator is its ability to identify periods of sideways trends when the sideways values have upper readings above 80, and trending behavior when the sideways values have lower readings below 20. As we just saw in the case of bullish vs. bearish, sideways values signal a change in behavior when reaching or leaving the extremes of the oscillator.
🔶 DETAILS
🔹 Data Smoothing
The tool offers up to 10 different smoothing methods. In the chart above, we can see the raw data (smoothing: None) and the RMA, TEMA, or Hull moving averages.
🔹 Data Weighting
Users can add different weighting methods to the data. As we can see in the image above, users can choose between None, Volume, or Price (as in Price Delta for each breakout).
🔶 SETTINGS
Window: Execution window, 100 candles by default
🔹 Data
Smoothing Method: Choose between none or ten moving averages
Smoothing Length: Length for the moving average
Weighting Method: Choose between None, Volume, or Price
🔹 Thresholds
Top: 80 by default
Bottom: 20 by default

Malama's Candle Sniper Malama's Candle Sniper
This Pine Script is an overlay indicator crafted for TradingView to detect and highlight a variety of bullish and bearish candlestick patterns directly on the price chart. Its primary goal is to assist traders in identifying potential reversal or continuation signals by marking these patterns with labeled visual cues. The indicator is versatile, applicable across different markets (e.g., stocks, forex, cryptocurrencies) and timeframes, making it a valuable tool for enhancing technical analysis and informing trading decisions.
Originality and Usefulness
While the candlestick patterns detected by this script are well-established in technical analysis, "Malama's Candle Sniper" stands out due to its comprehensive nature. It consolidates the detection of numerous patterns—ranging from engulfing patterns to doji variations and multi-candle formations—into a single, unified indicator. This eliminates the need for traders to apply multiple individual indicators, streamlining their charting process and saving time.
The indicator’s usefulness lies in its ability to:
Provide Visual Clarity: Labels are plotted on the chart when patterns are detected, offering immediate recognition of potential trading opportunities.
Broad Pattern Coverage: It identifies both bullish and bearish patterns, accommodating various market conditions and trading strategies.
This makes it an ideal tool for traders who incorporate candlestick analysis into their decision-making, whether for spotting trend reversals or confirming ongoing momentum.
How It Works
"Malama's Candle Sniper" operates by defining helper functions in Pine Script that evaluate whether specific candlestick pattern conditions are met for the current bar. Each function returns a boolean value (true/false) based on predefined criteria involving the open, high, low, and close prices of the candles. The script then checks for transitions from false to true (i.e., a pattern newly appearing) and plots a corresponding label on the chart.
Bullish Patterns Detected
The script identifies the following bullish patterns, which typically signal potential upward price movements:
Bullish Engulfing: A small bearish candle followed by a larger bullish candle that engulfs it.
Three White Soldiers: Three consecutive bullish candles with higher closes.
Bullish Three Line Strike: Three bullish candles followed by a bearish candle that doesn’t negate the prior uptrend.
Three Inside Up: A bearish candle, a smaller bullish candle within its range, and a strong bullish confirmation candle.
Dragonfly Doji: A doji with a long lower wick and little to no upper wick, opening and closing near the high.
Piercing Line: A bearish candle followed by a bullish candle that opens below the prior low and closes above the midpoint of the prior candle.
Bullish Marubozu: A strong bullish candle with no upper or lower wicks.
Bullish Abandoned Baby: A bearish candle, a doji gapped below it, and a bullish candle gapped above the doji.
Rising Window: A gap up between two candles, with the current low above the prior high.
Hammer: A candle with a small body and a long lower wick, indicating rejection of lower prices.
Morning Star: A three-candle pattern with a bearish candle, a small-bodied middle candle, and a strong bullish candle.
Bearish Patterns Detected
The script also detects these bearish patterns, which often indicate potential downward price movements:
Bearish Engulfing: A small bullish candle followed by a larger bearish candle that engulfs it.
Three Black Crows: Three consecutive bearish candles with lower closes.
Bearish Three Line Strike: Three bearish candles followed by a bullish candle that doesn’t reverse the downtrend.
Three Inside Down: A bullish candle, a smaller bearish candle within its range, and a strong bearish confirmation candle.
Gravestone Doji: A doji with a long upper wick and little to no lower wick, opening and closing near the low.
Dark Cloud Cover: A bullish candle followed by a bearish candle that opens above the prior high and closes below the midpoint of the prior candle.
Bearish Marubozu: A strong bearish candle with no upper or lower wicks.
Bearish Abandoned Baby: A bullish candle, a doji gapped above it, and a bearish candle gapped below the doji.
Falling Window: A gap down between two candles, with the current high below the prior low.
Hanging Man: A candle with a small body and a long lower wick after an uptrend, signaling potential reversal.
Label Plotting
When a pattern is detected (i.e., its condition transitions from false to true):
Bullish Patterns: A label is plotted at the high of the bar, using a green background with white text and a downward-pointing style (e.g., "Bull Engulf" for Bullish Engulfing).
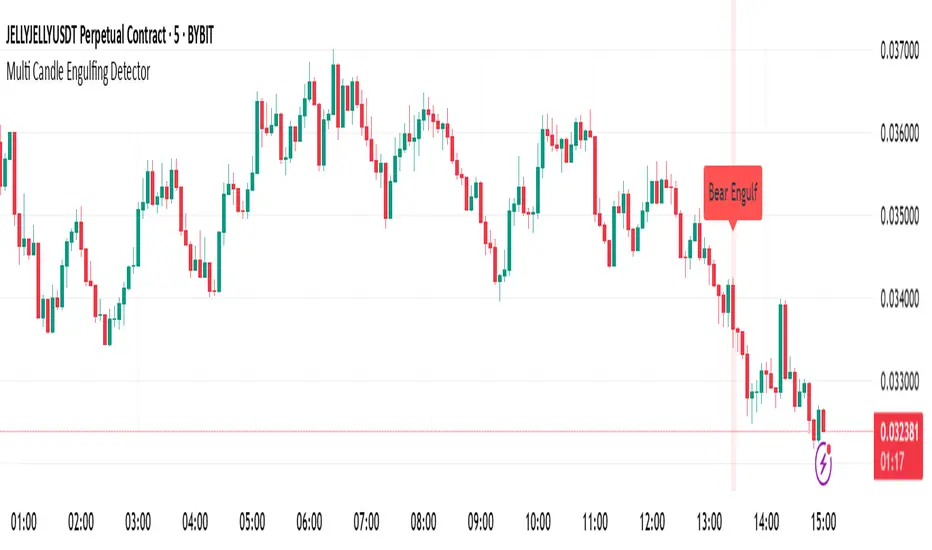
Bearish Patterns: A label is plotted at the low of the bar, using a red background with white text and an upward-pointing style (e.g., "Bear Engulf" for Bearish Engulfing).
This visual distinction helps traders quickly differentiate between bullish and bearish signals and their precise locations on the chart.
Strategy and Risk Management
Backtesting: "Malama's Candle Sniper" is strictly an indicator and does not include backtesting capabilities or automated trading signals. It does not simulate trades or provide performance statistics such as win rates or profit/loss metrics.
Risk Management: As an informational tool, it lacks built-in risk management features. Traders must independently implement strategies like stop-loss orders, take-profit levels, or position sizing to manage risk when acting on the detected patterns. For example, a trader might place a stop-loss below a Hammer pattern’s low or above a Hanging Man’s high to limit potential losses.
User Settings and Customization
Inputs: The script does not offer user-configurable inputs. All pattern detection logic is hardcoded, meaning traders cannot adjust parameters such as lookback periods or pattern sensitivity through the interface.
Customization: Advanced users with Pine Script knowledge can modify the code directly to:
Add or remove patterns.
Adjust the conditions (e.g., tweak the wick-to-body ratio for a Hammer).
Change label styles or colors.
However, the default version is fixed and ready-to-use as is.
Visualizations and Chart Setup
Plotted Elements:
Bullish Labels: Appear at the candle’s high with a green background, white text, and a downward-pointing arrow (e.g., "Hammer").
Bearish Labels: Appear at the candle’s low with a red background, white text, and an upward-pointing arrow (e.g., "Hanging Man").
Chart Setup: The indicator is configured as an overlay (overlay=true), meaning it integrates seamlessly with the price chart. Labels are displayed directly on the candlesticks, eliminating the need for a separate pane and keeping the focus on price action.
Usage Example
To use "Malama's Candle Sniper":
Add the indicator to your TradingView chart via the Indicators menu.
Observe the price chart for green (bullish) or red (bearish) labels as they appear.
Analyze the context of each pattern (e.g., trend direction, support/resistance levels) to decide on potential trades.
Apply your own entry, exit, and risk management rules based on the signals.
For instance, spotting a "Morning Star" label during a downtrend near a support level might prompt a trader to consider a long position, while a "Dark Cloud Cover" at resistance could signal a short opportunity.

Auto Price Action SR Levels by Chaitu50cAuto Price Action SR Levels by Chaitu50c:
This is a session-based support and resistance indicator that identifies price levels based on actual candle activity, without relying on traditional indicators. It works by clustering open, high, low, or close values of past candles that frequently occur within a defined price range, making it a reliable price action-based tool for intraday traders.
The indicator calculates these levels at the start of each new trading session (based on NSE 09:15 time) and keeps them static throughout the session. This avoids unnecessary noise or flickering due to live price action, giving traders consistent zones to work with during the day.
FEATURES:
* Automatic detection of support and resistance levels based on candle price hits
* Cluster formation using high/low or open/close logic
* Static levels: calculated once per session and remain unchanged until the next session
* Adjustable settings for:
* Cluster range (in points)
* Number of lookback candles
* Line width
* Line color (default: black)
* Minimalist design for a clean chart experience
HOW IT WORKS:
The indicator looks back over a defined number of candles at the beginning of each session. It clusters prices that fall within a specified range (e.g., 250 points) and counts how many times they appear as open, high, low, or close values. If a price level is hit at least once (default), it is considered significant and a line is plotted.
Because clustering is done once per session, the lines do not shift during the session. This allows traders to base decisions on fixed, stable levels formed by prior market structure.
RECOMMENDED FOR:
* Intraday traders
* Price action traders
* Traders who prefer clean charts with logical SR zones
* Nifty, BankNifty, and stock-based day trading
Created by Chaitu50c for traders who rely on logic and structure, not signals.
Disclaimer:
This indicator is intended for educational and informational purposes only. It does not constitute financial advice or trading recommendations. Use at your own discretion and always manage risk responsibly.
---
Let me know if you’d like to include use-case examples or screenshots before publishing.

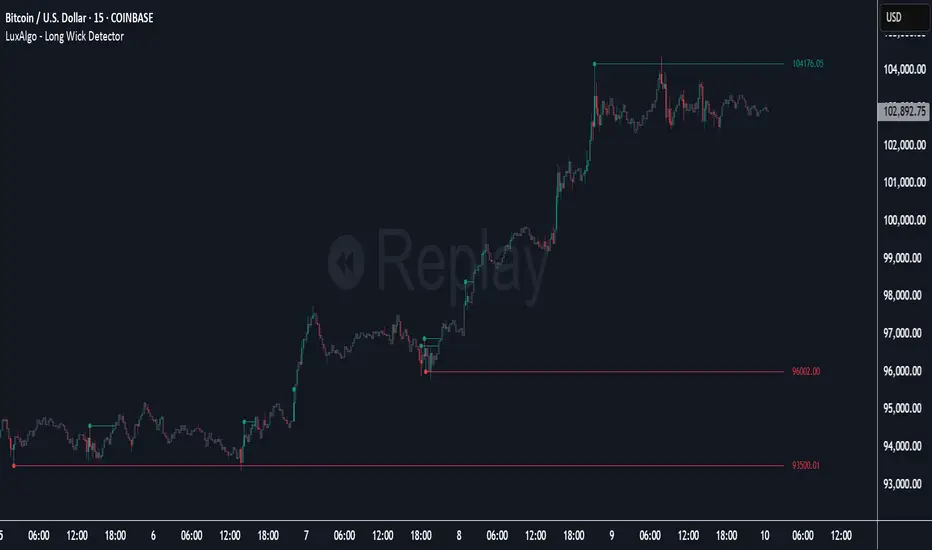
Long Wick Detector [LuxAlgo]The Long Wick Detector tool allows traders to identify candle wicks longer than a user-defined volatility threshold. This makes it useful for spotting zones with high supply or demand.
The tool displays mitigated and unmitigated levels and changes the color of the candles based on wick size and level breakouts.
🔶 USAGE
By default, the tool displays long mitigated and unmitigated candle wicks, with a maximum duration for an unmitigated long wick of 1,000 bars. What does all this mean?
🔹 Wick Threshold
Traders can adjust the volatility threshold to identify long wicks, with a higher threshold detecting more significant wicks.
As we can see in the image above, the tool detects more wicks with a smaller threshold compared to a higher one.
🔹 Level %
Traders can choose the percentage of the wick at which the level is located. By default, the level is displayed at the extremes of the wick. This parameter accepts values between 0 and 100.
100: extreme of the wick
50: middle of the wick
0: start of the wick
🔹 Max Duration
This parameter allows traders to specify the number of bars for the levels. The tool will only display mitigated or unmitigated levels up to the specified number of bars.
As shown in the above image, a longer duration allows more room for mitigation, displaying more levels.
🔹 Colored Candles
The tool allows for color customization using two parameters from the settings panel. The chart shows the different outputs.
The setting "Wick-Based Transparency" makes candles with smaller wicks less visible and candles with longer wicks more visible.
On the other hand, "Breakout-Based Color" changes the base color of the candles based on the mitigation of long wicks. When the price breaks above a detected top wick, the bullish color is used. When the price breaks below a detected bottom wick, the bearish color is used.
🔶 SETTINGS
Wick Threshold: The volatility threshold for wick detection. Use a smaller value to detect smaller wicks.
Level %: Placement of the plotted level relative to the wick.
Max Duration: The maximum duration in bars of mitigated wicks.
Mitigated Wicks: Enable or disable mitigated wicks.
🔹 Style
Wick Based Transparency: Make candles with smaller wicks more transparent and candles with longer wicks more solid.
Breakout Based Color: Change the base color based on wick mitigation.
Bullish & Bearish Colors
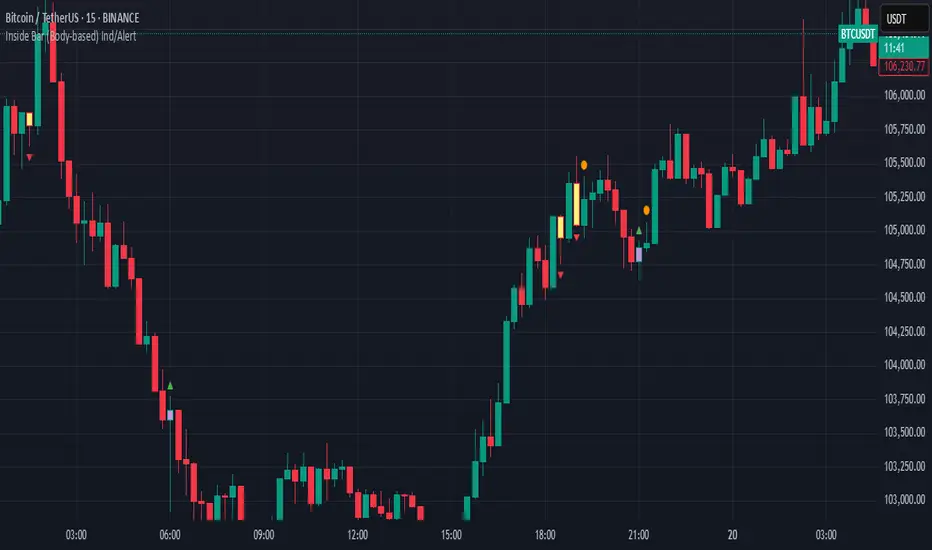
Inside Bar (Body-based) Ind/AlertDescription:
This indicator detects Inside Bar patterns based strictly on the candle body (open/close range) of the mother candle, rather than the traditional high/low wick method. An inside bar is highlighted when the current candle’s entire body is contained within the body of the previous candle.
It can be useful for traders who want a more conservative and reliable definition of inside bars, focusing on true consolidation periods and filtering out signals caused by extended wicks.
Features:
Body-based Inside Bar detection:
The indicator colors and marks candles where the current bar’s body is fully within the previous bar’s body.
Bullish/Bearish identification:
Bullish inside bars are marked in green, bearish in red.
Double Inside Bar Detection:
An optional feature marks when two consecutive candles’ bodies are inside the same mother bar body—potentially indicating stronger consolidation.
Alerts:
Set alerts for single or double inside bars for automated monitoring.
How to Use:
Add the indicator to your chart.
Look for colored bars or plotted shapes for inside bar signals based on candle bodies.
Use alerts to get notified in real time when inside bar patterns appear.
Note:
This script uses only the candle body (open and close) for inside bar calculations, which may help filter out less reliable signals found with wick-based approaches.
Multi Candle Engulfing Detector🔍 Multi Candle Engulfing Detector
This indicator identifies powerful engulfing candles that consume three or more previous candles — a signal often tied to strong market reversals or continuation moves.
🧠 Features
Detects candles that fully engulf the previous 3 or more candles
Optional filtering: only trigger when the engulfed candles are of the opposite color
Customizable engulf count for greater pattern control
Clear bullish and bearish signal labels on the chart
Alerts integrated: get notified the moment a setup forms
Background highlighting for enhanced visibility
⚙️ Settings
Minimum Number of Candles to Engulf: Default is 3, but can be adjusted
Require Opposite Color: When enabled, the engulfing candle must be opposite in color to the engulfed ones (e.g., green engulfing red)
📈 Use Cases
Spot strong reversal signals at tops and bottoms
Confirm breakout momentum on trend continuation
Use in confluence with other tools like volume or support/resistance
🚨 Alerts
Alerts fire when a bullish or bearish engulfing pattern is detected, allowing for mobile, email, or webhook notifications.
✅ Notes
This script is fully customizable and can be extended into a strategy or scanning tool. Feedback and suggestions are always welcome!
Bullish & Bearish Engulfing ProHello Traders!
Overview
The Bullish & Bearish Engulfing Pro indicator is a powerful pattern recognition tool that identifies key reversal points and trend continuation opportunities. These engulfing patterns often mark the beginning of a significant price move and are widely used in technical analysis. For example, in an uptrend, a Bullish Engulfing pattern can provide an ideal pullback entry signal.
This indicator combines traditional candlestick theory with advanced technical filters like trend direction and volatility analysis to offer traders precise, high-confidence signals.
Key Features :
Accurate pattern detection:
Uses refined algorithms to detect true Bullish and Bearish Engulfing patterns, filtering out noise and false positives.
Trend filter:
Customizable Simple Moving Average (SMA) ensures trades are aligned with the market’s broader trend, improving trade success rates.
Volatility awareness:
ATR-based filtering ensures that only statistically significant engulfing patterns are highlighted.
Visual clarity:
Bullish and Bearish Engulfing patterns are displayed with distinct, customizable colors and labels for instant recognition.
Flexible customization:
Users can adjust detection criteria, SMA settings, and visual options to suit their personal strategy.
Filtered signal display:
Option to visualize filtered-out signals to better understand how the logic makes its decisions.
Bullish Engulfing Pattern
Appears after a downtrend or during a pullback in an uptrend
Consists of two candles
A smaller bearish candle
Followed by a larger bullish candle that completely engulfs the previous body
Bearish Engulfing Pattern
Appears after an uptrend or during a pullback in a downtrend
Consists of two candles
A smaller bullish candle
Followed by a larger bearish candle that completely engulfs the previous body
Key differences in this implementation
What makes this indicator unique
Trend and volatility filters
Ensure patterns occur in meaningful market conditions
Comprehensive pattern analysis:
Factors in candle body ratios, wick sizes, and relative size to past candles for smarter detection
Adaptive to market conditions:
Dynamic thresholds based on ATR allow pattern recognition to adjust to different volatility regimes
Educational value:
Visualizing rejected patterns helps traders build intuition and refine their discretion
How to Trade with this Indicator
Engulfing patterns can signal strong reversals or pullback continuations. Use them with trend and volume confirmation to maximize their effectiveness.
snapshot
Bullish Opportunities:
Look for Bullish Engulfing patterns (aqua-colored candles and labels) during or after a pullback in an uptrend.
Bearish Opportunities:
Watch for Bearish Engulfing patterns (orange-colored candles and labels) during or after a rally in a downtrend.
Entry: Enter on the next bar open after the engulfing candle completes.
Stop loss: 2 ticks below/above the engulfing candle’s low/high.
Take profit: Aim for at least a 2R target, a swing high/low or manage the tradewith a trailing stop.
Trend Alignment:
For higher win probability, take trades only in the direction of the SMA-defined trend.
Note: To ensure the candle coloring appears correctly, place the indicator at the top of the object tree.

Candlestick Pattern Indicator – Doji, Harami, More [algo_aakash]This Candlestick Pattern Indicator is designed to help traders identify key price action patterns like Bullish Engulfing, Bearish Engulfing, Doji, Hammer, Morning Star, Evening Star, and many more directly on your TradingView chart. With customizable options to display both bullish and bearish patterns , this indicator provides real-time visual markers and labels, helping you make informed trading decisions.
Key features of the indicator include:
Detects popular candlestick patterns such as Bullish Engulfing, Bearish Engulfing, Hammer, Morning Star, Tweezer Tops, and more.
Customizable settings for displaying pattern shapes, labels, and opacity, tailored to your trading preferences.
Option to plot signals only after a candle closes, ensuring accuracy.
Alerts for immediate notification of detected patterns.
Visual markers on the chart, including arrows and labels, for quick recognition of potential trade setups.
This indicator is ideal for traders who rely on candlestick patterns for technical analysis and want an automated tool to highlight these setups for easier decision-making.
Whether you're a beginner or an experienced trader, this tool will help you spot important patterns in real-time without cluttering your chart.

Open Range Candle [TradeWithRon]This Open Range Break indicator is a tool designed to help traders identify and visualize key price levels using the Opening Range Breakout (ORB) strategy. This indicator dynamically plots critical levels such as the high, low, and middle of a predefined range, along with Fibonacci retracement levels for further analysis. It also features several customization options to fit various trading styles.
Key Features:
Session Setup: Allows the user to set the time offset in GMT - or + to adjust the ORB session to their local time zone.
The default ORB session is set at 9:45 AM but can be adjusted based on user preferences.
Warning: Only supports 5-minute and 15-minute timeframes.
Visual Customization:
Line Styles: Users can choose from Solid, Dotted, or Dashed lines to represent key price levels.
Color Adjustments: Customizable colors for the high, middle, and low levels of the range, as well as Fibonacci levels and vertical lines.
Labeling Options: The labels can be customized in terms of size and color, helping to keep the chart clean and clear.
Fibonacci Retracement Levels: Fibonacci retracement levels are automatically drawn between the high and low of the range. Users can toggle these on or off and customize the offset to suit different trading instruments.
Time-Based Visuals: A vertical line is drawn at the start of the ORB session, providing a clear visual marker of where the breakout starts. This is useful for pinpointing key trade setups.
The indicator supports both 5-minute and 15-minute timeframes.
EMA Integration: The user can enable an Exponential Moving Average (EMA) on any chosen timeframe with adjustable parameters such as the length and color, providing additional trend context.
Dynamic Labeling: The indicator labels the high, middle, and low points of the ORB with custom text. These labels are updated in real-time as new data becomes available.
Limit on Lines and Labels: The indicator allows for a limit on the number of lines and labels drawn to maintain a clean chart, preventing unnecessary clutter as more ORB levels are plotted.
Daily Bias Information: The indicator assesses the daily trend bias (bullish or bearish) based on the relationship between the open and close prices for the last three daily candles, providing context for the current trading session.
Countdown Timer: The remaining time until the end of the current session is displayed in a countdown format, which helps traders to time their entries and exits more precisely.
How To Use:,
- Set the Timeframe to 15 minutes.
- Adjust the Time Zone Offset if needed, based on your local time zone.
- Enable the Show ORB feature for the first 15-minute candle to be drawn as the opening range. - The indicator will automatically mark the high, middle, and low points of the range.
Identify Breakout Points:
Bullish Breakout: If the price breaks above the high of the 15-minute opening range, this indicates a potential bullish breakout. The indicator will plot a vertical line marking the breakout point for further confirmation.
Bearish Breakout: If the price breaks below the low of the 15-minute opening range, this signals a potential bearish breakout. Again, the indicator will plot the breakout point with a vertical line for easy identification.
🔶 Disclaimer
Use with Caution: This indicator is provided for educational and informational purposes only and should not be considered as financial advice. Users should exercise caution and perform their own analysis before making trading decisions based on the indicator's signals.
Not Financial Advice: The information provided by this indicator does not constitute financial advice, and the creator (Tradewithron) shall not be held responsible for any trading losses incurred as a result of using this indicator.
Backtesting Recommended: Traders are encouraged to backtest the indicator thoroughly on historical data before using it in live trading to assess its performance and suitability for their trading strategies.
Risk Management: Trading involves inherent risks, and users should implement proper risk management strategies, including but not limited to stop-loss orders and position sizing, to mitigate potential losses.
No Guarantees: The accuracy and reliability of the indicator's signals cannot be guaranteed, as they are based on historical price data and past performance may not be indicative of future

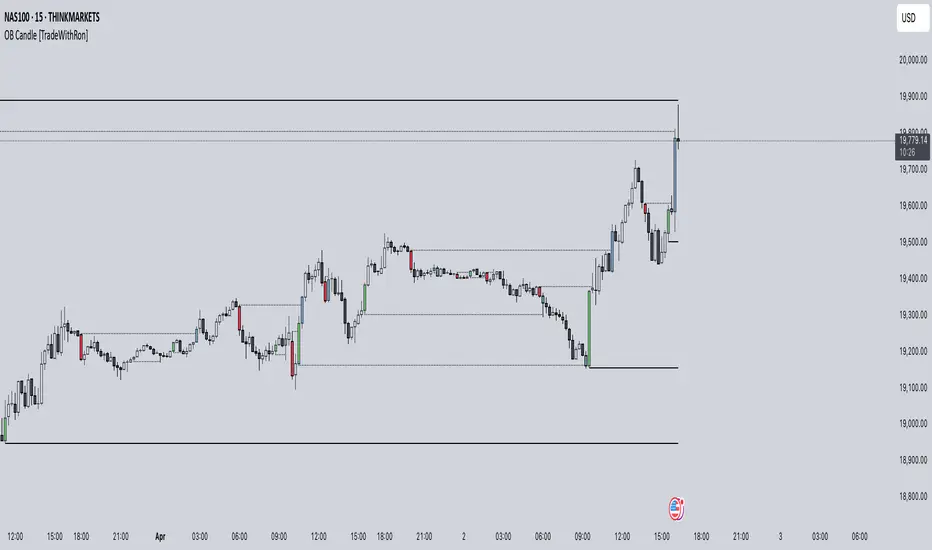
Order Block Candle [TradeWithRon]Order Block Candle
This indicator is designed to help traders identify and visualize key movements within the market. These order blocks are areas where significant buying or selling has occurred, often leading to a strong price reaction. This script detects both bullish and bearish order blocks (with volume spike), marking them directly on your chart, and offers a variety of customization options to enhance your trading experience.
Features:
Bullish and Bearish Candles: Bullish Order Block: Identified when the current price creates a higher high and closes above the previous price, indicating a zone of potential buying activity by institutional traders.
Bearish Order Block: Identified when the current price creates a lower low and closes below the previous price, suggesting strong institutional selling.
Volume-Weighted Analysis: The indicator allows traders to incorporate volume into the order block detection. When a volume pivot (a significant change in volume) is detected, it strengthens the validity of the identified order block.
Customizable Visuals:
- Users can adjust the color and style of order block lines, including solid, dashed, or dotted styles, to suit personal preferences.
- Bullish Order Block Color: Choose from a range of colors to highlight bullish order blocks (default is green).
- Bearish Order Block Color: Choose a color for bearish order blocks (default is red).
- Users can also customize the color and style of the lines representing order blocks, helping traders visually track key levels.
Candle Body or. Wick: The indicator provides flexibility in defining the price range of the order block. Traders can choose whether to calculate the order block using the candle body (open and close) or the full wick (high and low) to suit their trading strategy.
Dynamic Line Extensions: Order block lines are dynamically extended to provide ongoing support and resistance levels. When a price breaks an order block line, the line changes to a dotted style, marking it as "broken." This allows traders to easily spot when the market invalidates an order block.
Alerts:
- Alert for Bullish Order Block: Get notified when a new bullish order block is detected.
- Alert for Bearish Order Block: Receive alerts when a bearish order block is identified.
- Alert for Broken Lines: Set up alerts to be notified when a bullish or bearish order block line is broken, giving traders a signal for potential market shifts.
Zone Management:
- The indicator tracks upper and lower zone information, marking significant price levels where institutional buying or selling might occur. Traders can adjust settings to define how many previous lines should be displayed on the chart for reference.
Optional Mitigated Order Blocks:
- A feature that highlights mitigated (neutralized) order blocks with a specific color and line style, offering additional insight into market behavior.
Input Settings:
- Length: The number of bars to the left and right of a pivot point for it to be considered a high or low.
- Candle Body: Option to use the candle body for calculations (as opposed to the wick).
- Bullish and Bearish Candle Color: Customizable colors for bullish and bearish order blocks.
- Open Line Style: Choose between solid, dashed, or dotted line styles for order block visualization.
- Removed Old Lines: Control the number of broken lines shown on the chart.
- Mitigated Line Style: Select line style for mitigated order blocks.
- Volume Use: Enable volume-based detection for stronger order block validation.
How to Use:
This indicator is ideal for traders looking to trade around institutional support and resistance levels. The bullish and bearish order blocks can serve as key entry or exit points, while broken lines offer dynamic support/resistance that adapt to market changes. Use the alerts to stay informed of critical market developments and adjust your trading strategy accordingly.
🔶 Disclaimer
Use with Caution: This indicator is provided for educational and informational purposes only and should not be considered as financial advice. Users should exercise caution and perform their own analysis before making trading decisions based on the indicator's signals.
Not Financial Advice: The information provided by this indicator does not constitute financial advice, and the creator (Tradewithron) shall not be held responsible for any trading losses incurred as a result of using this indicator.
Backtesting Recommended: Traders are encouraged to backtest the indicator thoroughly on historical data before using it in live trading to assess its performance and suitability for their trading strategies.
Risk Management: Trading involves inherent risks, and users should implement proper risk management strategies, including but not limited to stop-loss orders and position sizing, to mitigate potential losses.
No Guarantees: The accuracy and reliability of the indicator's signals cannot be guaranteed, as they are based on historical price data and past performance may not be indicative of future
Sentiment OscillatorIn the complex world of trading, understanding market sentiment can be like reading the emotional pulse of financial markets. Our Sentiment Oscillator is designed to be your personal market mood translator, helping you navigate through the noise of price movements and market fluctuations.
Imagine having a sophisticated tool that goes beyond traditional price charts, diving deep into the underlying dynamics of market behavior. This indicator doesn't just show you numbers – it tells you a story about market sentiment, combining multiple financial signals to give you a comprehensive view of potential market directions.
The Sentiment Oscillator acts like a sophisticated emotional barometer for stocks, cryptocurrencies, or any tradable asset. It analyzes price changes, market volatility, trading volume, and long-term trends to generate a unique sentiment score. This score ranges from highly bullish to deeply bearish, providing traders with an intuitive visual representation of market mood.
Green zones indicate positive market sentiment, suggesting potential buying opportunities. Red zones signal caution, hinting at possible downward trends. The oscillator's gray neutral zone helps you identify periods of market uncertainty, allowing for more calculated trading decisions.
What sets this indicator apart is its ability to blend multiple market factors into a single, easy-to-understand indicator. It's not just about current price – it's about understanding the deeper currents moving beneath the surface of market prices.
Traders can use this oscillator to:
- Identify potential trend reversals
- Understand market sentiment beyond price movement
- Spot periods of market strength or weakness
- Complement other technical analysis tools
Whether you're a day trader, swing trader, or long-term investor, the Sentiment Oscillator provides an additional layer of insight to support your trading strategy. Remember, no indicator is a crystal ball, but this tool can help you make more informed decisions in the dynamic world of trading.

Big Candles FilterHow It Works
A candle is considered "big" only if its body (distance from open to close) exceeds the barHeight value.
** NOT calculated by Range !!!
Features :
Bullish candles (close > open) are marked with a green "Buy" triangle if the body is large enough.
Bearish candles (close < open) are marked with a red "Sell" triangle if the body is large enough.
The bars are colored for big candles, and optional labels show the open and close prices.

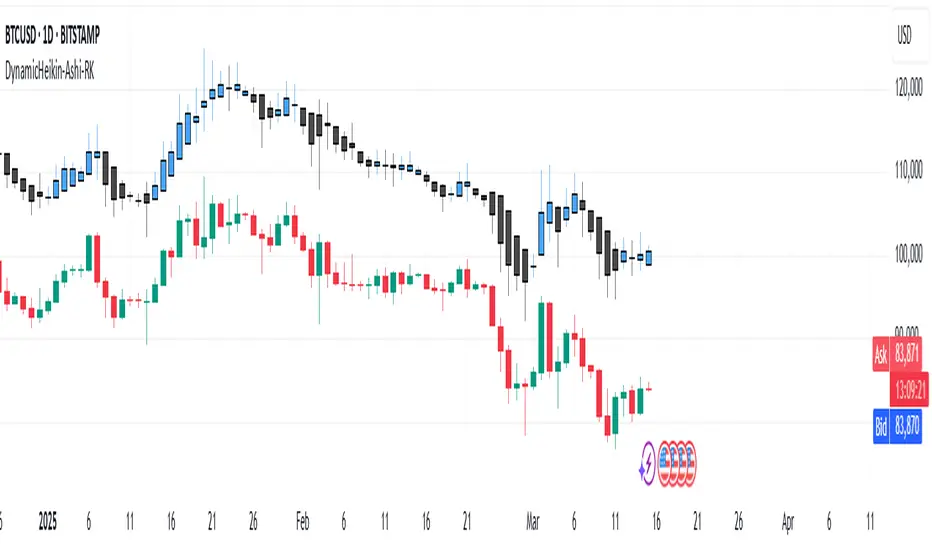
DynamicHeikin-Ashi-RKDynamic Heikin-Ashi RK is an advanced Heikin-Ashi candle indicator with a unique ATR-based offset mechanism. This script refines traditional Heikin-Ashi calculations while dynamically shifting the candles using ATR multipliers, helping traders visualize market trends with greater clarity.
🔹 Features:
✔ Customizable Heikin-Ashi colors
✔ ATR-based dynamic candle offset
✔ Enhanced trend visualization
This tool is ideal for traders looking for a smoother trend representation while incorporating volatility-based adjustments. 🚀
Customizations Available in Dynamic Heikin-Ashi RK
This indicator allows several customizations to suit different trading styles:
🔹 Heikin-Ashi Candle Display: Toggle the visibility of Heikin-Ashi candles.
🔹 Custom Colors: Choose custom colors for bullish and bearish Heikin-Ashi candles.
🔹 ATR-Based Dynamic Offset: Adjust the ATR multiplier to control the offset of Heikin-Ashi candles, helping fine-tune trend visualization.
🔹 Refined Heikin-Ashi Calculation: Uses a smoother formula for Heikin-Ashi candles, enhancing clarity.
With these options, traders can personalize the indicator for better trend detection and volatility analysis. 🚀
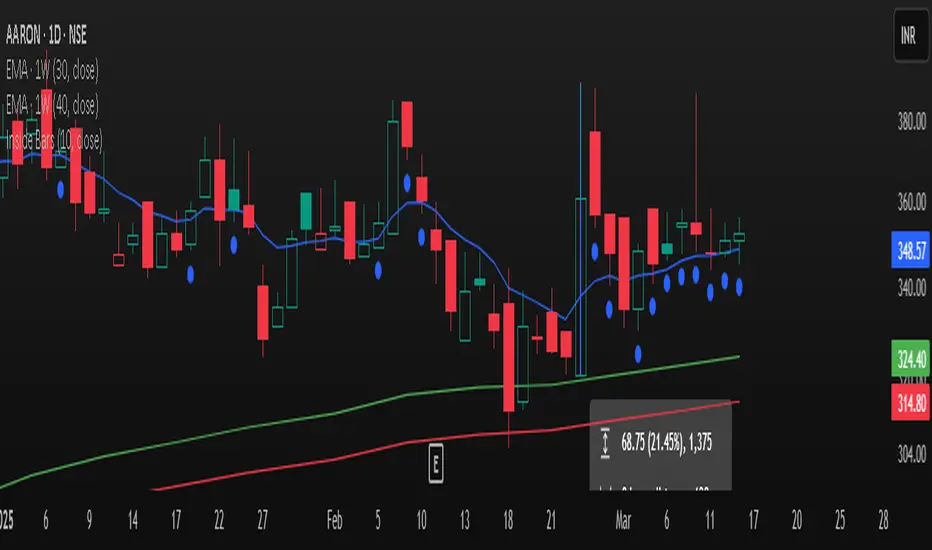
Inside Bars📌 Overview:
This indicator scans for multiple inside bars during periods of consolidation by dynamically designating a “mother bar” and then marking subsequent bars that trade entirely within its range. It includes an optional doji filter on the most recent candle, helping to confirm indecision before potential breakouts.
🛠 Key Features:
✅ Dynamic Mother Bar Identification:
The script selects a mother bar when the current bar’s range exceeds that of the previous bar. This bar sets the high and low boundaries, creating a reference zone for later price action.
Once a mother bar is defined, subsequent candles that remain completely within its high and low are flagged as inside bars.
✅ Optional Doji Check:
For added precision, an optional feature lets you verify that the most recent bar is a doji—a candle where the difference between the open and close is minimal relative to its total range. This additional filter highlights periods of market indecision, which can often precede strong directional moves.
⚡ Add this script to your chart and enhance your trading strategy! 🚀
Vortex Candle MarkerVortex Candle Marker
The Vortex Candle Marker is a specialized TradingView indicator designed to identify and highlight **Vortex Candles**—candles that momentarily form without wicks on either the high or low. This unique price behavior can signal potential price retracements or reversals, aligning with the **Power of Three (PO3)** concept in price action theory.
Indicator Logic:
A candle is classified as a **Vortex Candle** if either of these conditions is met during its formation:
1. **Vortex Top:** The **high** equals either the **open** or **close**, indicating no upper wick.
2. **Vortex Bottom:** The **low** equals either the **open** or **close**, indicating no lower wick.
When a Vortex Candle is detected, the indicator changes the **candle border color** to **aqua**, making it easy to identify these significant price moments.
Market Insight & PO3 Interpretation:
In typical price behavior, most candles exhibit both upper and lower wicks, representing price exploration before settling at a closing value. A candle forming without a wick suggests **strong directional intent** at that moment. However, by the **Power of Three (PO3)** concept—Accumulation, Manipulation, and Distribution—such wickless formations often imply:
- **Price Reversion Likelihood:** When a candle temporarily forms without a wick, it suggests the market may **revisit the opening price** to establish a wick before the candle closes.
- **Liquidity Manipulation:** The absence of a wick may indicate a **stop-hunt** or liquidity grab, where the price manipulates one side before reversing.
- **Entry Triggers:** Identifying these moments can help traders anticipate potential **retracements** or **continuations** within the PO3 framework.
Practical Application
- **Early Reversal Detection:** Spot potential price reversals by observing wickless candles forming at key levels.
- **Breakout Validation:** Use Vortex Candles to confirm **true breakouts** or **false moves** before the price returns.
- **Liquidity Zones:** Identify areas where the market is likely to revisit to create a wick, signaling entry/exit points.
This indicator is a powerful tool for traders applying **Po3** methodologies and seeking to capture price manipulation patterns.

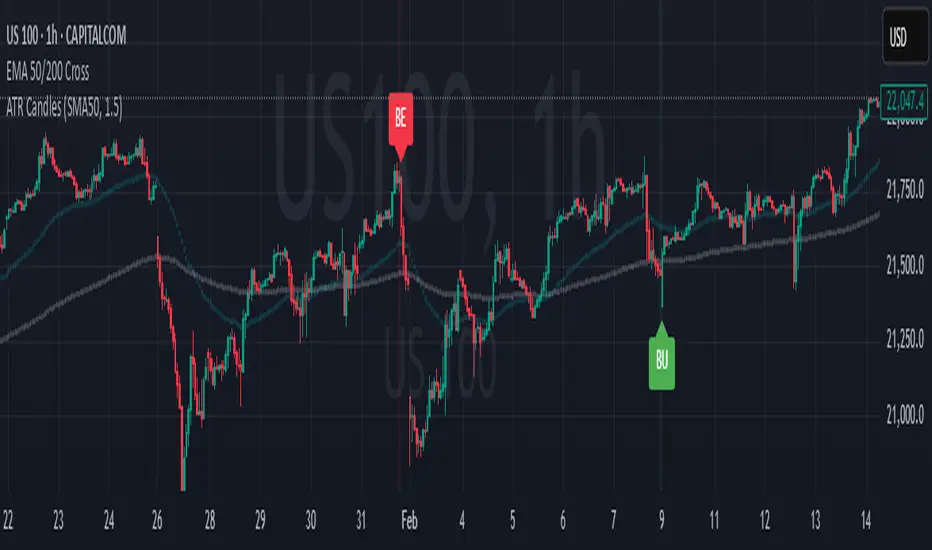
Engulfing Candles (ATR-Based)This indicator detects Engulfing Patterns with an ATR-based filtering mechanism and trend confirmation. Unlike a basic engulfing pattern indicator that only checks if a current candle engulfs the previous one, this script incorporates trend detection using either the 50-period SMA alone or a combination of 50 and 200-period SMAs to ensure that signals align with the broader trend. The indicator identifies Bullish Engulfing patterns when a strong bullish candle engulfs a smaller bearish candle in a downtrend and Bearish Engulfing patterns when a strong bearish candle engulfs a smaller bullish candle in an uptrend. It also generates alerts and visually marks these patterns with labels ("BU" for bullish and "BE" for bearish) while highlighting the background accordingly.
What sets this indicator apart from a normal engulfing indicator is its ATR-based filtering system, which ensures that only significant engulfing candles are considered. Instead of accepting any engulfing pattern, the script measures candle body size relative to 1.5x ATR (configurable) to filter out weak signals. It also differentiates between long-bodied and small-bodied candles to confirm that the engulfing pattern represents real momentum shifts. This approach reduces false signals caused by small, insignificant candles and ensures that traders focus on high-probability reversal patterns. By integrating trend-based filtering and ATR-based confirmation, this indicator provides more reliable and context-aware engulfing signals than a standard engulfing pattern detector.
Triangle Reversal IndicatorTriangle Reversal Indicator – A Visual Tool for Identifying Reversal Patterns
This indicator is designed to highlight potential trend reversal moments by comparing the current candle with the previous one. It offers a unique approach by focusing on distinct candle patterns rather than generic trend indicators, making it a valuable addition to your trading toolkit.
How It Works:
For a bullish signal, the indicator checks if:
The current candle is bullish (closing higher than it opens) while the previous candle was bearish.
The current candle’s low breaches the previous bearish candle’s low.
The current candle’s close is above the previous bearish candle’s close.
When these conditions are met, a tiny green triangle is plotted below the candle to signal a potential bullish reversal.
Conversely, for a bearish signal, it verifies if:
The current candle is bearish (closing lower than it opens) following a bullish candle.
The current candle’s high exceeds the previous bullish candle’s high.
The current candle’s close falls below the previous bullish candle’s close.
If all conditions are satisfied, a small red triangle appears above the candle to indicate a potential bearish reversal.
How to Use:
Simply apply the indicator on your chart and look for the tiny triangles that appear above or below the candles. These markers can serve as an additional visual cue when confirming entry or exit points, but it’s best used alongside your other analysis techniques.
Customization Options:
Users can further enhance the script by adding inputs for lookback periods, adjusting the triangle size, or modifying colors to match their chart themes.

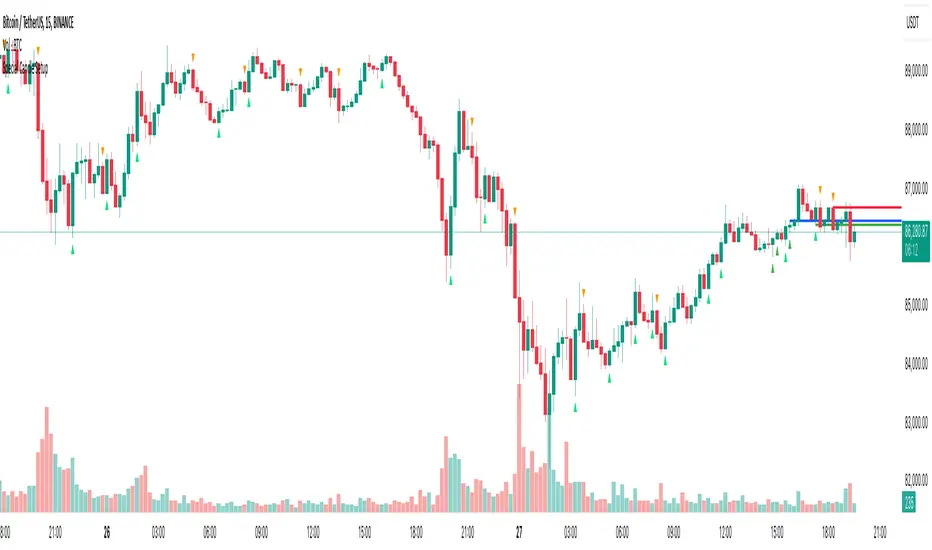
Engulfing Sweeps - Milana TradesEngulfing Sweeps
The Engulfing Sweeps Candle is a candlestick pattern that:
1)Takes liquidity from the previous candle’s high or low.
2)Fully engulfs previous candles upon closing.
3)Indicates strong buying or selling pressure.
4)Helps determine the bias of the next candle.
Logic Behind Engulfing Sweeps
If you analyze this candle on a lower timeframe, you’ll often see popular models like PO3 (Power of Three) or AMD (Accumulation – Manipulation – Distribution).
Once the candle closes, the goal is to enter a position on the retracement of the distribution phase.
How to Use Engulfing Sweeps?
Recommended Timeframes:
4H, Daily, Weekly – these levels hold significant liquidity.
Personally, I prefer 4H, as it provides a solid view of mid-term market moves.
Step1 - Identify Engulfing Sweep Candle
Step 2-Switch to a lower timeframe (15m or 5m).And you task identify optimal trade entry
Look for an entry pattern based on:
FVG (Fair Value Gap)
OB (Order Block)
FIB levels (0/0.25/0.5/ 0.75/ 1)
Wait for confirmation and take the trade.
Automating with TradingView Alerts
To avoid missing the pattern, you can set up alerts using a custom script. Once the pattern forms, TradingView will notify you so you can analyze the chart and take action. This approch helps me be more freedom

Volume Delta & Order Block Suite [QuantAlgo]Upgrade your volume analysis and order flow trading with Volume Delta & Order Block Suite by QuantAlgo, a sophisticated technical indicator that leverages advanced volume delta calculations, along with dynamic order block detection to provide deep insights into market participant behavior. By calculating the distribution of volume between buyers and sellers and tracking pivotal volume zones, the indicator helps traders understand the underlying forces driving price movements. It is particularly valuable for those looking to identify high-probability trading opportunities based on volume imbalances and key price levels where significant activity has occurred.
🟢 Technical Foundation
The Volume Delta & Order Block Suite utilizes sophisticated volume analysis techniques to estimate buying and selling pressure within each price candle. The core volume delta calculation employs a formula that estimates buy volume as: Volume × (Close - Low) ÷ (High - Low) , with sell volume calculated as the remainder of total volume. This approach assumes that when price closes near the high of a candle, most volume represents buying pressure, and when price closes near the low, most volume represents selling pressure.
For order block detection, the indicator implements a multi-step process involving volume pivot identification and price state tracking. It first detects significant volume pivot points using the ta.pivothigh function with a user-defined pivot period. It then tracks the market's order state based on whether the high exceeds the highest high or the low falls below the lowest low. When a volume pivot occurs, the indicator creates order blocks based on price levels at that pivot point. These blocks are continuously monitored for invalidation based on subsequent price action.
🟢 Key Features & Signals
1. Volume Delta Representation on Candles
The Volume Delta visualization on candles shows the buy/sell distribution directly on price bars, creating an immediate visual representation of volume pressure.
When buyers are dominant, candles are colored with the bullish theme color (default: green/teal).
Similarly, when sellers are dominant, candles are colored with the bearish theme color (default: red).
This visualization provides immediate insights into underlying volume pressure without requiring separate indicators, helping traders quickly identify which side of the market is in control.
2. Buy/Sell Pressure Information Table
The Volume Analysis Table provides a comprehensive breakdown of volume metrics across multiple timeframes, helping traders identify shifts in market behavior.
The table is organized into four timeframe columns:
Current Volume
1 Bar Before
1 Day Before
1 Week Before
For each timeframe, the table displays:
Buy volume: The estimated buying volume based on price action
Sell volume: The estimated selling volume based on price action
Total volume: The sum of buy and sell volume
Delta: The difference between buy and sell volume (positive when buyers are dominant, negative when sellers are dominant)
Additionally, the table shows both absolute values and percentage distributions, with trend indicators (Up, Down, or Neutral) at the bottom row of each timeframe column.
This multi-timeframe approach helps traders:
→ Identify volume imbalances between buyers and sellers
→ Track changes in volume delta across different periods
→ Compare current conditions with historical patterns
→ Detect potential reversals by watching for shifts in delta direction
The delta values are particularly useful as they provide a clear indication of market dominance – positive delta (Up) when buyers are dominant, and negative delta (Down) when sellers are dominant.
3. Order Blocks and Their Confluence
Order blocks represent significant price zones where volume pivots occur, potentially indicating areas of significant market participant activity.
The indicator identifies two types of order blocks:
Bullish Order Blocks (support): Highlighted with a green/teal color, these represent potential support areas where price might bounce when revisited
Bearish Order Blocks (resistance): Highlighted with a red color, these represent potential resistance areas where price might reverse when revisited
Each order block is visualized as a colored rectangle with a dashed line showing the average price within the block. The blocks are extended to the right until they are invalidated.
Order blocks can serve as key reference points for trading decisions, for example:
Support/resistance identification
Stop loss placement (beyond the opposite edge of the block)
Potential reversal zones
Target areas for profit-taking
When price approaches an order block, traders should look for confluence with the volume delta on candles and the information in the volume analysis table. Strong setups occur when all three components align – for example, when price approaches a bearish order block with increasing sell volume shown on the candles and in the volume table.
🟢 Practical Usage Tips
→ Volume Analysis and Interpretation: The indicator visualizes the buy/sell volume ratio directly on price candles using color intensity, allowing traders to immediately identify which side (buyers or sellers) is dominant. This information helps in assessing the strength behind price movements and potential continuation or reversal signals.
→ Order Block Trading Strategies: The indicator highlights significant price zones where volume pivots occur, marking these as potential support (bullish order blocks) or resistance (bearish order blocks). Traders can use these levels to identify potential reversal points, stop placement, and profit targets.
→ Multi-timeframe Volume Comparison: Through its comprehensive volume analysis table, the indicator enables traders to compare volume patterns across current, recent, daily, and weekly timeframes. This helps in identifying shifts in market behavior and confirming the strength of ongoing trends.
🟢 Pro Tips
Adjust Pivot Period based on your timeframe:
→ Lower values (3-5) for more frequent order blocks
→ Higher values (7-10) for stronger, less frequent order blocks
Fine-tune Mitigation Method based on your trading style:
→ "Wick" for more conservative invalidation
→ "Close" for more lenient order block survival
Look for confluence between components:
→ Strong volume delta in the expected direction when price touches an order block
→ Corresponding patterns in the volume analysis table
→ Overall market context aligning with the expected direction
Use for multiple trading approaches:
→ Support/resistance trading at order blocks
→ Trend confirmation with volume delta
→ Reversal detection when volume delta changes direction
→ Stop loss placement using order block boundaries
Combine with:
→ Trend analysis using trend-following indicators for trade confirmation
→ Multiple timeframe analysis for strategic context

Special Candle SetupThe Special Candle Setup Indicator is designed to detect significant bearish and bullish candlestick patterns , helping traders identify potential trend shifts and key price action setups . This indicator recognizes 8 bearish patterns and 6 bullish patterns , derived from multi-candlestick formations observed across different markets, including crypto, indices, forex, and stocks.
How It Works
This indicator scans the market for specific candlestick structures that indicate potential reversals or trend continuations . It includes:
• Bearish Patterns (8 types) : Identifies candlestick structures that suggest potential downside movement.
• Bullish Patterns (6 types) : Detects formations indicating upward momentum.
• Reversal Signals : Additional patterns that highlight key turning points in price action.
• Key Level Marking : Automatically draws support and resistance levels based on detected setups.
• Expiry Signals (Optional) : Highlights patterns commonly seen on expiry days in the Indian market, but these patterns are universally applicable to other asset classes as well.
Key Features
✔ Comprehensive Candlestick Pattern Recognition – Detects 14 key bullish and bearish formations.
✔ Reversal & Trend Continuation Setups – Helps identify both potential reversals and momentum-based entries.
✔ Automated Key Level Marking – Plots dynamic blue lines for key support and resistance zones.
✔ Customizable Pattern Selection – Allows users to enable/disable specific pattern types.
✔ Non-Repainting Signals – Ensures stability by maintaining signal integrity over time.
Customization Options
• Enable/Disable Specific Patterns – Users can disable main patterns or reversal patterns based on their preference, allowing them to focus on a single type of setup if needed.
• Key Level Customization – The blue lines represent critical price levels, drawn automatically based on identified patterns. These act as reference points for potential breakouts or reversals.
• Optional Expiry Signals – Includes patterns commonly observed on expiry days, primarily for the Indian market, but they also appear in global markets like crypto, forex, and indices.
How to Use
• Trend Trading – Use bullish and bearish patterns to identify entry points within an existing trend.
• Reversal Trading – Focus on reversal signals near key levels for potential market turnarounds.
• Key Level Validation – Utilize the blue lines to confirm important price zones.
• Customization – Tailor the indicator to your strategy by selecting only the patterns that align with your trading style.
Why This Combination?
This indicator blends multiple candlestick formations, ensuring a well-rounded approach to market analysis. The integration of expiry signals, reversal structures, and key level plotting makes it adaptable for various asset classes, not just expiry-based trading.
Why It’s Worth Using?
Manually spotting multiple candlestick setups can be time-consuming and subjective. This indicator automates the process, providing structured insights into market movements with clearly defined signals and key level plotting, making it valuable for traders across different markets.
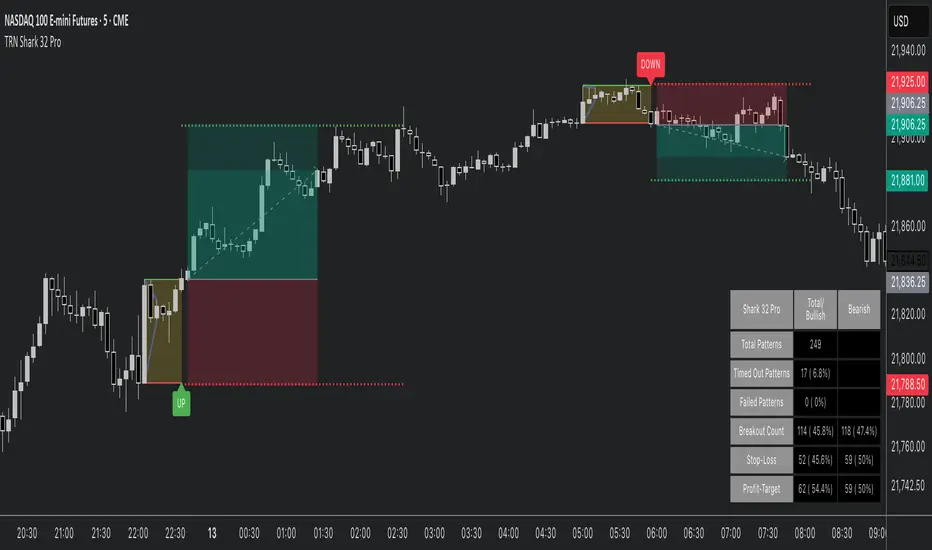
Shark 32 Pattern ProHello Traders!
The Shark32 pattern comprises multiple inside bars —each candle’s high/low is contained within the previous candle’s range—creating a tight consolidation zone. Once price breaks out, volatility frequently expands, producing sharper moves. The pattern is known for its relatively high continuation rate and the ability to offer tight risk/reward setups. It also calculates statistics, highlights stop/target levels, and offers fully customizable visuals so you can adapt the tool to your trading style.
Key Features :
Detects Shark 32 With Unlimited Inside Bars:
Automatically spots consecutive inside candles (not limited to just two), enabling you to catch more nuanced patterns.
Highlights Breakout:
Clear visual lines and labels mark where price breaks above/below the pattern boundary.
Stop-Loss & Profit Targets:
Draws a suggested stop-loss line and a projected target line, helping you manage risk and set profit objectives quickly.
Statistics & Analysis:
A built-in statistics table tracks pattern frequency, breakouts, stop-hits, target-hits, and more—helping you refine your strategy over time.
Fully Customizable Visuals:
Control line styles, colors, breakout labels, box fill, and more to fit your preference or chart theme.
Quick Resolutions:
This pattern forms fast and typically resolves within just a few bars, appealing to short-term traders.
Statistics at a Glance (based on Bulkowski's studies):
Continuation Bias : ~60% continuation bias.
Measured Move : 70%+ of bullish breakouts (in bull markets) reach the measured move.
Throwback : ~64% chance price retraces to the breakout level after an upside break.
Trend Alignment : Historically, success rates improve when trading in line with the larger trend.
How to Trade with This Indicator :
Identifying the Pattern : Wait till a Shark 32 pattern is formed.
Entry Rule : Enter on a confirmed close above the pattern high (for bullish) or below the pattern low (for bearish).
Stop Placement : Place stops a few ticks beyond the opposite side of the pattern. Tight ranges = small risk. Or use the mid-range of the pattern as a stop level.
Target Options : Aim for Risk/Reward Ratio of 2R or 3R to capture a strong follow-through. Alternatively, use the measured move of the first bar's height as a target.
Tips for Better Reliability:
Trend Alignment : Shark 32 breakouts usually work best in the direction of the broader market or trend.
Confirmation : Look for a significant volume increase at the breakout—helps filter out “fake” moves.
Throwback Awareness : ~64% of upside breakouts retest the pattern boundary; stay patient if you see a pullback.
Risk Management : Maintain tight stops and consider using alerts for activation/breakout signals.
Why This Indicator?
Clear Visuals : Highlights the pattern boundary, breakout lines, and potential stop/target levels.
Customizable : Lets you adjust line styles, risk parameters, alerts, and statistics display.
Statistical Edge : Built-in table aggregates pattern counts, success/failure rates, and average durations.
Final Thoughts:
This Shark 32 Pro indicator gives you a systematic way to spot—and trade—a compact yet powerful three-candle formation. Combine it with solid risk management and trend analysis for best results. Monitor volume and confirm breakouts with a candle close beyond the pattern’s range. While the pattern can fail, tight stops and clear targets help keep your trading efficient and disciplined.