Candles - The WhaleThe strategy is based on candle patterns, with confluence indicators. Note some of the candles are rare, they can be found only a specific timeframe, or within specific stocks.
The added patterns are as follows:
- Bullish Engulfing
It is formed by two candles, the second candlestick engulfing the first candlestick. The first candle is a bearish candle that indicates the continuation of the downtrend.
The second candlestick is a long bullish candle that completely engulfs the first candle and shows that the bulls are back in the market.
- Bullish Harami
It consists of two candlestick charts, the first candlestick being a tall bearish candle, and the second, being a small bullish candle which should be in the range of the first candlestick.
The first bearish candle shows the continuation of the bearish trend and the second candle shows that the bulls are back in the market.
- Piercing Line
Two candles from it, the first candle being a bearish candle which indicates the continuation of the downtrend.
The second candle is a bullish candle that opens the gap down but closes more than 50% of the real body of the previous candle, which shows that the bulls are back in the market and a bullish reversal is going to take place.
- Bullish Belt
A Bullish Belt Hold, known as “yorikiri” in Japanese, is a single Japanese candlestick pattern that suggests a possible reversal of the current downtrend.
- Bullish Kicker
A bullish kicker is a two candlestick pattern that’s usually formed after a significant downtrend, but could also appear after an uptrend.
- Abandoned Baby
The abandoned baby candlestick pattern is a three-bar reversal pattern. It is similar to the morning and evening star formations and is a very reliable reversal signal when it occurs after a sharp rise or drop.
- Homing Pigeon
The bullish homing pigeon is a two-candle bullish reversal pattern that occurs at the end of a bearish trend. Both candles are negative, but the second candle is confined within the range of the previous candle.
- Breakaway
Breakaway patterns are multi-candle formations found on Japanese candlestick charts that suggest a market reversal may be in the offing. An actual breakaway is a five candlestick formation that occurs in either an upward or downward trend.
- Concealing Baby Swallow
The Concealing Baby Swallow candlestick pattern is a four-candlestick pattern that can signal a bullish reversal price movement or a bearish continuation move, depending on where it occurs in the overall market structure. However, the pattern is quite rare, and you may not encounter it in your trading.
- Doji Dragonfly
A dragonfly doji can be an indicator of a reversal in price. When the price of a security has shown a downward trend, it might signal an upcoming price increase.
- Doji Gravestone
The Gravestone Doji forms when the price closes at relatively the same level where it opened, providing that the open coincides with the low or at least the two are very close
- Doji Star
Consists of a long bullish candle, followed by a Doji that gaps up, then a third bearish candle that gaps down and closes well within the body of the first candle. An Evening Doji Star is a three-candle bearish reversal pattern similar to the Evening Star.
- Kicker
A kicker pattern is a two-bar candlestick pattern that predicts a change in the direction of an asset's price trend. This pattern is characterized by a sharp reversal in price over the span of two candlesticks. Traders use it to determine which group of market participants is in control of the direction.
- Ladder Bottom
Is a five-candle bullish reversal pattern that occurs at the end of a bullish trend. The four first candles are bearish and followed by a positive candle that starts with a positive gap.
- MatHold
A bullish pattern begins with a large bullish candle followed by a gap higher and three smaller candles which move lower.
- Matching Low
A matching low is a bullish two-candle reversal pattern that forms in an ongoing downtrend. As to its appearance, a matching low consists of two candlesticks that are negative, but the close at or around the same price.
- Meeting Lines
Bullish meeting lines are a two-candle bullish reversal pattern that occurs in a downtrend and signals a reversal of the trend. The first candle of the bullish meeting lines is bearish, and followed by a positive candle that closes very near the close of the previous candle.
- Morning Doji Star
It is made of 3 candlesticks, the first being a bearish candle, the second, a Doji, and the third being a bullish candle.
The first candle shows the continuation of the downtrend. The second candle being a doji indicates indecision in the market. The third bullish candle shows that the bulls are back in the market and a reversal will take place. The second candle should be completely out of the real bodies of the first and third candles.
- Rising Three Method1
Rising three methods is a bullish continuation pattern that appears in an ongoing uptrend. The Rising three methods pattern consists of five candles. where the first and last candles are long and bullish, with three small bearish candles in between.
- Rising Three Method2
It is the same as "Rising Three Method1" but with a different calculation
- Upside Tasuki Gap1
Is a bullish continuation candlestick pattern that forms in an ongoing uptrend. It consists of three candles, where the two first are bullish with a positive gap in-between, and followed by a negative candle that closes in the gap formed between the first two candles.
- Upside Tasuki Gap2
It is the same as "Upside Tasuki Gap1" but with a different calculation
- Three Line Strike1
Is a four-candle bullish continuation candlestick pattern. It forms a bullish trend and is believed to signal the continuation of the bullish trend.
- Three Line Strike2
It is the same as "Three Line Strike2" but with a different calculation
The confluence indicators:
Movement Averages: multi options checks, you can select what to check to open a position, and the description of each open is in the strategy.
Volume Oscillator: positive signal if the volume is above zero.
EMA: positive signal if the candle source is above EMA.
VWAP: positive signal if the candle source is above VWAP.
BTC Trend: it is an equation to track the BTC price movement
The profit is based on TSL, while the stop loss is based on ATR, or lowest candle.
The recommended time frame is 4 hours.
Candlesticksignals

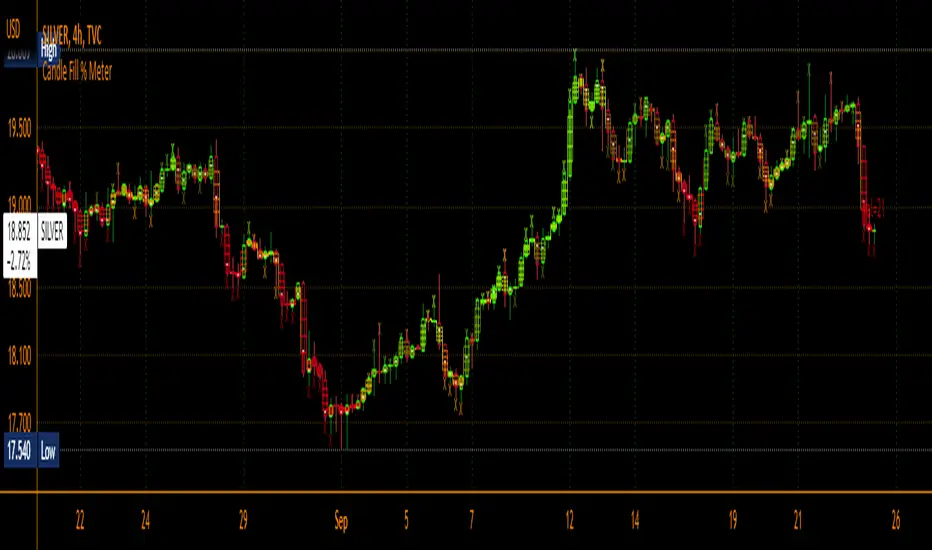
Candle Fill % MeterFor use with Hollow Candles
Fills Candles based on either the value of the RSI or coppock scaled to fit properly between the open and close. Makes for a compact visual with lot's of information given. Toggle bells and whistles in settings such as arrows to indicate the direction of the value being measured, dividing levels, fill from candle open all the time instead of the bottom up and more.
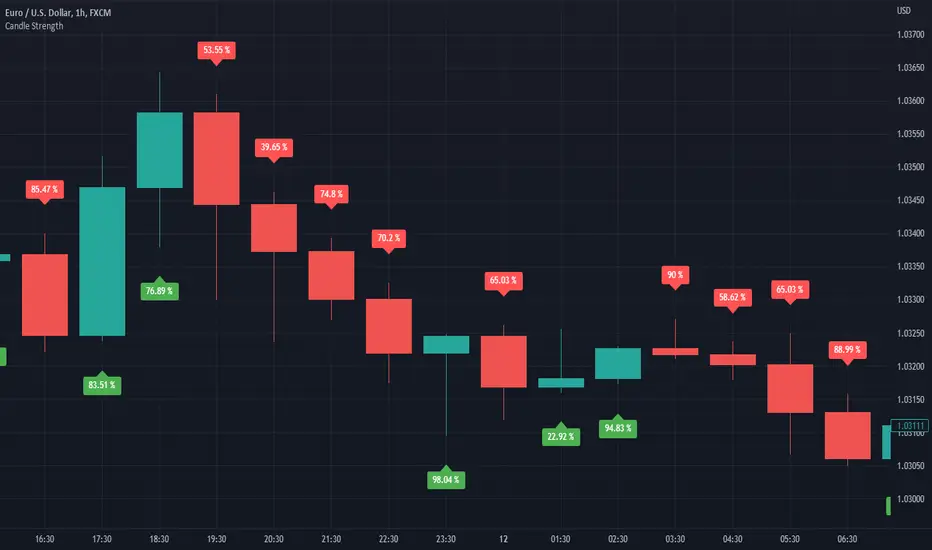
Candle StrengthIt is hard to know which party plays a vital role in the candle. Sometimes we see a red candle/ Seller's candle very weak, but still, the market continues. Here, I tried to figure out how much strength buyers/sellers possess in their respective candles.
The idea is simply to measure the area between high and low and then calculate the opposite party's oppression by calculating the wick's area.
This script is more like a tool, and hence I do not suggest using this as an independent strategy. However, combining it with other analyses and strategies will surely bear fruitful results.
I, in the future, will come up with strategies and more tools like this.
So, follow me to keep getting updates.
Thanks.
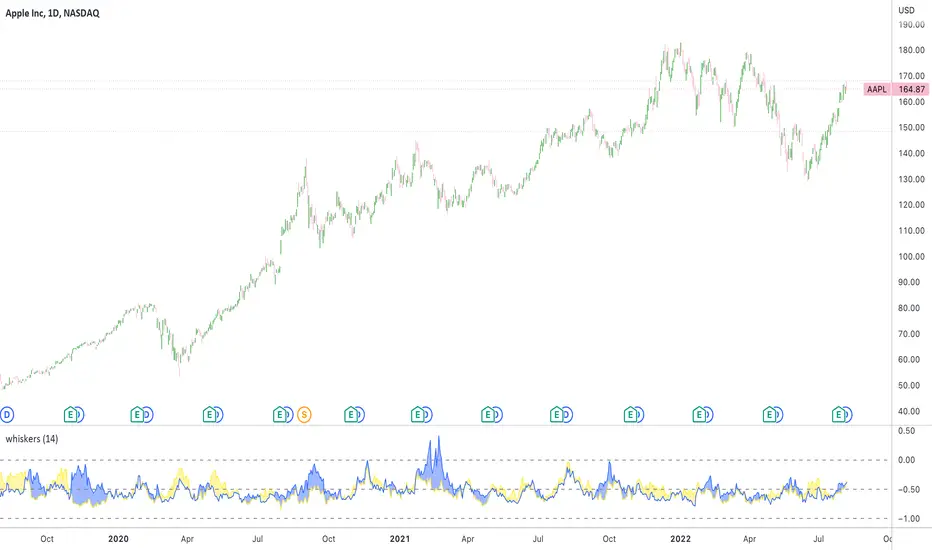
Whisker Reversal Oscillator [SpiritualHealer117]The Whisker Reversal Oscillator can be used to spot strength or weakness in trends. It is designed for stocks, commodities and forex trading, and is intended to be calculated from the high, close, low, and open over a given length.
Features:
The Whisker Reversal Oscillator shows the average length of the top and bottom whiskers on candlesticks over a defined length. It plots the percentage difference between the whiskers and the length of the body, with the yellow line representing the average length of the top whisker, and the bottom line indicating the average length of the bottom whisker.
Interpreting the signals:
The Whisker Reversal Oscillator is interpreted in the same way as a candlestick reversal pattern, where it being bullish or bearish depends on the trend. In a bull trend, if the yellow line passes above the blue line, it means the top whiskers are longer on average than the bottom whiskers, which may show that bulls were too weak to hold a rally, and signal a reversal. On the other hand, in a bear trend, if the yellow line is above the blue line, it indicates that the bulls were able to push the price up, which would be bullish. If the blue line crosses over the yellow line in an uptrend, it's often a bearish sign, but if it happens in a downtrend, its a bullish sign.
Generally speaking, a cross in the lines is indicative of a potential reversal, and when the lines cross over 1, it means that the whiskers were bigger than the candlestick bodies over your selected length, indicating that a big swing will come.
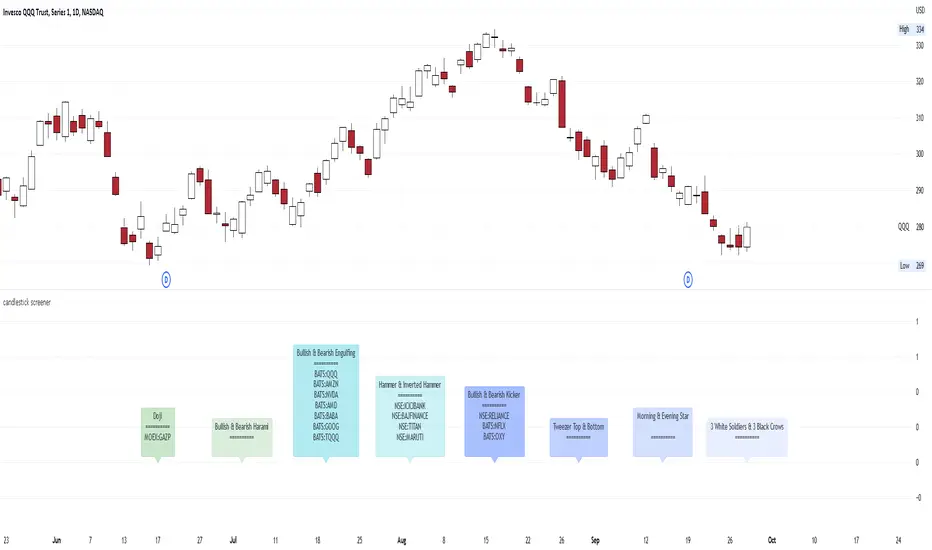
candlestick screenerhello traders..
I think it would be awesome if traders using a candlestick price action have a candlestick pattern screener.
so you just have to screen the securities, crypto, forex, commodities, spot the candlestick pattern easily and then you can set up trades..
This is a multi time frame candlestick screener, consist of:
1. Bullish & Bearish Kicker
2. Morning & Evening Star
3. Three White Soldiers & Three Black Crows
4. Tweezer Top & Bottom
5. Doji
6. Spinning Top & Bottom
7. Bullish & Bearish Harami
8. Bullish & Bearish Engulfing
9. Hanging Man & Shooting Star
10. Hammer & Inverted Hammer
the time frame of the screener, follows the Main Chart Time Frame;
- if your main chart in M5, then the result is in M5
- if your main chart in M15, then the result is in M15
- if your main chart in H1, then the result is in H1
- if your main chart in Daily, then the result is in Daily
- if your main chart in Weekly, then the result is in Weekly
- if your main chart in Monthly, then the result is in Monthly
Here are some the examples in multi time frame:
M5
M15
M30
H1
H4
Daily
Weekly
Monthly
Fake breakHi Traders,
I've developed an indicator which can detect fake-breaks on the chart.
In the following you'll find the definition of the fake break candles and also you will find how to recognize it on the chart with practical examples.
What is the fake break pattern?
Sometimes support and resistance lines broke with a full body and strong candles that gives us the idea of sharp movements on the chart but suddenly the next candle returns all the path of the previous candle. in this case we can say fake break is happening on the chart.
This indicator detect fake break patterns based on two criteria:
1. It uses AverageTrueRange indicator to measure the strength of the pattern.
2. The returning candle should engulf minimum 75% of the break candle.
This indicator plot 2 terms in the name of "FB-D" and "FB-U" that are abbreviations of the "Fake Break Down" and "Fake Break Up".
You can also set alerts to get notified when fake breakout happens on the chart.
Notice: This pattern is only acceptable in valid support and resistance zones and you can not rely on it everywhere on the chart (specially in the middle of the waves).
Notice: The source code of this indicator is open and you are allowed to use it on your scripts by mentioning the name of author.
Disclaimer: This is not a financial advice or any signal to buy or sell, the goal of developing such an indicator is to use for educational purposes.

((Bullish)) Candle below EMA Hello People of the Trading World...
Todays script is a basic concept of using Moving Averages and Candle Closes - this works best on Higher Timeframes and only in Bullish Conditions
"When the market is trending to the upside - we tend to see price overextend from the moving average and price revert back to the mean (Mean Reversion)"
You may ask why would you want this candle - this presents good opportunities in a trending market (NOT AN ENTRY CANDLE). This can be useful to get into existing trends which you may have missed
This candle will display when the candle close is below one of the below EMAS
9EMA
50EMA
100EMA
You can choose which one to show ie if the 21ema wasnt important but the 100ema was... turn off the 21ema and 50ema and this will display candle below the 100ema
This candle can be alerted in the settings so if price does close you wont miss it.
EXMAPLES:
If you find this script useful please leave a comment and a thumbs up :)

DirectionalBarBNBUSDTThe Indicator show Directional Bar inside a market context
You must first do analisys context and next you can use the directional candle
Show Candles:
B3: The price close lower than the before candle and your own third third
A1: The price close higher than the before candle and your own first third
RU: Candle of Rejection in trend up. The price open and close in the first third of the candle
RD: Candle of Rejection in trend down. The price open and close in the third third of the candle
IU: Inside Candle in trend up. The price is inside of the range of the before red candle
ID: Inside Candle in trend down. The price is inside of the range of the before green candle
EU: Engulgfing candle in trend up. The range of the candle is outside of the range f the before red candle
ED: Engulgfing candle in trend down. The range of the candle is outside of the range f the before green candle
SL-LONG: Stop Loss for long position in BNBUSDT market
ENTRY-LONG: entry for long position in BNBUSDT market
TP-LONG: Take Profit for long position if you need back de price to entry by the limit order in BNBUSDT market
TP-LONG-MARKET: Take Profit for long position by the market order in BNBUSDT market
SL-Short: Stop Loss for short position in BNBUSDT market
ENTRY-SHORT: entry for short position in BNBUSDT market
TP-SHORT: Take Profit for short position if you need back de price to entry by the limit order in BNBUSDT market
TP-SHORT-MARKET: Take Profit for short position by the market order in BNBUSDT market
The Risk Highest is 0.35% and the Take Profit Lowest is 0.5%

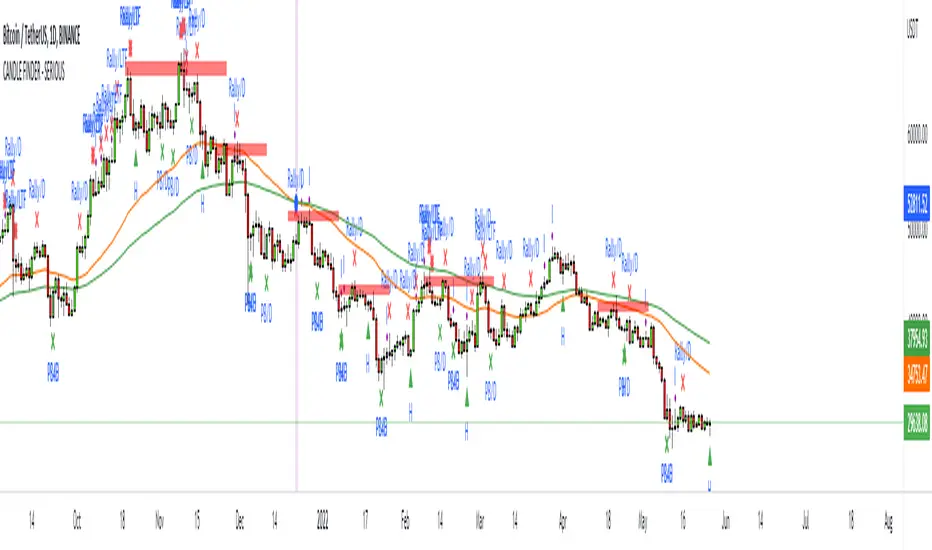
Intraday Candle Finder (Works on all Markets!!!) Todays scripts is for the INTRADAY Traders who would use a timeframe setup like (3m,5m,10,15m)
This script is a candle filter for Pulllbacks, Rally Candle, Hammers.
Ive added a new condition = RSI Overbought for the Rally Candle and Oversold for the Pullback to eliminate weak candles.
Also there is a ema filter if you want to only use the pullbacks above '50ema' etc...
Rules
1) Price action must be in place before we look for the signals
2) Trade in high probably areas such as Demand and Supply zones /// Support and Resistance zones
3) Dont trade Pullbacks when sentiment is Bearish
4) Dont trade Rallys when sentiment is Bullish
Pullback candle on INTRADAY TIMEFRAME
This was taken from ADA/USDT 31/05/2022 (Recent)
10M chart
Forex Example
Rally Candle on INTRADAY TIMEFRAME
This was taken from AXS/USDT 31/05/2022 (Recent)
Forex Example
How to trade this candles.
Stop loss = ATR *1 minimum
Take Profit = RR of either 4/5 when the market is trending // When the market is ranging - look to key levels for take profit
Im open to ideas to improve this script for the INTRADAY Traders as I'm more of a Swing Trader
If you enjoy this script please leave a like and comment as your support is much appreciated.

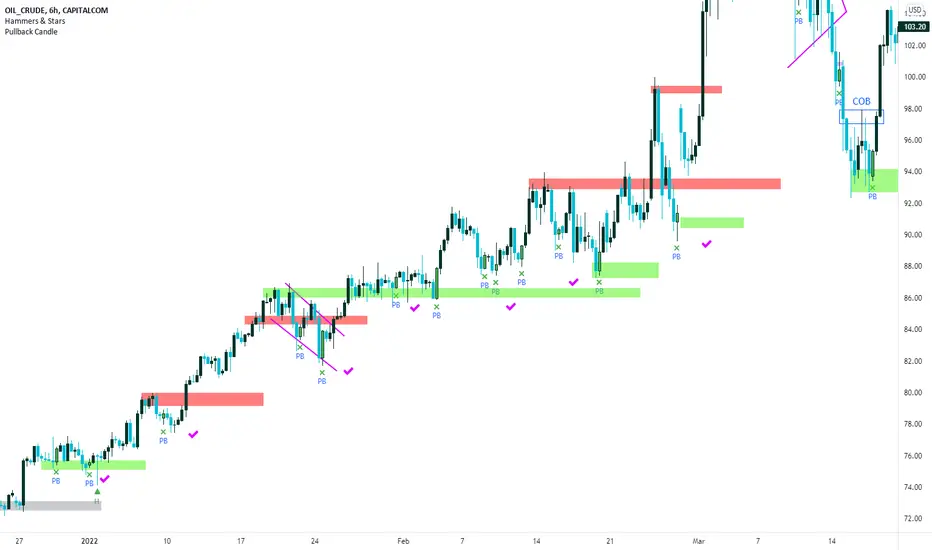
CANDLE FILTER Todays scripts is based on my Pullback And Rally Candles with other meaningful candles such as Hammers and Dojis.
You can choose which Candles to show on the cart and if you want to candles to appear above or below a moving average.
If you follow my work, you may recognise some of these candles which I'm about to show you however these candles are 1) more refined and 2) has moving average filters.
Ive included a D,6H,1H Candle in this script as on different timeframes - each swing low on average has a different amount of bars within the swing low / swing high so the DPB and RD will only work on the Daily
//Pullback candle
This candle is very powerful when used with simple Price Action such as Market Structure//Demand zones and support zones. (((((WORKS BEST IN UPTRENDS AND BOTTOM OF RANGES)))))
Ive included a D,6H,1H Pullback Candle in this script as on different timeframes - each swing low on average has a different amount of bars within the swing low so the DPB will only work on the Daily
//DAILY PULLBACK (Swing Traders)
snapshot
//4H PULLBACK (Swing Traders)
snapshot
- this signal will produce more signals due to the swing low filter on the 4H
//1H PULLBACK
snapshot
- this signal has been refined due to too many candle displaying in weak areas
!!!IF YOU DONT WANT TO USE PULLBACKS DURING DOWNTRENDS THEN USE THE EMA FILTER TO TURN OFF THE PULLBACKS WHEN PRICE IS BELOW THE MOVING AVERAGE!!!
//Rally candle (My personal Favourite) (((((WORKS BEST IN DOWNTRENDS AND TOP OF RANGES)))))
This candle is very powerful when used with simple Price Action such as Market Structure//Supply zones and Resistance zones.
//DAILY RALLY(Swing Traders)
snapshot
//4H RALLY(Swing Traders)
snapshot
- this signal will produce more signals due to the swing high filter on the 4H
!!!IF YOU DONT WANT TO USE RALLIES DURING UPTRENDSTHEN USE THE EMA FILTER TO TURN OFF THE RALLIES WHEN PRICE IS ABOVE THE MOVING AVERAGE!!!
//POWERFUL DOJIS (INDECISION)
snapshot
We look for indecision in key areas to see if momentum is shifting. When combined with Pullbacks or Rallys - this will enhance the odds of a probably area.
//HAMMERS
snapshot
//MOVING AVERAGES
snapshot
Short EMA = 50
Long EMA = 200
This filter can be used when the market is trending - look out for rejections off the moving averages
Also you can chance the Short And Long EMA to choose which MA cross you want to use
snapshot
ALSO ALL THE CANDLES HAVE A ALERT CONDITIONS WHICH YOU CAN ACCESS - THIS WILL ALERT ANY CANDLE YOU CHOOSE
Please leave a like/comment on this post as this is much appreciated....

Oxy CandlestickOxymoronic (oxy) candlesticks often appear at significant levels in a chart and can indicate increased probabilities of directional moves.
Typically, green candles are hollow and red candles are filled. An oxymoronic candle is colored bullishly but filled bearishly (solid green) or vice versa (hollow red).
Oxy flags occur when:
1) Price gaps up and closes lower than the open but above the last close. A solid green (or black) candle is bearish.
2) Price gaps down and closes higher than the open but below the last close. A hollow red candle is bullish.
An oxy candle indicates one of three things:
1) Price is going up (bullish oxy)
2) Price is going down (bearish oxy)
3) Price will return to this level (either)
#1 and #2 are the default meaning. If those don't play out then look for #3.
As is the case with most indicators, it is best not to use this indicator in isolation, but to combine it with other forms of analysis to increase your probabilities and to identify significant levels.

ULTIMATE CANDLESTICK FINDER (Pullback/Rallys/Hammers/Dojis) + MATodays scripts is based on my Pullback And Rally Candles with other meaningful candles such as Hammers and Dojis.
You can choose which Candles to show on the cart and if you want to candles to appear above or below a moving average.
If you follow my work, you may recognise some of these candles which I'm about to show you however these candles are 1) more refined and 2) has moving average filters.
Ive included a D,6H,1H Candle in this script as on different timeframes - each swing low on average has a different amount of bars within the swing low / swing high so the DPB and RD will only work on the Daily
//Pullback candle
This candle is very powerful when used with simple Price Action such as Market Structure//Demand zones and support zones. (((((WORKS BEST IN UPTRENDS AND BOTTOM OF RANGES)))))
Ive included a D,6H,1H Pullback Candle in this script as on different timeframes - each swing low on average has a different amount of bars within the swing low so the DPB will only work on the Daily
//DAILY PULLBACK (Swing Traders)
//4H PULLBACK (Swing Traders)
- this signal will produce more signals due to the swing low filter on the 4H
//1H PULLBACK
- this signal has been refined due to too many candle displaying in weak areas
!!!IF YOU DONT WANT TO USE PULLBACKS DURING DOWNTRENDS THEN USE THE EMA FILTER TO TURN OFF THE PULLBACKS WHEN PRICE IS BELOW THE MOVING AVERAGE!!!
//Rally candle (My personal Favourite) (((((WORKS BEST IN DOWNTRENDS AND TOP OF RANGES)))))
This candle is very powerful when used with simple Price Action such as Market Structure//Supply zones and Resistance zones.
//DAILY RALLY(Swing Traders)
//4H RALLY(Swing Traders)
- this signal will produce more signals due to the swing high filter on the 4H
!!!IF YOU DONT WANT TO USE RALLIES DURING UPTRENDSTHEN USE THE EMA FILTER TO TURN OFF THE RALLIES WHEN PRICE IS ABOVE THE MOVING AVERAGE!!!
//POWERFUL DOJIS (INDECISION)
We look for indecision in key areas to see if momentum is shifting. When combined with Pullbacks or Rallys - this will enhance the odds of a probably area.
//HAMMERS
//MOVING AVERAGES
Short EMA = 50
Long EMA = 200
This filter can be used when the market is trending - look out for rejections off the moving averages
Also you can chance the Short And Long EMA to choose which MA cross you want to use
ALSO ALL THE CANDLES HAVE A ALERT CONDITIONS WHICH YOU CAN ACCESS - THIS WILL ALERT ANY CANDLE YOU CHOOSE
Please leave a like/comment on this post as this is much appreciated....
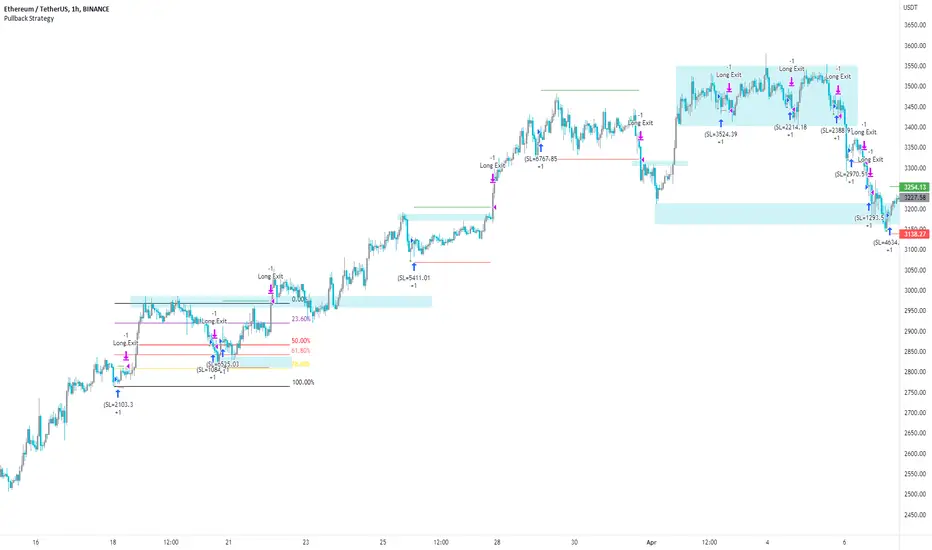
Pullback Strategy (Candle Analysis) New VersionFollowing on from the previous Pullback Candle which smashed over 100 likes - here we have the strategy behind the indicator.
Signal = Pullback Candle (This will alert on all timeframes and markets when selecting the Alert function for the Signal
Entry = When the Pullback Candle is confirmed ie 16:00 - the strategy will enter within the next two candles.
Stop loss = 0.25 ATR multiple which means we have a tighter stop loss - if greater than 1 then the stop loss will be more in percentages!!!
Take Profit = 1.5 Risk to Reward Model
Ema filter - There is a function to modify when looking into trades so as this is a bullish setup we want trades to be over the ema and using this filter will only show trades above the 200ema
Time filter - If you want to backtest Uptrends - locate the time of the start and the end of the uptrend - input this data into the settings and this will bring up the trades in that time period.
Most efficient to use this script is only in uptrends and this signal is a bullish signal - when using a ema filter we wont get trades under this so narrow down good trades for automation.
!!!!TO ENHANCE THE SYSTEM - USE TECHNICAL ANANLYSIS FOR CONFLUENCES
Most inefficient way to use the script is when price is in a downtrend and the win rate falls dramatically.
The pullback candle has a R-Expectancy of R5 so profits can be elongated when trading manually.
As the pullback candle occurs often in a trend we could pyramided trades to say have 5 trades in the same direction but the way i would trade this is to alert R1.5 then look to R2 and above to take profits manually.
(((P.S coders.... i need help to work on a profit extension code where exit long when price is below the 9ema (this seems simple but proving difficult) - this would be included onto the script if received.
Trend and Key Levels combined with Barcolor VTRENDThe Trend and Key Levels combined with Barcolor is designed to be used more on higher timeframes, 1 hour and above to show long term trend by volume weighted moving average. And allowing you to play entries off key levels. This script will not be useful on the daily or weekly timeframes if you are using the key levels.
This script changes barcolor eitherside of the volume weighted moving average to show bull or bear trend. You can see the price action at this timeframe of 1 hour, respects the volume weighted moving average as support and resistance.
The key levels to play off are the daily levels in orange, a close above results in a candle color of purple, a close below the daily open results in a candle color of maroon.
Included as levels, are the weekly, monthly and yearly.
Included are alerts for the candle color change for the daily alerts and change of trend green to red.
I hope you find this script useful!

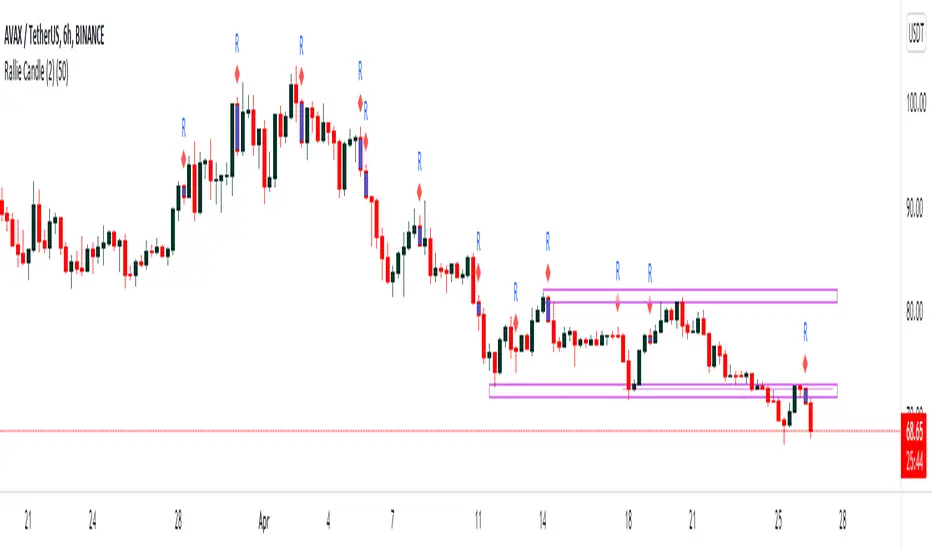
Rally HTF Candle (Candlestick Analysis) Guaranteed WinnersRally Candle will signal when price is at the end of a Rally to the upside and thus entering a balance phase in the market (works on all markets)
This candle works very efficient when the market is either trending downwards or in range markets where price is at resistance. (i would avoid in uptrends but depends on the trader)
Also we can expect this candle to form when price is overextended as the theory of this script is when there is a turning point in momentum - this candle will appear and we can look long from this signal.
This candle will only work in Swing High areas and appear when below an moving average which can be changed in the settings.
This candle will work only work pn the HTF as it provides very good rexpectancy whereas the LTF has a slightly less expectancy (i will be publishing an intraday Rally candle)
This candle can be alerted to signal the Rally Candle when the bar is confirmed and not during.
The way i trade this candle is
1) Candle signal must be in probably area to increase efficiency.
2) Enter on the second candle after candle IS CONFIRMED
3) Set stop loss below Rally Candle or use ATR value
4) Trade with the trend ie only Bearish price action
5) This candle can catch extreme points in the market ie this candle projected when ETH hit aths $4841
6) Trading with a confluence along with the Rally is better than solely trading this candle
Please leave a comment.
If we get to 100 likes i will publish the script.

Pullback Candles (Candlestick Analysis) Guaranteed Winners!!!!Pullback Candle will signal when price is at the end of a pullback and entering a balance phase in the market (works on all markets)
Also we can expect a Pullback Candle during flash crashes as the theory of this script is when there is a turning point in momentum - this candle will appear and we can look long from this signal.
This candle will only work in Swing Low areas and appear when below an moving average which can be changed in the settings.
This candle will work on all timeframes - HTF provided very good rexpectancy whereas the LTF has a slightly less expectancy.
This candle can be alerted to signal the Pullback Candle when the bar is confirmed and not during.
The way i trade this candle is
1) Candle signal must be in probably area to increase efficiency.
2) Enter on the second candle after candle IS CONFIRMED
3) Set stop loss below Pullback Candle or use ATR value
4) Trade with the trend ie only bullish price action
5) This candle can catch falling knifes - we had one on LUNA before the rally to $7.50
6) Trading with a confluence along with the Pullback is better than solely trading this candle
Please leave a comment.
If we get to 100 likes i will publish the script.
Have a good weekend :)
Rally Candle (End Game ) 26/04/2022 Few Months ago I started wanted to code a candle which alerts me when a Rally may be over in Bearish Conditions and today I have created a candle which is 1. subjective but more importantly appears in areas where buying pressure is at either a climax or in the process of a decline and this is where the Rally Candle signals. This shows momentum may be shifting and these can provide some good entries.
They will only working when price is below the 200ema and in overextended markets - VERY IMPORTANT!!!
Works on all timeframe with HTF providing more price percentage than LTF
They aren’t a specific candle size however they will repaint when we see 4 higher close candles followed by a candle which has closed lower than the previous 4th.
//Candle Conditions
This candle has to be in a swing high area to be valid and on 1H and 6H but the 1H will repaint a lot of candles so when we have a point system of +20 we can assume this setup is a good setup.
//Candle Operators
You can change the color of the bar to your liking
There is a ema filter so if you want to candle to not show candles of the 50ema this operator will do the command.
Please post requests and any potential implementations I could port to pine script.
Hope you Enjoy :)
Wick Pressure by SiddWolfMultiple Wicks forming at OverSold & OverBought levels create Buying and Selling Pressure. This Script tries to capture the essence of the buy and sell pressure created by those wicks. Wick pressure shows that the trend is Exhausted.
How it works:
This Wick Pressure Indicator checks for three candles forming the wicks in overbought and oversold zones. The zones are set by RSI and can be changed in settings. Those three candles should form a bit long wick and length of the wick is determined by ATR. The ATR multiple can be changed from settings. And then the script draws a box in the area formed by three candle wicks.
Confluence:
This indicator should not be used on its own. You should include it in your existing trading strategy. Any indicator should be rigorously tested before making any real trades.
Settings is the Key:
Settings are key to all of my indicators. Play around with it a bit. Change the ATR multiplier. Read the tooltips to understand what each settings mean. Tooltips are the (i) button in-front of each settings.
FAQs:
Q. Does the indicator Repaint ?
--- No. None of my indicators repaints. What you see now is what's drawn in real time.
Q. Indicator doesn't show anything ?
--- Maybe you've messed up the settings so reset it. or try different coin/stock.
Q. Does this indicator give financial advice?
--- No. Nope. Nein. Não. नहीं.
Conclusion:
This indicator is very basic but if used correctly it can be very powerful. Hit me up if you'd like to see the screener/scanner for this or any of my indicators. If you have any questions or suggestions feel free to comment below. I'd love to connect with you. Thank you.
~ SiddWolf

Volume Filtered *All Candlestick Patterns* [KT] Hello!
This script uses TradingView's *All Candlestick Patterns* indicator and includes a volume filter.
The frequency of each candlestick pattern is recorded in addition to the subsequent session's outcome - higher or lower close.
The requisite volume for the pattern is configurable; formations will not be distinguished when volume is less than the defined lower threshold.
For example, setting the volume threshold to 10% forces the script to identify candlestick patterns in which volume for the session (candle) is 10% greater than the volume moving average. All candlestick patterns with volume less than (1.10 * volume MA) are discounted.
The script counts the frequency of each pattern - the number of times the pattern occurred - in addition to the next candle's outcome.
Pertinent statistics are displayed in the table, which can be hidden.
I plan on working on the script quite a bit more; please comment a suggestion if you have one! What else should be included?

Candle relative powerThis indicator tries to measure the power of candle.
You can also integrate some candles to measure the power. The “Length” is for integrating candles. If the Length is equal 5, it means indicator calculate power of recent 5 candles.
The second editable factor in “Shadow index” which represent the power of shadows.
The last factor in Average Criteria which is the module of comparing the integrated candles to the past market moves.
This indicator do not supposed to create trading signals! But, you can see every time it breaks the static line it is a sign of bulls or bears power.
I personally use it as a candle power meter so I will evaluate the power of breakouts or trend continuations.

Candles Colored Green/Red According To Buy & Sell PressureCANDLES COLORED GREEN OR RED ACCORDING TO BUY & SELL PRESSURE
This indicator paints each candle green, red or blue depending on whether the buy/sell pressure for that candle is bullish, bearish or neutral.
***TURN OFF NORMAL CANDLE COLORS***
For this script to show properly on the chart, make sure you go to chart settings(gear icon in top right corner) and in the symbol tab, uncheck body, borders and wick.
***HOW TO USE***
When the directional movement index indicator shows more buying pressure than selling pressure, the candle will appear lime green. This indicates bullish buying pressure.
When the directional movement index indicator shows more selling pressure than buying pressure, the candle will appear red. This indicates bearish selling pressure.
When the directional movement index indicator shows the same amount of buy and sell pressure, the candle will appear blue. This indicates neutral buy/sell pressure.
Use the color changes to see if there is more buying or selling to pinpoint reversals and understand current market buying. Wait to enter or exit positions until the candles turn the opposite color.
***MARKETS***
This indicator can be used as a signal on all markets, including stocks, crypto, futures and forex.
***TIMEFRAMES***
This DMI color coded candlestick indicator can be used on all timeframes.
***TIPS***
Try using numerous indicators of ours on your chart so you can instantly see the bullish or bearish trend of multiple indicators in real time without having to analyze the data. Some of our favorites are our Auto Fibonacci, Directional Movement Index, Color Coded Buy & Sell Pressure Volume Profile, Auto Support And Resistance and Money Flow Index in combination with this Buy & Sell pressure Candle indicator.

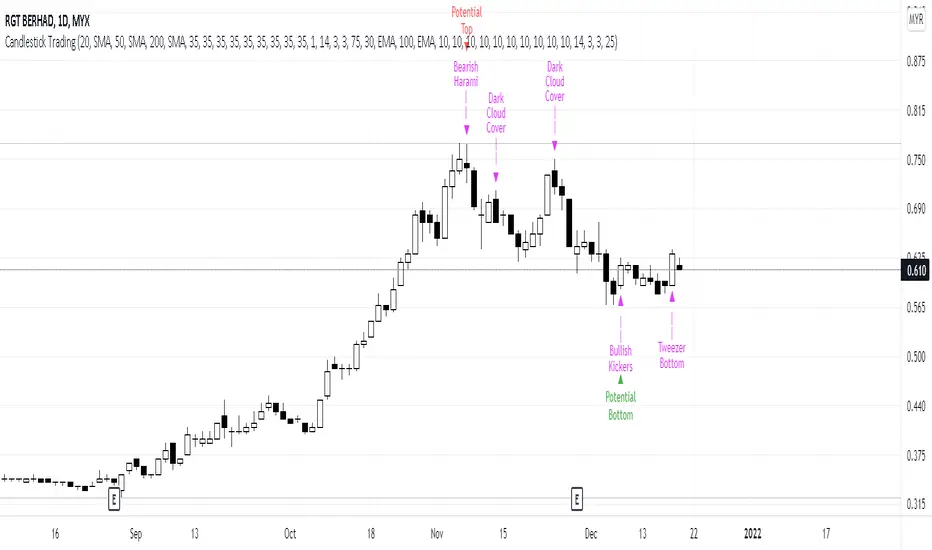
Candlestick Trading (Malaysia Stock Market)1. This indicator will indicate signals of bearish/bullish candlestick as below:
- 10 Bear Candles: Dark Cloud Cover, Bearish Kickers, Bearish Engulfing, Evening Star, Three Black Crows, Hanging Man, Shooting Star, Tweezer Top, Bearish Harami, Doji
- 10 Bull Candles: Piercing, Bullish Kickers, Bullish Engulfing, Morning Star, Three White Soldiers, Hammer, Inverted Hammer, Tweezer Bottom, Bearish Harami, Doji
2. In order for the Bear Candle signals to appear, these conditions should be met:
- Price must be above MA 1 (preset at SMA 20)
- Price must be above MA 2 (preset at SMA 50)
- Price must be above MA 3 (preset at SMA 200)
- In the range of specified trading days (preset at latest 10 days of trading)
3. For a strong bearish signal, a namely 'Potential Top' signal will appear on the top of the bearish candlestick signal. This 'Potential Top' signal will only appear under the condition of:
- Stochastic is at overbought area (preset at 75%)
4. In order for the Bull Candle signals to appear, these conditions should be met:
- Price must be in between MA 4 (preset at EMA 30) and MA 5 (preset at EMA 100)
- In the range of specified trading days (preset at latest 10 days of trading)
5. For a strong bullish signal, a namely 'Potential Bottom' signal will appear at the bottom of the bullish candlestick signal. This 'Potential Bottom' signal will only appear under the condition of:
- Stochastic is at oversold area (preset at 25%)
6. This indicator can help one to enter/exit a trade based on the bullish/bearish candlestick patterns that appear at the beginning/end of a trend, especially when the 'Potential Bottom/Top' appears with any of bullish/bearish candlestick signal.
7. However, this indicator is only designed for Malaysian Stocks Market as the script is based on the bids/pips calculation of the Malaysian Stocks Market. Nevertheless, I let the script open for everyone to modify it based on your own preference markets/instruments.
8. Hope you guys enjoy it. Thanks.
Alpha Candle Breakout Signal on Momentum from Support Resistance
Hello traders,
Let’s start with a brief description of what this strategy/indicator is and what it does and how we trade based on Alpha Candles.
The definition of an Alpha Candle is that it is mathematically calculated, and significantly bigger than the previous candles. This could be a green candle or a red candle, as long as the body is significantly bigger than the previous candles at the end of the calculation. All calculations are done in real time, we do NOT paint the candle sticks after the close of the candle and do not use offset values. This is extremely important. You will see the candle changing it's color as the body of the candle gets bigger with real time data feed. (Recalculate On Every Tick is ON by default). Now besides the mathematical calculations, an Alpha Candle also represents the emotion in the market for that stock in that moment. We can also say that an Alpha Candle is a change in the momentum.
Now that we’ve identified the Alpha candle, the second step is, to have a look at the chart and identify if the Alpha candle is breaking to a new high / low from a consolidation period, or from a good chart pattern (ascending / descending triangle , pennant , sideways consolidation) or a sudden direction change of the stock (bounce). Remember, the script will paint all Alpha candles regardless.
NVAX day trading example
Forex
Crypto
PLUG (Bounce example)
The script will identify the Alpha candles that are breaking to a new high / low from a user input look back period (default is 20 bars back, but this can be changed by the user input). An Alpha candle that breaks the look back period, will have a stop loss line below for Green Alpha or above for Red Alpha Candle and reward targets, like target1 or target2 (both are user input fields, can be adjusted to personal R values, default values are 2R and 3R)
A 2R means two times the reward (profit) of a 1-unit risk. If you are comfortable of loosing $50 per trade which will be considered 1-unit, then 2R means $100 reward (profit) target and a 3R is $150 reward (profit) target. Those R values will be plotted and/or labelled on the chart with dollar amounts if desired. You can change your R values from the user input area, even with decimal points, like 2.5R or 3.75R. If you shoot for at least 2R, you could be wrong 6 times out of 10, and still make 2R profit, as long as the other 4 trades give you a total of 8R. This is a basic trading concept. It will force the new traders to focus on risk/reward rather then a gambling attitude.
The script is meant to work with candle stick chart patterns only, it is NOT meant to work with ranges, line charts or point and figure charts. It will work with time frames like (seconds,1,2,3,5,10 minute or any minutes, daily, weekly). If you are trading IPOs , there might not be enough data for the script to do the calculation, so just be aware.
The script will identify the candles if they are Green Alpha (going up, bullish ) or Red Alpha (going down, bearish ). In order to see them clearly, we’ve greyed out the rest of the candles, and made Green Alpha candles white, and Red Alphas are left as red. You can change the colors from the user input area.
There is also a look back period, between 1-55 and the initial value is 20 for Green Alpha and 10 for Red Alpha. So, if the Alpha Candle breaks this look back period, it will be considered as an opportunity to take the trade. The code will put the stop loss area, possible target1 and target2 areas with a blue diamond and will draw the resistance/support lines for that Alpha candle. Depending on the individual’s risk tolerance, a label on the right side of the screen will show the risk tolerance (user input value) and the number of shares to be traded based on the risk tolerance (# of shares will be for the last Alpha Candle that is formed, it will constantly update itself with the new Alpha Candle)
For those who might be familiar with the three-bar play, we implemented something similar, so the code will find them in real time. Once an Alpha Candle is formed, if the following candle is a very small candle, also called pin bar , it will be painted to orange, so you can see it clearly. This pin bar is significantly smaller than the previous candles and formed right after an Alpha Candle.
Like anything in life, nothing is free. Meaning you have to work for it. So if you are looking to buy/sell blindly based on some indicators and signals, please do not consider this script. However, once you start using it, you will see how patterns repeat, when they repeat and how they repeat. It will identify the action, but you have to check the validity from the charts, so user discretionary is advised. As an example, if the Alpha candle is breaking from a consolidation period at $10. Let’s assume stop loss is at $9 so the 2R target will be $12, but if there is a possible resistance at $11, then the trader has to decide to take the trade for a possible 1R return, or skip the trade.
We try to approach the trading as a set of rules and processing the trades one by one, with a calculated risk and reward. This script will give you the Candle stick formation that is worth consideration and will draw the Stop Loss area (you can tweak this to your liking), will draw the 2-3R Targets, and will calculate the number of shares to be purchased based on the Risk Tolerance user entered in the user input area. The rest is to let the trade take care of it self.
Charts and patterns work better, when there is enough volume in a particular stock. If the stock is trading very low in volume , things will not work as expected. So, we must focus on the abnormal stocks, like gap gainers, volume gainer stocks, or heavily traded stocks (for intraday trading). For swing or long-term traders, one could look for a Green Alpha candle, assess the risk and possible return and trade the plan on a daily chart pattern (long term), or 15,30,60 min charts for swing trades.
If you are looking to short a stock, look for stocks that are weak (gap downs), so look for Red Alpha formations in that stock.
Once the back testing is turned on, code will generate buy/sell signals, otherwise it will work as an indicator. But please keep in mind….. For day trading, the stock has to be abnormally trading, so the chart patterns and the Alpha Candles work correctly. Volume has to be more than usual. It is the best way to have predictable results for day trading. If the volume of the stock is 2-5 times or more than the average of 20 days period (early in the morning), and even more later in the day, it is a good indication that the stock is trading on an abnormal volume with some news (pre-market abnormality is a good sign for possible abnormality for that stock).
For back testing, user can select from the user input area :
• Long or Short Trades or both or use the script as an indicator
• Close any open position if an Alpha candle forms in the opposite direction
• Pyramid the trades up to 4 levels (allow to buy/sell 4 times in the same direction every time another Alpha Candle forms)
• Breakout/breakdown look back period (every time an Alpha Candle forms and breaks this look back period, it will be a trade opportunity)
• Target Reward areas
• Stop Loss area
• Time frame (change the time frame and observe which time frame made good profit. Test the plan for future trades. Test it in as many abnormal stocks for the day they were behaving abnormal as possible). Time frame is not a user input field, just the time frame of the chart, 2,5,10 min, 1 hour etc.
• Selective date testing (between two dates/times). This is very important as most of the good opportunities comes from abnormal price action with volume . If you back test with the maximum amount of data for that abnormal stock on that day, it will produce unrealistic results, because the stock will have a normal course of trend before the news. Remember, we are looking for stocks that are trading abnormal in both price and volume or stocks like AAPL , TSLA which are trading heavily on each day. It is also a good way to learn, how and when to buy/sell, where to put stop losses by observing the chart with the Alpha Candles showing the results.
• All the above values will have an impact on the total profit / loss.
F (Ford Motors)
Now that we’ve covered what the script does, let’s plan the trade and trade the plan.
Side Note:
-------------
We started coding this as an indicator to show the Alpha Candles to find opportunities in the market. Later in the development, we implemented it as a Strategy, to be able to back test the ideas, to tweak some rules for entry/exit and see the effects on our profit/loss percentages in general. We kept the original idea being an Indicator, to show us the Alpha Candles in real time. This requires the option “Indicator Mode” is to be selected from the User Input area, and leaving the “Recalculate On Every Tick” is selected from the Properties tab of the strategy (as of Pine Script v5). Strategy is turning this “On” by default.
Disclaimer: This script is an educational and personal use only tool and should be used accordingly. User can not publish any images created with this code. Do your own due diligence, do not buy / sell stocks based on any indicator, always use stop losses. We do not make any promises as this indicator or any indicator will make you a profitable trader. Trading and technical analysis is difficult, it takes time to build confidence and experience. Study the charts and candlestick formations. Study support/resistance areas and how to identify them. This will help you to tweak the script’s stop loss areas and 2R-3R targets. Do not invest any money you are not comfortable loosing.
This is an invite only strategy. We will give ample time to test it out. After that you will need to subscribe. To get access to this strategy trader can send me an email from the links below.
All the Best
Happy Trading
