GoldHook Reversal ProGoldHook Reversal Pro v7 is an advanced market structure indicator designed to identify high-probability turning points. It automatically detects where price is accumulating—and monitors for specific momentum shifts that signal a valid Breakout or Reversal. By filtering out market noise with its "Smart Adaptive" logic, it helps traders distinguish between false moves and genuine trend opportunities, providing clear entry signals with built-in risk management targets.
Consolidation

Consolidation Chopper█ OVERVIEW
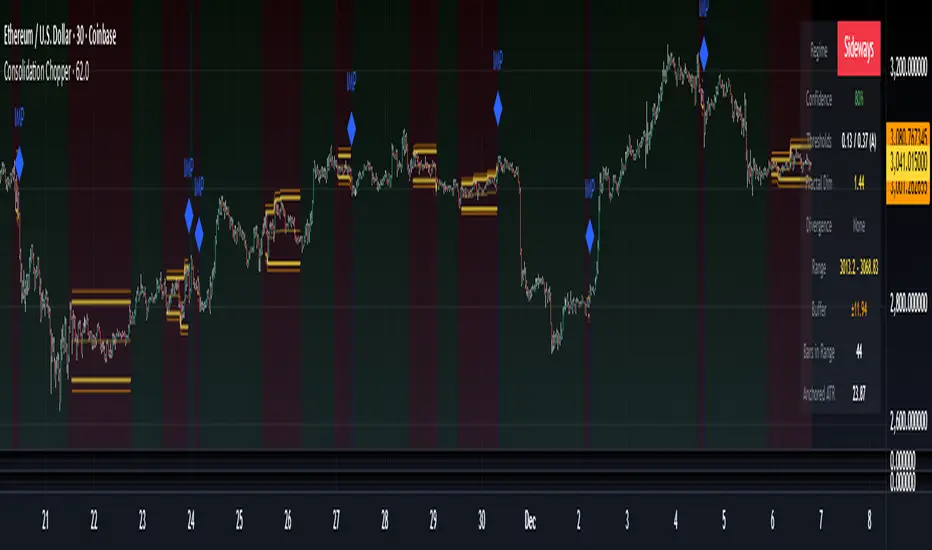
Consolidation Chopper is a regime detection indicator designed to identify whether the market is currently in a consolidation (sideways) phase or a trending phase. The indicator uses a proprietary multi-timeframe approach to analyze price action across different windows, providing a more robust classification than single-timeframe methods.
The indicator features an impulse override system that can detect sudden breakouts from consolidation ranges, allowing for faster regime transitions when significant price movement occurs.
█ FEATURES
Three-State Regime Detection
• Sideways — Market is consolidating with no clear directional bias
• Breakout — An impulse move has been detected, signaling a potential regime change
• Trending — Market is exhibiting directional movement
Adaptive Thresholds
The indicator can self-calibrate its detection thresholds based on the instrument's historical behavior, making it adaptable across different markets and asset classes without manual tuning.
Dynamic Range Tracking
During consolidation periods, the indicator tracks the evolving range boundaries:
• Yellow lines show the current range high and low
• Orange lines show the buffered boundaries used for impulse detection
• Range continuously updates as price action develops
Impulse Override System
Multiple configurable conditions can trigger an early exit from consolidation:
• Bar body relative to range size
• Bar range relative to volatility
• Close beyond buffered range boundaries
• Multi-bar cumulative movement
Each condition can be independently enabled or disabled.
Confirmation Layers
Optional confirmation metrics provide additional confidence scoring for the current regime classification. The info panel displays confidence percentage and confirmation status.
Cooldown System
Prevents rapid regime oscillation by enforcing a minimum duration after breakout events before allowing return to sideways classification.
█ HOW TO USE
1 — Add the indicator to your chart. The background color indicates the current regime.
2 — During sideways regimes, observe the yellow range lines to understand the current consolidation boundaries.
3 — Watch for IMP markers which indicate impulse-triggered breakouts.
4 — Use the info panel (top right) to monitor:
Current regime and confidence level
Range boundaries and buffer values
Cooldown status
5 — Adjust impulse detection parameters based on your instrument's volatility characteristics.
Higher values = fewer triggers (more conservative)
Lower values = more triggers (more sensitive)
█ SETTINGS
Threshold Settings
Control the sensitivity of regime classification. Adaptive mode auto-calibrates based on historical data tuned for your instrument.
Impulse Override
Configure which conditions trigger early breakout detection and their respective thresholds.
Multi-Bar Impulse
Settings for detecting breakouts that occur over multiple bars rather than a single impulse candle.
Range Tracking
Configure the establishment period and buffer zone for consolidation range detection.
Cooldown
Set the minimum bars required after a breakout before returning to sideways classification.
█ LIMITATIONS
• The indicator requires sufficient historical data to establish adaptive thresholds.
Initial bars may show less reliable classifications.
• Like all regime detection methods, there is going to be inherent lag in identifying transitions, but this method minimizes it.
The impulse override system helps mitigate this but cannot eliminate it entirely.
• Performance may vary across different timeframes and instruments.
Some parameter tuning is recommended for optimal results.
█ NOTES
This indicator is designed as a filter or context tool to be used alongside other analysis methods. It does not generate trade signals directly but provides market structure context that can inform trading decisions. Typically once a range breaks you can expect directional movement/impulses or higher volatility regimes.
The Consolidator [Pattern Foresight]Overview
This Consolidator script uses detection logic to chart bullish and bearish consolidation markers and to chart shaded high/low price range lines (with green shading between the bottom range line and the price for bullish trends and with red shading between the top range line and the price for bearish trends). A consolidation point is telling you: “Price has gone quiet here. Expect expansion—likely a breakout—once volume returns.” Low volatility squeezes often lead to a breakout.
The Consolidator attempts to identify periods where the price is moving sideways, compressing into a tighter range, forming a base or coil, or preparing for a trend continuation or reversal.
Bullish Consolidation Markers - Bullish consolidation occurs when the price is coiling but buyers are in control. These are useful to help detect bull flags, ascending triangles, tight bases before breakouts.
Bearish Consolidation Markers - These are useful to help detect bear flags, descending triangles, distribution periods.
Why this indicator is unique
The Consolidator attempts to be a predictive pattern-recognition system, not a simple channel indicator by measuring consolidation tightness and high/low price ranges. The range lines help visualize the “coil” where price is compressing. Consolidation markers classify which side of the coil price is leaning toward: bullish pressure or bearish pressure. The script attempts to detect structural bullish patterns with breakout intelligence.
Usage
Consolidation Lookback - Controls how many bars are examined when determining the consolidation “box.” Think of it as: “How wide of a window do you want to search for a sideways range?” Shorter lookback (10–20): Tighter, more sensitive consolidations, faster signals, more false positives, and useful for scalping and day trading. Longer lookback (30–60): Larger, more stable consolidation zones, fewer false positives, and better for swing trading.
Tolerance Percent - Defines how “flat” highs/lows must be to qualify as consolidation. This is the key part of compression detection. Lower tolerance (0.3–0.6%): Only very tight ranges qualify with fewer but higher-quality consolidation zones. Higher tolerance (0.7–1.5%): wider ranges and more consolidation signals. Small changes to tolerance drastically change the number of consolidation markers (higher = more consolidation markers).
Disclaimer:
This script is for informational purposes only. Nothing contained herein should be construed as financial, investment, or trading advice. The author is not a financial advisor and is not providing personalized recommendations. All trading involves risk, including the potential loss of principal. The author makes no assurances of accuracy, performance, or future results. History may not reflect future performance. You are solely responsible for your own investment decisions and agree to use this script entirely at your own risk.

Smart Range Breakout System (Zeiierman)█ Overview
Smart Range Breakout System (Zeiierman) is a full breakout–trend–risk framework engineered around volatility compression, adaptive range detection, and a volatility-adaptive structural mapping layer that continuously reshapes itself as price migrates away from compression zones. Rather than reacting to simple line breaks, the system identifies statistically quiet regimes, models the expansion phase as momentum re-enters the market, and then deploys a unified architecture of trend projection, dynamic trailing stops, and risk–reward structuring that evolves in real time with the unfolding move.
This tool is designed for traders who want a self-contained breakout workflow: first detect valid ranges, then trade the expansion, then manage the trend and exits via automatically generated levels and alerts.
⚪ Why This One Is Unique
The core engine combines a custom price-contraction model with volatility-responsive boundary levels to detect when the market is transitioning between quiet and active phases. From this model, the script generates a smoothed synthetic average that acts as the reference point for identifying compression zones and validating breakout conditions. Using this foundation, the system builds a complete visual trade map: breakout boxes that mark consolidation, breakout markers that signal expansion, a trend cloud that tracks directional bias, adaptive trailing stops that follow price movement, and optional risk-reward levels that automatically adjust to each new breakout.
Unlike conventional breakout indicators that rely on a single high/low lookback, this system uses:
A price contraction engine that re-weights candle structure through a momentum-like transform, generating a stabilized price that better captures compression and release.
An adaptive low-volatility counter that waits for statistically quiet behavior before declaring a range.
█ Main Features
⚪ Breakout Signals With Dynamic Risk-Reward Levels
The system identifies meaningful breakouts emerging from compressed price zones and immediately maps a complete trade structure around each signal.
Each breakout generates:
Directional breakout markers to confirm expansion
Entry, Stop, TP1, and TP2 levels that are automatically projected
A dynamic trailing stop is added to lock in profits as the price moves
Risk and reward zones visualized through adaptive fills
Labels that update in real time as targets are reached or invalidated
This creates a clear, self-contained decision map that helps traders evaluate opportunities, manage risk, and track the progression of each breakout without manual calculations.
⚪ Trend Cloud
A continuously updating Trend Cloud highlights the active directional regime and offers immediate visual trend identification through its color-coded bias. It shows whether a breakout aligns with the prevailing direction, provides a smoother and more stable representation of the trend than raw price alone, and creates an intuitive backdrop for distinguishing trend-following opportunities from countertrend setups. By filtering out noise and emphasizing directional stability, the cloud helps improve timing, signal quality, and overall alignment with the dominant market structure.
█ How to Use
⚪ Breakout Trading from Range Boxes
1. Identify Compression Zones
Look for periods where the Range Breakout Box appears: this signals a statistically quiet regime where price has compressed around a bounded range.
The box top and bottom approximate the upper and lower bounds of the market’s recent equilibrium.
2. Trade the Expansion
Bullish Breakout:
Triggered when the synthetic price crosses above the box top.
A green breakout marker appears below the price (triangle up).
This signals that price is breaking out of the compression zone with enough momentum to establish a meaningful structural move to the upside.
Bearish Breakout:
Triggered when the price crosses below the box bottom.
A red breakout marker appears above the price (triangle down).
Signals a breakdown out of the range to the downside.
⚪ Trend Following with the Trend Cloud
The Trend Cloud is a volatility-responsive band that adjusts to the system’s internal trend. In bullish conditions, it shifts to the up-color beneath price, and in bearish conditions, it flips to the down-color above price, giving a clear visual read of market direction.
The cloud effectively separates impulsive trend legs from noise, so you can align breakout trades only with the dominant directional regime.
Long Setups
Favor long setups (Break Up) when the price is traveling above or inside a bullish cloud.
Short Steups
Favor short setups (Break Down) when the price is below or inside a bearish cloud.
Ignore counter-trend breakouts that form directly against a strong, stable cloud unless you are intentionally trading mean reversion.
⚪ Breakout Management and Risk-Reward
Once a breakout occurs, the system instantly activates a directional trailing stop that follows the trend. For long setups, the stop stays below the price and moves upward as momentum builds. For short setups, it stays above the price and moves downward as the trend strengthens. If price hits the trailing stop, an X-cross appears on the chart to mark the exit, and the stop is reset for the next signal. You can adjust the sensitivity to make the stop tighter or more relaxed, depending on your preference.
When Risk-Reward Levels are enabled, the script also builds a complete trade structure around the breakout. It places an entry line at the breakout close, and projects two target levels forward. The area between entry and stop is shaded as risk, while the area toward the targets is shaded as reward. Labels update automatically as targets are reached, turning into a clear confirmation mark when a level is hit and signaling with an icon if the stop is touched.
Together, the trailing stop and risk-reward ladder create a clear, real-time map of each breakout’s progression, helping you manage risk, monitor targets, and follow the move with structure and confidence.
█ How It Works
⚪ Compression Detection & Range Formation
The system identifies quiet market phases where price contracts into narrow zones and stabilizes around a synthetic equilibrium level. These zones form the foundation for valid breakout opportunities.
Calculation: Persistence-based boundary tracking with volatility-normalized change detection and equilibrium anchoring to identify statistically constrained price regimes.
⚪ Breakout Engine
Breakouts occur only when the internal average breaks out of a validated compression zone, confirming that the market is transitioning from containment to expansion.
Calculation: Boundary-crossing logic on dispersion-expanded structures with directional state shifts encoded through threshold-gated transitions.
⚪ Trend State
A dynamic trend state guides directional bias, while the Trend Cloud visually expresses this bias directly on the chart, shifting beneath or above the price depending on the active regime.
Calculation: Dual-regime state modeling using filtered directional vectors, volatility-responsive offsets, and continuity enforcement to avoid noise-driven flips.
-----------------
Disclaimer
The content provided in my scripts, indicators, ideas, algorithms, and systems is for educational and informational purposes only. It does not constitute financial advice, investment recommendations, or a solicitation to buy or sell any financial instruments. I will not accept liability for any loss or damage, including without limitation any loss of profit, which may arise directly or indirectly from the use of or reliance on such information.
All investments involve risk, and the past performance of a security, industry, sector, market, financial product, trading strategy, backtest, or individual's trading does not guarantee future results or returns. Investors are fully responsible for any investment decisions they make. Such decisions should be based solely on an evaluation of their financial circumstances, investment objectives, risk tolerance, and liquidity needs.

Volume–Phase Analyzer ProVolume–Phase Analyzer Pro – Trend & Institutional Volume Phases
This indicator analyzes how volume behaves relative to price movement to detect whether the market is in Accumulation, Markup, Distribution, or Markdown — the same phases institutions track in professional trading.
Unlike regular volume/MA mashups, this tool combines:
• Institutional volume classification (HighVol Up/Down, LowVol, Confused Vol)
• Price–volume efficiency and wick dominance
• Multi-Timeframe directional filters
• Volatility compression signals using Bollinger Width
• Volume mapped directly into the price chart as candles
• Smart signal engine with cooldown (prevents repeated signal spam)
This helps reveal w hen Smart Money is accumulating, pushing trends, unloading positions, or flushing liquidity.
────────────────────────────────────
How It Works
1️⃣ Volume Strength vs Average Volume
Identifies whether a move is backed by genuine buying/selling power.
2️⃣ Wick & Body Analysis
Confirms whether volume produced meaningful directional pressure — not just noise.
3️⃣ Trend Alignment
Fast EMA vs Slow EMA ensures signals align with active trend.
4️⃣ Higher-Timeframe Confirmation
Confirms if current movement agrees with a larger directional bias.
5️⃣ Compression Detection
When price volatility contracts while high-volume bars appear → phase shift often ahead.
────────────────────────────────────
Signals
BUY → Confirmed bullish demand with trend backing
SELL → Confirmed bearish supply taking control
TRAP → Likely stop-hunt or absorption — often before reversal
Signals only appear when multiple institutional conditions align.
A cooldown prevents repetitive signals like BUY-BUY-BUY.
────────────────────────────────────
Background shading helps visually locate these phases.
Markup phase:
• Meaning: Buyers are in control and the market is trending up
• Background color: Light green
Markdown phase:
• Meaning: Sellers are in control and the market is trending down
• Background color: Light red
Accumulation phase:
• Meaning: Smart Money quietly buying near the bottom before an uptrend
• Background color: Teal (blue-green)
Distribution phase:
• Meaning: Smart Money quietly selling near the top before a downtrend
• Background color: Light orange/yellow
Consolidation phase:
• Meaning: Sideways movement with low conviction
• Background color: Very light grey
Transition phase:
• Meaning: Market has not picked a direction yet
• Background color: No shading (clear background)
⸻
Quick Usage Notes
• Best trades are Buy signals during Markup and Sell signals during Markdown
• Accumulation and Distribution often come before reversals
• Consolidation is a low-quality trading zone
────────────────────────────────────
How to Trade It
• Take BUY signals during Markup
• Take SELL signals during Markdown
• Expect reversals near Trap signals, especially when phase is changing
• Avoid over-trading Consolidation zones
• Volume candles below price reveal when momentum is increasing or fading
Best applied on 5m–1H for intraday and swing confirmation.
────────────────────────────────────
Why This Indicator Is Unique
• It uses p rice-volume efficiency , not standard lagging signals
• It detects S mart Money intent , not retail reactions
• It avoids spam signals using an internal cooldown logic
• It gives context, not just entries — via live market-phase analysis
This makes it a multi-purpose tool for trend trading, breakout trading, and reversal anticipation.
────────────────────────────────────
Alerts Included
• Buy/Sell/Trap Signals
• Phase Change Alerts
────────────────────────────────────
This is a free tool and meant for educational use only.
Always use proper risk management.
────────────────────────────────────

Weekly Zones +RSI ColorWeekly analysis of stocks, cryptos etc.
chart, you will see:
The Weekly levels (PWH, PWL, 4 quadrants).
The Weekly control zones (the red, green, or grey boxes).
The Weekly analysis in the table.
Your 1-Hour candles will be colored green (strong), red (weak), or grey (neutral) based on the 1-hour RSI.
This should give you a very effective trading system.

Consolidation Value Zones (Recio)Consolidation Value Zones introduces an original algorithm to identify consolidation ranges and locate areas of importance within them. This new method "looks" at the chart and draws zones based on price with the goal of producing actionable zones which appear natural, as if they were found through a human analysis.
> Consider the following...
The chart image above displays Bitcoin, at no specific date, for no specific reason. What I have done here is simply glanced at the chart for about 5 seconds, and circled a few areas which stood out as "obvious" consolidation. It does not take a savant to look at a chart and circle ranging price. However, what we have just done defies many common systems for identifying consolidation. We have located ranges of various zone lengths, as small as roughly 25 bars to as large as roughly 100 bars. Regardless of this, we still determined these zones with our eyes and brain in a few seconds, for some it's practically instant. The issue with us humans doing this, is that we are subjective. We did not really use any concrete rules to determine these areas with our eyes. So the problem becomes "How do we identify these zones in a way which seems natural to us with a repeatable system?" Because of this, my approach is simply a logical attempt to reverse engineer our human intuition.
> Consolidation Value Zones
The name of this indicator is generic. To dissect it, we are identifying consolidation ranges, then using a volume profile to determine the value zone within that range. The specific method used to identify these consolidation zones is something I've personally been referring to as the "skewer" method. Another name that may fit better is "Linear Range Alignment/Overlap".
Ultimately, the goal is to locate a single price level or range that overlaps many adjacent bars.
This should, in theory, return areas of visually obvious consolidation.
> The Skewer Method (Identification Method & Bar Gap Allowances)
One consistent concept across the different identification methods for determining consolidation is time. How long do we chop around before calling it consolidation? This is the "Identification Threshold". Once we have located a consolidation zone "this" wide, we will then consider it as consolidation.
In the chart image above, we are considering a six-bar consolidation formation. The figure on the left shows an example of a perfect raw bar overlap, we can see that the six bars all overlap at one price range. This is a perfect example of what we are looking to identify as consolidation. Unfortunately, if this was all we looked at, we would have a very scarce identification method.
For that reason, we have the example on the right, which shows the additional allowances for the identification of these ranges. At most, the example on the right shows a gapless three-bar overlap. However, if we allow the identification to bridge across the gaps, we are able to draw a zone directly through the center and still be within our parameters. This allowance is the "Bar Gap Allowance" and will determine the leniency of the identification.
Between our identification threshold and bar gap allowance, we can start to piece together how the script is "looking" at our chart.
> Detecting Consolidation (Live Detection)
To aid in transparency and user understanding, the live detection calculation can be seen on the chart as a box, skewering the recent historical bars with a number next to it, indicating the number of bars found as potential consolidation.
As we can see in the chart image above, the script, by default, is looking for a 15-bar consolidation, with a 5-bar gap allowance. In the image, the specific gap count is labeled, we can see the script scan backwards as far as it can before counting five gaps in the data. Once that occurs, the detection stops.
Notice how the zone found is a range, consisting of all price levels which meet the parameters. The lower level of the range only had two gaps, but the upper level reached five.
> Consolidation Range and Value Zones (Volume Profiles)
Once the script has identified the consolidation formation, it calculates a volume profile across the identified consolidation range. From this it calculates and draws the Point of Control (POC) and Value Area in addition to the full consolidation range.
Once we have our zones drawn, and understand what they identify, we can go one step further and apply concepts from volume profile trading.
Range High/Low: Displays the current extent of the identified consolidation.
Value High/Low: Shows the specific area within the consolidation where buyers and sellers found the most value.
POC: The single point, where the most volume was transacted during consolidation.
In a balanced market, we would anticipate price to rotate around POC, oscillating from Value High (VAH) to Value Low (VAL). In contrast, a market in motion moves directionally, building volume at new price levels as value, naturally the POC shifts with it.
> Zone Extensions
Unlike many other scripts, there is no mitigation logic at play here, since crossing a zone simply tells us "buyers and sellers are not currently active here", but it does not guarantee that value cannot return or react from previous areas of value.
Obviously the current zone will always be most relevant, but historical zones can retain relevance depending on the context of the market.
Remember: Each area of consolidation is an area where buyers and sellers were once facing off, resulting in price's consolidation. Amidst this, the value zone was the area of greatest agreement between the participants at that time. When moving outside of a range, we would typically look at historical value areas and price's interaction with them for further context.
Due to the ever changing market, there is no fixed extension lookback that will cover every scenario. By default, the Extension Lookback is "1", meaning the script will extend the most recent zone forward until a new zone is detected.
Note: For clarity, zone extensions are colored differently from core zones.
The following chart image shows a few examples of these unique interactions.
As seen in the chart image, looking to previous areas of value as well as POC can provide context in the form of acceptance or rejection at these levels, providing further insight into the auction for us to respond to.
The zones do contain logic to maintain a clean display. By default, the zones extend conditionally when price returns to the previous consolidation range. If desired, the zones can be extended regardless of price action; this can be toggled with the option "Regardless Extension Mode", as seen below.
> Hollow Candles & Zone Merging
When consolidation is identified, a hollow candle is drawn; these can be used to see exactly when each zone is identified. It is important to understand that consolidation zones stemming from the same origin are merged into one zone. This is a frequent occurrence when the consolidation threshold is passed, but the consolidation continues. For this reason you will often see multiple hollow candles in the later areas of the zones.
Similarly, zones from different origin points that overlap are also merged into one consolidation zone. This ensures that no core zones overlap.
Additionally, every time a zone is merged, a new volume profile for the area is calculated.
> Bar Gap Allowance Type (Technical Explanation)
The specific bar gap allowance value can be altered, but so can the type of allowance being used. While some analyses may benefit from counting the total amount of bar gaps within the consolidation, others may benefit from detecting based on consecutive bar gaps.
The chart image above displays the gap counts for each gap allowance type.
The total bar gap allowance type will count until the gap amount is reached, then terminate detection once the allowed number of gaps has been exceeded.
The consecutive bar gap allowance type resets its count once it finds a valid bar within range, by doing so, it only counts the bars that separate each island of in-range bars.
Both methods have merit.
> Implementation
This identification method has proven effective to identify consolidation across market types. As a result, there cannot be one configuration of settings to fit every application. Adapting the detection type and method for each trader's specific market conditions is highly recommended.
When determining parameters, it is helpful to consider time, as it plays a major role in the identification method.
On a 1D chart, the default threshold of 15 corresponds to 15 days, or about 3 weeks depending on the ticker. To identify periods of one-week consolidation, a threshold of 5 would be suitable. To detect perfect gapless weeks, a bar gap allowance of 0 could be used, as seen in the chart image below.
Additional Example:
In the chart image above, we see a 15-second forex chart over the span of a few hours. The detection parameters are set up to detect 15-minute consolidation with a 2-minute max dead zone (consecutive bar gap).
> Detection Source
By default, the script detects consolidation ranges using the full extent of candle wicks. While this is traditional, detection can also be done using only the candle bodies. These identifications are much more nuanced, detecting only from confirmed candle price action; they do not trigger at the same frequency as wick detection.
Optionally, a "Wick/Body Average" can be chosen as the source for detection; as the name implies, this uses the average value between the candle body and its respective wick.
> Additional Settings
The settings mentioned thus far serve as core parameters for identifying consolidation. The following parameters are simply included for the benefit of the advanced user. It is not recommended to adjust these settings under normal circumstances.
- Value Area Percent: Default = 68.26, while traditionally 70 for volume profiles, 68.26 is accurate to the values of a standard bell-curve distribution. The differences are minimal in application.
- VP Rows: Default = 99, Sets the number of rows to be used when calculating the Volume Profiles (VP); note that higher values will lead to a slower calculation. Max value: 999
> Final Notes
If you have made it this far, thank you for reading.
I hope you find value in this new consolidation identification system and understand the logic behind it.
That's it.
Skrip berbayar

Trend & Strength Detector TSDTrend Strength Detector (TSD)
*Objective Trend Quality Measurement for Educational Market Analysis*
Note: This mathematical framework is a proprietary quantitative model developed by Ario Pinelab, inspired by classical EMA, ADX, RSI and MACD principles, yet not documented in any public technical or academic publication.
## 🎯 Purpose & Design Philosophy
The ** Trend Strength Detector- TSD ** is an educational research tool that provides **quantitative measurement of trend quality** through two independent scoring systems (0-100 scale). It answers the analytical question: *"How strong and aligned is the current market trend environment?"*
This indicator is designed with a **modular, complementary approach** to work alongside various analysis methodologies, particularly pattern-based recognition systems.
## 🔗 Complementary Research Framework
### Designed to Work With Pattern Detection Systems
This indicator provides **environmental context measurement** that complements qualitative pattern recognition tools. It works particularly well alongside systems like:
- **RMBS Smart Detector - Multi-Factor Momentum System**
- Traditional chart pattern analyzers
- Any momentum-based pattern identification tools
🔍 **To find RMBS Smart Detector:**
- Search in TradingView Indicators Library: `" RMBS Smart Detector - Multi-Factor Momentum System"`
- Look for: *Multi-Factor Momentum System*
- By author: ` `
### Why This Complementary Approach?
**Trend Quality Measurement** (TSD - this tool) provides:
- ✅ Structural trend alignment (0-100 score)
- ✅ Momentum intensity levels (0-100 score)
- ✅ Environment classification (Strong/Moderate/Weak)
- 📌 **Answers:** *"HOW STRONG is the underlying trend environment?"*
### Educational Research Value
When used together in a research context, these tools enable systematic study of questions like:
- How do reversal patterns behave when Strength Score is above 70 vs below 30?
- Do continuation patterns in weakening environments (declining scores) show different characteristics?
- What is the correlation between high Alignment Scores and pattern "success rates"?
- Can environment classification help identify genuine trend initiation vs false starts?
⚠️ **Important Note:** Both tools are **independent and work standalone**. TSD provides value whether used alone or with other analysis methods. The relationship with RMBS (or any pattern tool) is **complementary for research purposes**, not dependent.
---
###Mathematical Foundation
##TSA Formula: scoring method developed by Ario
-Trend Model (0 – 100)
TAS = EMA Alignment (0–40) + Price Position (0–30) + Trend Consistency (0–30)
EMA Alignment checks EMA_fast vs EMA_slow vs EMA_trend structure.
Price Position evaluates if Close is above/below all EMAs.
Consistency = 3 × max(bullish,bearish bars within 10 candles).
-Strength Model (0 – 100)
Strength = ADX (0–50) + EMA Slope (0–25) + RSI (0–15) + MACD (0–10)
ADX measures trend energy; Slope shows EMA momentum %;
RSI assesses zone positioning; MACD confirms directional agreement.
Note: This formula represents a proprietary quantitative model by Ario_Pinelab, inspired by classical technical concepts but not published in any external reference.________________________________________
📊 Environment Classification
Based on Total Strength Score:
🟢 Strong Environment: Score ≥ 60
→ Well-defined momentum, clear directional bias
🟡 Moderate Environment: 40 ≤ Score < 60
→ Mixed signals, transitional conditions
🔴 Weak Environment: Score < 40
→ Ranging, choppy, low conviction movement
Color Coding:
• Green background: Strong (≥60)
• Yellow background: Moderate (40-59)
• Red background: Weak (<40)
________________________________________
📈 Visual Components
Main Chart Display
Score Labels (Top-Right Corner):
┌─────────────────────────────────┐
│ 📊 Alignment: 75 | Strength: 82 │
│ Environment: Strong 🟢 │
└─────────────────────────────────┘
Color-Coded Background:
• Environment strength visually indicated via background color
• Helps quick identification of market regime
• Customizable transparency (default: 90%)
Reference Lines:
• Dotted line at 60: Strong/Moderate threshold
• Dotted line at 40: Moderate/Weak threshold
• Mid-line at 50: Neutral reference
________________________________________
🔧 Customization Settings
Input Parameters
The best setting is the default mode.
🚫 Important Disclaimers & Limitations
What This Indicator IS:
✅ Educational measurement tool for trend quality research
✅ Quantitative assessment of current market environment
✅ Complementary analysis tool for pattern-based systems
✅ Historical data analyzer for systematic study
✅ Multi-factor scoring system based on technical calculations
What This Indicator IS NOT:
❌ NOT a trading system or signal generator
❌ NOT financial advice or trade recommendations
❌ NOT predictive of future price movements
❌ NOT a guarantee of pattern success/failure
❌ NOT a substitute for comprehensive risk management
________________________________________
Known Limitations
1. Lagging Nature:
⚠️ All components (EMA, ADX, RSI, MACD) are calculated
from historical price data
→ Scores reflect CURRENT and RECENT conditions
→ Cannot predict sudden reversals or black swan events
→ Trend measurements lag actual price turning points
2. Whipsaw Risk:
⚠️ In choppy/ranging markets, scores may fluctuate rapidly
→ Moderate zone (40-60) can see frequent transitions
→ Low timeframes more susceptible to noise
→ Consider higher timeframes for stable measurements
3. Component Conflicts:
⚠️ Individual components may disagree
→ Example: Strong ADX but weak RSI alignment
→ Scores average these conflicts (may hide nuance)
→ Check individual components for deeper insight
4. Not Predictive:
⚠️ High scores do NOT guarantee continuation
⚠️ Low scores do NOT guarantee reversal
→ Measurement ≠ Prediction
→ Use for CONTEXT, not SIGNALS
→ Combine with comprehensive analysis
________________________________________
Risk Acknowledgments
Market Risk:
• All trading involves substantial risk of loss
• Past performance (even systematic studies) does not guarantee future results
• No indicator, system, or methodology can eliminate market risk
Measurement Limitations:
• Scores are mathematical calculations, not market predictions
• Environmental classification is descriptive, not prescriptive
• Strong measurements can deteriorate rapidly without warning
Educational Purpose:
• This tool is designed for LEARNING about market structure
• Not designed, tested, or validated as a standalone trading system
• Any trading decisions are user’s sole responsibility
No Warranty:
• Indicator provided “as-is” for educational purposes
• No guarantee of accuracy, reliability, or profitability
• Users must verify calculations and apply critical thinking
Open Source
Full Pine Script code available for educational study and modification. Feedback and improvement suggestions welcome.
“All logic is presented for research and educational visualization.”
---

Smart Inside Bar Zones by Dinkan🔹 How It Works
An Inside Bar is formed when a candle’s high and low are completely within the previous candle’s range.
The indicator detects this structure in real time, creates a visual box around it, and extends the zone until the pattern is broken.
Inside Bar candles can be optionally highlighted with a custom color to make them stand out clearly on the chart.
🔹 Features
✅ Automatic Inside Bar detection
✅ Dynamic Inside Bar zone boxes with custom fill & border color
✅ Inside candle body highlighting with user-defined color
✅ Adjustable transparency and border style
✅ Option to display only the latest Inside Bar zone for cleaner charts
🔹 Usage
Traders can use Inside Bar zones to:
Study price compression and breakout regions
Observe range behavior and trend continuation setups
Combine with other tools like volume or support/resistance analysis
🔹 Customization
Change box fill and border color
Adjust Inside Candle color for better visibility
Set transparency and choose whether to show all or only the latest box
⚠️ Disclaimer
This script is intended for market structure visualization and educational purposes only.
It does not generate trading signals or financial advice.
Always perform your own analysis and risk management before making trading decisions.

Smart Money Price Action ProSmart Money Price Action Pro - Smart Money and Price Action Dynamic Toolkit
The Smart Money Price Action Pro is designed to bring together multiple layers of market analysis into a single, cohesive framework, combining trend identification and consolidation detection in an actionable format. While individual indicators can provide useful insights, they often work in isolation. This toolkit integrates market flow detection, range analytics, and adaptive visualization into one system, allowing traders to see the bigger picture without piecing together multiple disconnected tools.
Building on principles from institutional trading behaviors, the toolkit gives traders a clearer picture of where “smart money” may be entering or exiting the market. Its design emphasizes confluence: signals from multiple independent modules overlap to create higher conviction setups, offering a structured edge when planning entries, exits, and risk levels.
At its core, the toolkit addresses the duality of market conditions: trending versus ranging. By offering a combination of trend-following signals and contrarian insights, it helps traders operate with a deeper understanding of market structure. While it provides actionable signals and visual guidance, it is intended as an assistive system, helping traders make more informed decisions rather than serving as a single source of truth.
Key Modules
1. Smart Money Signal Module
The Smart Money Signal Module identifies potential institutional activity by analyzing price swings and momentum shifts. Using configurable swing detection, it highlights potential reversal or continuation zones, expressed as adaptive zones around key market levels.
Signals are augmented with trend-colored candle overlays, offering immediate guidance on market bias. Bullish and bearish zones are clearly marked, while continuation and reversal markers help distinguish between trend shifts and market noise.
At its core, the engine applies swing detection combined with a sensitivity filter to track directional momentum across recent bars. This allows it to pinpoint bullish pivots (where downside momentum fades and strength returns) and bearish pivots (where upside momentum collapses). Once a pivot is confirmed, the system draws flow lines that map the breakout and classify it as either continuation or reversal, depending on broader market bias.
Momentum zones are then plotted to show areas where buyers stepped in with strength or sellers forced price lower. These levels extend forward dynamically, shifting in real time as new data forms. Zones change color the moment they break, visually confirming whether market structure has held or failed. Gradient shading highlights periods of extreme pressure, giving traders a clear visual of when momentum surges into overbought or oversold territory.
Instead of simply showing trend direction, this module also maps accumulation and distribution zones tied to institutional flows. When combined with the Range Module, these zones become more meaningful — for example, when institutional accumulation aligns with a breakout from consolidation.
Practical Use: Traders can use these signals to align trades with institutional flows. For example, entering a long position near a bullish accumulation zone or managing risk when bearish distribution areas form. By combining these insights with higher timeframe analysis, traders can filter out false signals and improve decision-making.
2. Range Detection Module
The Range Detection engine continuously monitors price action to flag when markets transition into consolidation phases. Ranges are defined not just by flat price action, but by a measurable contraction in volatility, repeated touches of boundary levels, and the clustering of traded volume around a central equilibrium point.
Once a valid range is identified, the system assigns a compression strength score (0–100). This score reflects how cleanly defined and structurally sound the consolidation is—higher scores indicate tighter boundaries and stronger evidence of accumulation or distribution.
Breakout tendencies are modeled dynamically. The system updates a forward-looking bias by incorporating:
Boundary time distribution – how often price presses against upper vs. lower edges
Historical breakout patterns – probability benchmarks derived from structurally similar ranges
Volume skew – whether traded volume leans toward buyers or sellers inside the range
Momentum alignment – auxiliary filters such as slope-based oscillators that indicate when energy is building for a directional move
The result is a live breakout forecast that evolves bar by bar as the range matures. Each active range carries a visual strength meter plotted above the consolidation zone, quantifying both compression and breakout potential in real time.
The module also supports range memory, preserving completed consolidations even after a breakout. This allows traders to review the prior structure for post-analysis or to track whether price respects the boundaries of the old range as support or resistance going forward.
Practical Use : Traders can use these ranges to anticipate breakout direction or step aside when conditions are unclear. A tight consolidation near a bullish zone, for instance, often signals a potential long opportunity, while overlapping bearish flows warn of false breakouts.
Integrated Workflow
The strength of the toolkit lies in its synergy. Each module is effective on its own, but the real advantage comes when their signals align.
A typical workflow may include:
Assessing the market trend using the Smart Money Signal Module and its trend-colored overlays
Identifying consolidation and breakout zones with the Range Detection Module
Watching for confluences: institutional accumulation aligning with range compression, or dashboard bias matching local setups
Executing trades with structured confidence, using these layered confirmations rather than relying on a single trigger
This integrated workflow streamlines decision-making and avoids the conflicting signals that can occur when combining unrelated indicators.
Additional Features
Adaptive Visualization : Dynamic zones and trend overlays adjust to volatility, keeping charts clear and focused
Analytics Dashboard : A compact summary panel shows active zones, bullish vs bearish flow counts, and current bias, giving context at a glance
Instead of simply adding more signals, the dashboard provides a meta-layer of analysis — context, bias, and flow strength — helping traders manage risk and stay aligned with broader market conditions.
Use Cases
Trend Confluence : Entering trades in line with prevailing smart money flows while filtering out counter-trend setups
Breakout Trading : Using the Range Detection Module to anticipate breakout zones and confirming direction with institutional flow signals
Contrarian Reversal Trades : Targeting accumulation/distribution zones where both modules indicate potential reversals
Each use case demonstrates how layered confluence creates clarity and conviction, making the toolkit a strong complement to other forms of technical analysis.
Conclusion
The Smart Money Signals Toolkit simplifies complex market analysis into actionable, visually intuitive insights. While standalone indicators provide value, this toolkit goes further by combining smart money flows, range detection, adaptive zones, and dashboard analytics into one cohesive system.
It doesn’t just generate buy/sell markers — it shows why a setup matters, where it is occurring, and how it aligns with broader conditions. This allows traders to operate with greater clarity, structure, and discipline.
Risk Disclaimer : This toolkit and its features are for educational and informational purposes only. Past performance does not guarantee future results. All suggested use cases are theoretical and should be applied with proper risk management.

Advanced Range Analyzer ProAdvanced Range Analyzer Pro – Adaptive Range Detection & Breakout Forecasting
Overview
Advanced Range Analyzer Pro is a comprehensive trading tool designed to help traders identify consolidations, evaluate their strength, and forecast potential breakout direction. By combining volatility-adjusted thresholds, volume distribution analysis, and historical breakout behavior, the indicator builds an adaptive framework for navigating sideways price action. Instead of treating ranges as noise, this system transforms them into opportunities for mean reversion or breakout trading.
How It Works
The indicator continuously scans price action to identify active range environments. Ranges are defined by volatility compression, repeated boundary interactions, and clustering of volume near equilibrium. Once detected, the indicator assigns a strength score (0–100), which quantifies how well-defined and compressed the consolidation is.
Breakout probabilities are then calculated by factoring in:
Relative time spent near the upper vs. lower range boundaries
Historical breakout tendencies for similar structures
Volume distribution inside the range
Momentum alignment using auxiliary filters (RSI/MACD)
This creates a live probability forecast that updates as price evolves. The tool also supports range memory, allowing traders to analyze the last completed range after a breakout has occurred. A dynamic strength meter is displayed directly above each consolidation range, providing real-time insight into range compression and breakout potential.
Signals and Breakouts
Advanced Range Analyzer Pro includes a structured set of visual tools to highlight actionable conditions:
Range Zones – Gradient-filled boxes highlight active consolidations.
Strength Meter – A live score displayed in the dashboard quantifies compression.
Breakout Labels – Probability percentages show bias toward bullish or bearish continuation.
Breakout Highlights – When a breakout occurs, the range is marked with directional confirmation.
Dashboard Table – Displays current status, strength, live/last range mode, and probabilities.
These elements update in real time, ensuring that traders always see the current state of consolidation and breakout risk.
Interpretation
Range Strength : High scores (70–100) indicate strong consolidations likely to resolve explosively, while low scores suggest weak or choppy ranges prone to false signals.
Breakout Probability : Directional bias greater than 60% suggests meaningful breakout pressure. Equal probabilities indicate balanced compression, favoring mean-reversion strategies.
Market Context : Ranges aligned with higher timeframe trends often resolve in the dominant direction, while counter-trend ranges may lead to reversals or liquidity sweeps.
Volatility Insight : Tight ranges with low ATR imply imminent expansion; wide ranges signal extended consolidation or distribution phases.
Strategy Integration
Advanced Range Analyzer Pro can be applied across multiple trading styles:
Breakout Trading : Enter on probability shifts above 60% with confirmation of volume or momentum.
Mean Reversion : Trade inside ranges with high strength scores by fading boundaries and targeting equilibrium.
Trend Continuation : Focus on ranges that form mid-trend, anticipating continuation after consolidation.
Liquidity Sweeps : Use failed breakouts at boundaries to capture reversals.
Multi-Timeframe : Apply on higher timeframes to frame market context, then execute on lower timeframes.
Advanced Techniques
Combine with volume profiles to identify areas of institutional positioning within ranges.
Track sequences of strong consolidations for trend development or exhaustion signals.
Use breakout probability shifts in conjunction with order flow or momentum indicators to refine entries.
Monitor expanding/contracting range widths to anticipate volatility cycles.
Custom parameters allow fine-tuning sensitivity for different assets (crypto, forex, equities) and trading styles (scalping, intraday, swing).
Inputs and Customization
Range Detection Sensitivity : Controls how strictly ranges are defined.
Strength Score Settings : Adjust weighting of compression, volume, and breakout memory.
Probability Forecasting : Enable/disable directional bias and thresholds.
Gradient & Fill Options : Customize range visualization colors and opacity.
Dashboard Display : Toggle live vs last range, info table size, and position.
Breakout Highlighting : Choose border/zone emphasis on breakout events.
Why Use Advanced Range Analyzer Pro
This indicator provides a data-driven approach to trading consolidation phases, one of the most common yet underutilized market states. By quantifying range strength, mapping probability forecasts, and visually presenting risk zones, it transforms uncertainty into clarity.
Whether you’re trading breakouts, fading ranges, or mapping higher timeframe context, Advanced Range Analyzer Pro delivers a structured, adaptive framework that integrates seamlessly into multiple strategies.

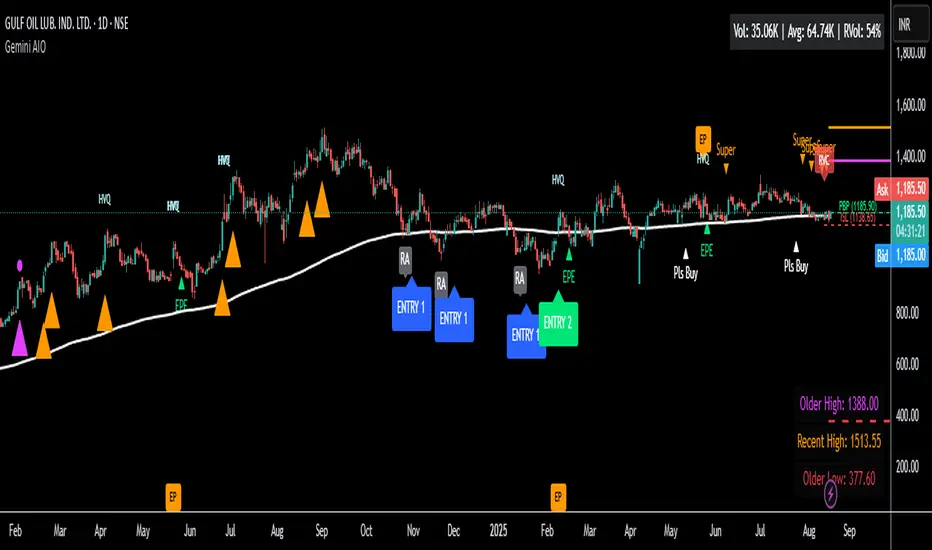
Gemini All-in-OneDescription
The Gemini AIO (All-in-One) is a comprehensive overlay indicator designed for swing and position traders. It merges three distinct and powerful trading strategies into a single, cohesive tool to identify high-probability setups in stocks that are in confirmed uptrends.
What the Indicator Does:
Combines Three Strategies: Integrates a multi-scanner breakout system, a mean-reversion model, and a multi-year breakout tool into one indicator.
Main Modules
Signals Module:
1. Features six unique scanner signals (CS1-CS6) to identify a variety of bullish consolidation patterns.
2. Includes a full trade management framework with RVC (Red Volume Candle), PBP (Post Breakout Pivot Entry), and ISL (Initial Stop Loss) levels.
3. Identifies powerful Episodic Pivot (EP) and EP Entry (EPE) signals for stocks showing exceptional strength.
Reversal Module:
1. A mean-reversion strategy that primarily uses Bollinger Bands to find oversold conditions.
2. Provides a three-stage signal process: RA (Reversal Setup), Entry 1, and Entry 2 to time entries from a potential bottom.
Multi-Year Breakout (MYBO) Module:
1. Automatically identifies and plots historical, multi-year resistance and support levels.
2. Generates a clear signal when the price breaks out above these significant long-term levels.
Advanced Alerts: Features a highly customizable alert system that can be timed to trigger either on the bar's close or at a specific time of day (e.g., 2:30 PM IST), allowing for end-of-day style notifications.
How to Best Use It:
This indicator is most powerful when used with a systematic, rules-based approach. The core principle is to use long-term moving averages to define the trend and then use the indicator's signals to time entries within that trend.
The Foundation (Trend Filter): The most important rule is to only consider long setups on stocks where the 150-day SMA is above the 200-day EMA, and the 150-day SMA is sloping upwards. This keeps you aligned with the primary uptrend.
Strategy 1: The Momentum Breakout (PBP Entry)
1. Confirm the stock meets the primary trend filter rules.
2. Wait for an AIO setup signal (Super, Pls Buy, etc.) to draw a PBP line.
3. Enter when the price crosses above the PBP line or wait for a pull back after the price has crossed the PBP line.
Strategy 2: The Mean Reversion (RA Entry)
1. Confirm the stock meets the primary trend filter rules.
2. Wait for an "RA" (Reversal Setup) signal to appear on the chart.
3. Enter on the "ENTRY 1" (Risky Entry) or "ENTRY 2" signal (Safer Entry) or wait for a pull back after "ENTRY 1" or "ENTRY 2" signal.
Strategy 3: Multi-Year Breakout (MYBO) :
1. A breakout triangle (orange or fuchsia) appears below the candle, signaling a close above the "Recent High" (Orange) or "Older High" (Fuchsia).
2. Recent High refers to the highest price the stock has reached in last 12 months. Breaking above the "Recent High" is a sign of strong current demand.
3. Older High refers to the highest price the stock reached in a more distant, historical period - the period between 5 years ago and 1 year ago. Breaking above the "Older High" is a sign of VERY strong demand as it has broken a historic high.
4. Wait for a breakout triangle to appear on the chart.
5. Enter on the high of the candle marked with a breakout triangle or wait for a pull back after that signal.
Customize Your View: Use the "Inputs" tab to enable/disable the modules you want to focus on and configure the alerts you want to receive. Use the "Style" tab to hide any visual elements you don't need to keep your chart clean.
Trend Range Detector (Zeiierman)█ Overview
Trend Range Detector (Zeiierman) is a market structure tool that identifies and tracks periods of price compression by forming adaptive range boxes based on volatility and price movement. When prices remain stable within a defined band, the script dynamically draws a range box; when prices break out of that structure, the box highlights the breakout in real-time.
By combining a volatility-based envelope with a custom weighted centerline, this tool filters out noise and isolates truly stable zones — providing a clean framework for traders who focus on accumulation, distribution, breakout anticipation, and reversion opportunities.
Whether you're range trading, spotting trend consolidations, or looking for volatility contractions before major moves, the Trend Range Detector gives you a mathematically adaptive, visually intuitive structure that maps the heartbeat of the market.
█ How It Works
⚪ Range Formation Engine
The core of this indicator revolves around two conditions:
Distance Filter: The maximum distance between all recent closes and a dynamic centerline must remain within a volatility envelope.
Volatility Envelope: Based on an ATR(2000) multiplied by a user-defined factor to account for broader market volatility trends.
If both conditions are satisfied over the most recent length bars, a range box is drawn to visually anchor the zone.
⚪ Dynamic Breakout Coloring
When price breaks out of the top or bottom of the active range box, the box color shifts in real-time:
Blue Boxes represent areas where price has remained within a defined volatility envelope over a sustained number of bars. These zones reflect stable, low-volatility periods, often associated with consolidation, equilibrium, or market indecision.
Green Boxes for bullish breakouts.
Red Boxes for bearish breakdowns.
This allows traders to visually spot transitions from consolidation to expansion phases without relying on lagging signals.
█ Why Use a Weighted Close Instead of SMA?
A standard Simple Moving Average (SMA) treats all past closes equally, which works well in theory, but not in dynamic, fast-shifting markets. In this script, we replace the traditional SMA with a speed-weighted average that reflects how aggressively the market has moved bar-to-bar.
⚪ Here's why it matters:
Bars with higher momentum (larger price differences between closes) are given more weight.
Slow, sideways candles (typical in noise or low volume) contribute less to the calculated centerline.
This method creates a more accurate snapshot of market behavior, especially during volatile phases. As a result, the indicator adapts to market conditions more effectively, helping traders identify real consolidation zones, not just average lines distorted by flat bars or noise.
█ How to Use
⚪ Range Detection
Boxes form only when price remains consistently close to the speed-weighted mean.
Helps identify sideways zones, consolidations, and low-volatility structures where price is “charging up.”
⚪ Breakout Confirmation
Once price exits the top or bottom boundary, the box immediately highlights the direction of the break.
Use this signal in conjunction with your own momentum, volume, or trend filters for higher-confidence trades.
█ Settings
Minimum Range Length: Number of candles required for a valid range to form.
Range Width Multiplier: Adjusts the envelope around the weighted average using ATR(2000).
Highlight Box Breaks: Enables real-time coloring of breakouts and breakdowns for immediate visual feedback.
-----------------
Disclaimer
The content provided in my scripts, indicators, ideas, algorithms, and systems is for educational and informational purposes only. It does not constitute financial advice, investment recommendations, or a solicitation to buy or sell any financial instruments. I will not accept liability for any loss or damage, including without limitation any loss of profit, which may arise directly or indirectly from the use of or reliance on such information.
All investments involve risk, and the past performance of a security, industry, sector, market, financial product, trading strategy, backtest, or individual's trading does not guarantee future results or returns. Investors are fully responsible for any investment decisions they make. Such decisions should be based solely on an evaluation of their financial circumstances, investment objectives, risk tolerance, and liquidity needs.

IL - Inside Bar Detector - v01Indicator: IL - Inside Bar Detector - v01
Product: An Indigo Lynx Indicator
Copyright: © Indigo Lynx, v01, 2025-07-04
Description:
This indicator identifies Inside Bar candlestick patterns, which can signal
consolidation or indecision in the market, often preceding breakouts.
It offers multiple definitions for what constitutes an Inside Bar, an
optional volume filter, and differentiates markers and display for
bullish or bearish closing inside bars.
Features:
- Detects Inside Bar patterns.
- Configurable Inside Bar Definitions (via "Inside Bar Definition" input):
1. "Body (O/C)": Current O/C body within previous O/C body.
2. "Range (H/L - Standard)": Current H/L within previous H/L.
3. "Super (Range & Body)": Requires BOTH conditions.
- Optional Volume Filter: Inside Bar volume < SMA of volume.
- Display Toggles: Separate options to show/hide Bullish closing IBs
and Bearish closing IBs.
- Customizable Visuals: Bar color and optional plotshape markers (differentiated
for bullish/bearish closing inside bars using "BI" and "BRI" text).
- Data Logging: Option to log detected pattern details.
How to Use & Interpret:
- Configure definition, volume filter, and display options.
- Inside Bars are highlighted by bar color if their type (bullish/bearish closing) is enabled.
- Optional shapes: Green up-triangle (BI) for bullish-closing Inside Bars,
Red down-triangle (BRI) for bearish-closing Inside Bars, if enabled.
- Use with other analysis methods for confirmation.
Disclaimer: Trading involves substantial risk of loss and is not suitable for all investors.
Past performance is not indicative of future results.

Hodie Smart Inside BarThe Hodie Smart Inside Bar indicator automatically detects and visually highlights inside bars — candles fully contained within the range of the previous (parent) candle.
How the indicator works:
Inside Bar Identification:
The indicator analyzes each candle and checks if its high is lower than the previous candle’s high, and its low is higher than the previous candle’s low. If this condition is met, the candle is considered an inside bar.
Size Filtering:
To filter out small and insignificant consolidations, the indicator compares the size of the parent candle’s range to the inside bar’s range. Only if the parent candle is significantly larger (2 times or more — adjustable parameter), the inside bar is considered significant.
Zone Drawing:
For each detected inside bar, the indicator draws a rectangular zone bounded by the parent candle’s high and low. This zone automatically extends to the right as new bars appear until the price moves outside the parent candle’s range.
Zone Completion:
Once the price closes above the parent candle’s high or below its low, the zone is considered complete and stops extending.
Visual Aids:
If enabled, the indicator can shade the background of the current inside bar for additional visual emphasis.
A label with the text "IB" appears above the inside bar candle on the chart for easier identification.
Alerts:
Supports alerts when a new inside bar forms.
Alerts help traders notice important signals promptly.
To activate, create an alert on the indicator with the condition “New Inside Bar”.
Benefits of the Indicator:
Inside bars often signal consolidation and potential liquidity accumulation, which may be followed by a strong impulsive breakout. This indicator helps traders quickly identify consolidation zones and prepare for possible price moves.

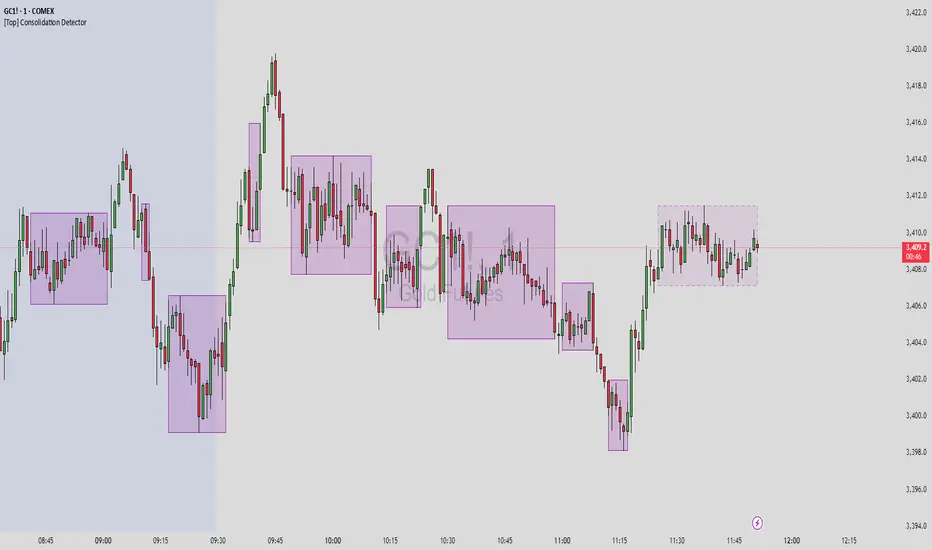
[Top] Consolidation Detector Consolidation Detector
Overview
This indicator identifies and visualizes price consolidation zones in real-time, drawing boxes around periods of reduced volatility and tight price ranges. While optimized for Gold futures (GC) on 1-minute timeframes, it can be adapted for other instruments by adjusting the parameters.
How It Works
The indicator combines three methods to detect consolidation:
Dollar Range Analysis - Identifies when price movement stays within a defined dollar range
ATR (Average True Range) Comparison - Confirms low volatility relative to recent price action
Rate of Change Filter (Optional) - Additional confirmation using momentum analysis
Visual Output
Purple Boxes - Completed consolidation zones that met the minimum bar requirement
Dashed Boxes - Current consolidation in progress (when enabled)
Green Background - Debug mode showing when consolidation conditions are met
Key Features
Real-time consolidation detection
Customizable visual appearance
Debug mode for parameter optimization
Alert conditions for consolidation start/end
Limited to 50 most recent boxes to maintain chart clarity
Input Parameters
Primary Settings:
Lookback Period (4) - Number of bars to analyze for range calculation
ATR Length (20) - Period for ATR calculation
ATR Multiplier (2.5) - Sensitivity threshold for ATR-based detection
Minimum Bars (3) - Required duration for valid consolidation
Max Range in Dollars (15.0) - Maximum price range for consolidation
Visual Settings:
Box Color/Border - Customize appearance
Show Current Consolidation - Display in-progress consolidations
Show Debug Info - Enable visual debugging aids
Alternative Method (Optional):
ROC Length - Period for rate of change calculation
Use ROC Method - Enable additional momentum filter
ROC Threshold % - Maximum rate of change for consolidation
Usage Tips
Start with default settings for Gold futures (GC) on 1-minute charts
Enable "Show Debug Info" to see when conditions are triggered
Adjust "Max Range in Dollars" based on your instrument's typical range
Use lower timeframes (1-5 min) for best results
Adjusting for Other Instruments
Forex: Reduce Max Range to 0.001-0.01
Stocks: Adjust based on price and volatility (typically 0.5-2.0)
Crypto: Increase range for higher volatility
Other Futures: Scale according to tick size and typical movement
Important Notes
This indicator identifies consolidation patterns but does not predict breakout direction
Best used in conjunction with other analysis methods
Consolidation zones often precede significant price movements
Not all consolidations lead to profitable breakouts
Alerts
Two alert conditions are available:
Consolidation Started - New consolidation zone detected
Consolidation Ended - Consolidation period completed
The indicator is designed as a technical analysis tool to help identify periods of price compression. It should be used as part of a comprehensive trading strategy and not as a standalone buy/sell signal generator.
ATR RopeATR Rope is inspired by DonovanWall's "Range Filter". It implements a similar concept of filtering out smaller market movements and adjusting only for larger moves. In addition, this indicator goes one step deeper by producing actionable zones to determine market state. (Trend vs. Consolidation)
> Background
When reading up on the Range Filter indicator, it reminded me exactly of a Rope stabilization drawing tool in a program I use frequently. Rope stabilization essentially attaches a fixed length "rope" to your cursor and an anchor point (Brush). As you move your cursor, you are pulling the brush behind it. The cursor (of course) will not pull the brush until the rope is fully extended, this behavior filters out jittery movements and is used to produce smoother drawing curves.
If compared visually side-by-side, you will notice that this indicator bears striking resemblance to its inspiration.
> Goal
Other than simply distinguishing price movements between meaningful and noise, this indicator strives to create a rigid structure to frame market movements and lack-there-of, such as when to anticipate trend, and when to suspect consolidation.
Since the indicator works based on an ATR range, the resulting ATR Channel does well to get reactions from price at its extremes. Naturally, when consolidating, price will remain within the channel, neither pushing the channel significantly up or down. Likewise, when trending, price will continue to push the channel in a single direction.
With the goal of keeping it quick and simple, this indicator does not do any smoothing of data feeds, and is simply based on the deviation of price from the central rope. Adjusting the rope when price extends past the threshold created by +/- ATR from the rope.
> Features & Behaviors
- ATR Rope
ATR Rope is displayed as a 3 color single line.
This can be considered the center line, or the directional line, whichever you'd prefer.
The main point of the Rope display is to indicate direction, however it also is factually the center of the current working range.
- ATR Rope Color
When the rope's value moves up, it changes to green (uptrend), when down, red (downtrend).
When the source crosses the rope, it turns blue (flat).
With these simple rules, we've formed a structure to view market movements.
- Consolidation Zones
Consolidation Zones generate from "Flat" areas, and extend into subsequent trend areas. Consolidation is simply areas where price has crossed the Rope and remains inside the range. Over these periods, the upper and lower values are accumulated and averaged together to form the "Consolidation Zone" values. These zones are draw live, so values are averaged as the flat areas progress and don't repaint, so all values seen historically are as they would appear live.
- ATR Channel
ATR Channel displays the upper and lower bounds of the working range.
When the source moves beyond this range, the rope is adjusted based on the distance from the source to the channel. This range can be extremely useful to view, but by default it is hidden.
> Application
This indicator is not created to provide signals, or serve as a "complete" system.
(People who didn't read this far will still comment for signals. :) )
This is created to be used alongside manual interpretation and intuition. This indicator is not meant to constrain any users into a box, and I would actually encourage an open mind and idea generation, as the application of this indicator can take various forms.
> Examples
As you would probably already know, price movement can be fast impulses, and movement can be slow bleeds. In the screenshot below, we are using movements from and to consolidation zones to classify weak trend and strong trend. As you can see, there are also areas of consolidation which get broken out of and confirmed for the larger moves.
Author's Note: In each of these examples, I have outlined the start and end of each session. These examples come from 1 Min Future charts, and have specifically been framed with day trading in mind.
"Breakout Retest" or "Support/Resistance Flips" or "Structure Retests" are all generally the same thing, with different traders referring to them by different names, all of which can be seen throughout these examples.
In the next example, we have a day which started with an early reversal leading into long, slow, trend. Notice how each area throughout the trend essentially moves slightly higher, then consolidates while holding support of the previous zone. This day had a few sharp movements, however there was a large amount of neutrality throughout this day with continuous higher lows.
In contrast to the previous example, next up, we have a very choppy day. Throughout which we see a significant amount of retests before fast directional movements. We also see a few examples of places where previous zones remained relevant into the future. While the zones only display into the resulting trend area, they do not become immediately meaningless once they stop drawing.
> Abstract
In the screenshot below, I have stacked 2 of these indicators, using the high as the source for one and the low as the source for the other. I've hidden lines of the high and low channels to create a 4 lined channel based on the wicks of price.
This is not necessary to use the indicator, but should help provide an idea of creative ways the simple indicator could be used to produce more complicated analysis.
If you've made it this far, I would hope it's clear to you how this indicator could provide value to your trading.
Thank you to DonovonWall for the inspiration.
Enjoy!

Consolidation Range with Signals (Zeiierman)█ Overview
Consolidation Range with Signals (Zeiierman) is a precision tool for identifying and trading market consolidation zones, where price contracts into tight ranges before significant movement. It provides dynamic range detection using either ADX-based trend strength or volatility compression metrics, and offers built-in take profit and stop loss signals based on breakout dynamics.
Whether you trade breakouts, range reversals, or trend continuation setups, this indicator visualizes the balance between supply and demand with clearly defined mid-bands, breakout zones, and momentum-sensitive TP/SL placements.
█ How It Works
⚪ Multi-Method Range Detection
ADX Mode
Uses the Average Directional Index (ADX) to detect low-trend-strength environments. When ADX is below your selected threshold, price is considered to be in consolidation.
Volatility Mode
This mode detects consolidation by identifying periods of volatility compression. It evaluates whether the following metrics are simultaneously below their respective historical rolling averages:
Standard Deviation
Variance
Average True Range (ATR)
⚪ Dynamic Range Band System
Once a range is confirmed, the system builds a dynamic band structure using a volatility-based filter and price-jump logic:
Middle Line (Trend Filter): Reacts to price imbalance using adaptive jump logic.
Upper & Lower Bands: Calculated by expanding from the middle line using a configurable multiplier.
This creates a clean, visual box that reflects current consolidation conditions and adapts as price fluctuates within or escapes the zone.
⚪ SL/TP Signal Engine
On detection of a breakout from the range, the indicator generates up to 3 Take Profit levels and one Stop Loss, based on the breakout direction:
All TP/SL levels are calculated using the filtered base range and multipliers.
Cooldown logic ensures signals are not spammed bar-to-bar.
Entries are visualized with colored lines and labeled levels.
This feature is ideal for traders who want automated risk and reward reference points for range breakout plays.
█ How to Use
⚪ Breakout Traders
Use the SL/TP signals when the price breaks above or below the range bands, especially after extended sideways movement. You can customize how far TP1, TP2, and TP3 sit from the entry using your own risk/reward profile.
⚪ Mean Reversion Traders
Use the bands to locate high-probability reversion zones. These serve as reference zones for scalping or fade entries within stable consolidation phases.
█ Settings
Range Detection Method – Choose between ADX or Volatility compression to define range criteria.
Range Period – Determines how many bars are used to compute trend/volatility.
Range Multiplier – Scales the width of the consolidation zone.
SL/TP System – Optional levels that project TP1/TP2/TP3 and SL from the base price using multipliers.
Cooldown – Prevents repeated SL/TP signals from triggering too frequently.
ADX Threshold & Smoothing – Adjusts sensitivity of trend strength detection.
StdDev / Variance / ATR Multipliers – Fine-tune compression detection logic.
-----------------
Disclaimer
The content provided in my scripts, indicators, ideas, algorithms, and systems is for educational and informational purposes only. It does not constitute financial advice, investment recommendations, or a solicitation to buy or sell any financial instruments. I will not accept liability for any loss or damage, including without limitation any loss of profit, which may arise directly or indirectly from the use of or reliance on such information.
All investments involve risk, and the past performance of a security, industry, sector, market, financial product, trading strategy, backtest, or individual's trading does not guarantee future results or returns. Investors are fully responsible for any investment decisions they make. Such decisions should be based solely on an evaluation of their financial circumstances, investment objectives, risk tolerance, and liquidity needs.

Dynamic Range Filter with Trend Candlesticks (Zeiierman)█ Overview
Dynamic Range Filter with Trend Candlesticks (Zeiierman) is a volatility-responsive trend engine that adapts in real-time to market structure, offering a clean and intelligent visualization of directional bias. It blends dynamic range calculation with customizable smoothing techniques and layered trend confirmation logic, making it ideal for traders who rely on clear trend direction, structural range analysis, and momentum-based candlestick signals.
By measuring scaled volatility over configurable lengths and applying advanced moving average techniques, this indicator filters out market noise while preserving true directional intent. Complementing this, a dual-trend system (range-based and candle-based) enhances clarity and responsiveness, particularly during shifting market conditions.
█ How It Works
⚪ Scaled Volatility Band Calculation
At the core lies a volatility engine that constructs adaptive range bands around price using smoothed high/low calculations. The bands are dynamically adjusted using:
High/Low Smoothing – Applies a moving average to the raw high and low data before calculating the range.
Scaled Range Volatility – A 2.618 multiplier scales the distance between smoothed highs and lows, forming a responsive volatility envelope.
Band Multiplier – Controls how wide the upper/lower range bands extend from the mean.
This filtering process minimizes false signals and highlights only structurally meaningful moves.
⚪ Multi-Type Smoothing Engine
Users can choose from a wide array of smoothing algorithms for trend construction, including:
HMA (default), SMA, EMA, RMA
KAMA – Adapts to market volatility using efficiency ratios.
VIDYA – Momentum-sensitive smoothing using CMO logic.
FRAMA – Dynamically adjusts to fractal dimension in price.
Super Smoother – Ideal for eliminating aliasing in range signals.
This provides the trader with fine-tuned control over reactivity vs. smoothness.
⚪ Trend Detection (Dual Engine)
The indicator includes two independent trend tracking systems:
Main Trend Filter – Based on adaptive volatility band shifts.
Candle Trend Filter – A second-tier confirmation using smoothed candle data, ideal for directional candles and confirmation entries.
█ How to Use
⚪ Trend Confirmation
Use the Trend Line and colored candlesticks for high-probability entries in the trend direction. The more trend layers that align, the higher the confidence.
⚪ Reversal Zones
When the price reaches the outer bands or fails to break them, look for candle color shifts or a crossover in the range to anticipate possible reversals or consolidations.
█ Settings
Scaled Volatility Length – Controls the lookback used to stabilize the base volatility band.
MA Type & Length – Choose and fine-tune the smoothing method (HMA, EMA, KAMA, etc.)
High/Low Smoother – Pre-smoothing for structural high/low banding.
Band Multiplier – Adjusts the width of the dynamic bands.
Trend Length (Candles) – Length used for candle-based trend confirmation.
-----------------
Disclaimer
The content provided in my scripts, indicators, ideas, algorithms, and systems is for educational and informational purposes only. It does not constitute financial advice, investment recommendations, or a solicitation to buy or sell any financial instruments. I will not accept liability for any loss or damage, including without limitation any loss of profit, which may arise directly or indirectly from the use of or reliance on such information.
All investments involve risk, and the past performance of a security, industry, sector, market, financial product, trading strategy, backtest, or individual's trading does not guarantee future results or returns. Investors are fully responsible for any investment decisions they make. Such decisions should be based solely on an evaluation of their financial circumstances, investment objectives, risk tolerance, and liquidity needs.

TOMOs Consolidation Indicator using Bar Heightswhat this is: This indicator creates an alert (see green arrow) when there are periods of consolidation in the chart. YOU define what consolidation means. It looks at BOTH candle heights (wicks included by default) AND checks the lowest and highest of those candles.
> Number of candles to check: you define how many candles you want to use to calculate consolidation. For instance, if you select 3 candles and you're on a 5-min chart, that's 15 mins of consolidation.
> Max Candle Height: You define what consolidation height or range is considered consolidation to you. So if you put in a value of 15. That means the last X number of candles are examined for whether OR NOT they are at or below that height. If they are, then it checks to see if the lowest and highest point among those candles are within that height as well. IF they are, then you see a green arrow. That is consolidation in this indicator. And you can use it for an alarm.
> the blue shade just means consolidation is continuing BEYOND the green-arrow when it was indicated. It's just a visual indicator. that's it.
> Include Wicks in Candle Height? Maybe you just want the body of the candle and not it's wicks. Your call.
Trigger Starts and stops: hour/min. This is ALL Eastern time (NYSE's time) and NOT your own timezone. You can simply tell the script you ONLY want the trigger alert to happen between the the start and end time. So if you're using it to trigger a trade, maybe you don't want to trigger it too early or late in the day.
Inputs in Status Line: This is tradingview default. I can't remove it.
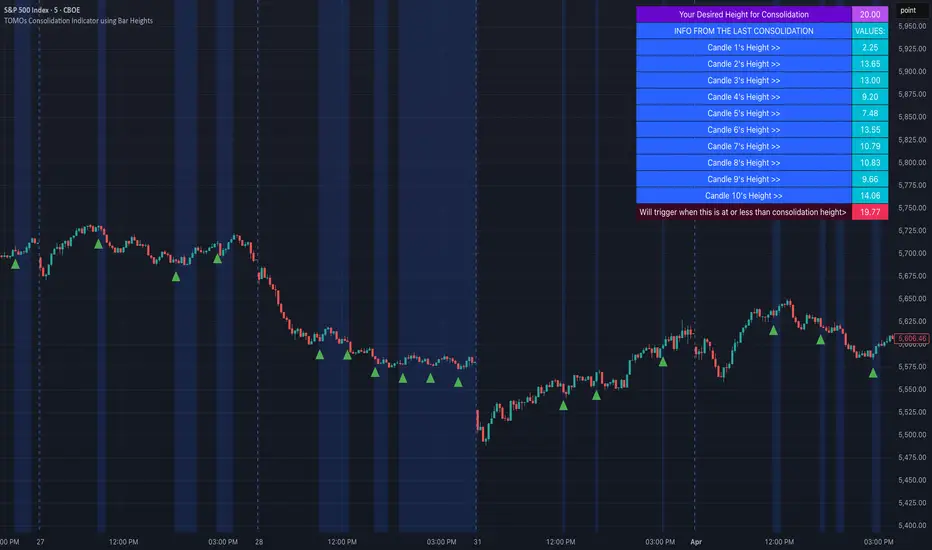
Trend Trading IndicatorThis trend trading indicator uses multiple different custom formulas to identify market trends as well as identify when the market is moving sideways. It has a master trend that will show you the trend using the color of the candles and then there are multiple different types of entry and confluence signals that will appear as different chart shapes above or below the candles to inform you about when to enter a trade and how strong the trend is so you know whether to hold a position longer or get out. There is also a panel at the bottom of the chart that shows you the trend strength for 5 different timeframes so you can easily identify the short and long term trends and scan through charts quickly to find markets with the strongest trends.
The indicator can be customized to fit your trading style by adjusting the timeframes for the master trend, which timeframes affect signals, turning on or off the various entry & confluence signals, turning on or off ranging market filters and more. It can be adjusted to react quickly for intraday trading or use long timeframes for swing trading or only trading when the market is in a strong long term trend.
The indicator also has a built in trend direction value that can be sent to other indicators to be used as a trend filter as well by setting the source value on an external indicator to use the trend direction value from this indicator. This is useful for preventing signals from coming in on other indicators when they go against the trend that this indicator has identified according to the settings it is configured with.
How To Use This Indicator Properly
This indicator is designed to only give signals when the market is trending and filter out the sideways price action for you. Due to this, depending on the timeframe settings you use, there may be extended periods where there are no signals because the market is going sideways. You can adjust your timeframe settings to react faster or slower by lowering the timeframes used and turning off some of the higher timeframes or use all of the timeframes available and only get signals when the market is in a strong long term trend for the safest trades.
The indicator uses a master trend that needs to show a trend before any other confluence signals can come in. The master trend will show up by coloring the candles blue when the trend is bullish or orange when the trend is bearish according to the settings you have chosen. When the market is not trending, the candles will be colored grey. This helps to keep you out of trades when the market is going sideways. You will only be able to see the master trend by using the colored candles though, so make sure to turn the chart’s candle coloring off so it doesn’t override the indicator candle coloring.
Once a trend has been established, then other signals will begin to show up if the trend is strong and various parameters are met. The indicator includes the following types of signals:
Master Trend Signals
Strong Trend Buy & Sell Signals
Pullback During Strong Trend Signals
Strong All Timeframe Trend Signals
Trend Strength Score Signals
The indicator also has multiple filters you can use to customize the master trend to allow more or less signals to come in. The more filters you have on, the better and more likely the signals are to be winners because it will only give signals when there are very strong trends on all timeframes. If you want a lot of signals for intraday scalping, you can turn off most of the filters and just use lower timeframes for the master trend settings. The following filters can be used to customize the trend parameters:
Signals Only Allowed In Direction Of Timeframes 4 & 5
Trend Of Timeframe #1 Used For Master Trend Signals
Trend Of Timeframe #2 Used For Master Trend Signals
Trend Of Timeframe #3 Used For Master Trend Signals
Trend Of Timeframe #4 Used For Master Trend Signals
Trend Of Timeframe #5 Used For Master Trend Signals
No Master Trend Signals If This Timeframe Is Ranging - #1
No Master Trend Signals If This Timeframe Is Ranging - #2
No Master Trend Signals If This Timeframe Is Ranging - #3
Make sure to keep all trend timeframes in order from 1-5 for best results, even if they are turned off. The indicator is programmed to compare each timeframe to the next one, so keeping the timeframes in order will give you proper calculations. For example: timeframes 1-5 should be 15, 60, 240, 1D, 1W or 240, 1D, 1W, 1M, 3M and so on.
The indicator has alerts for bullish and bearish versions of each type of signal so you can get notified when a chart is trending strongly.
Market Hours Available To Use The Indicator On
The indicator works on stocks, crypto, forex and futures markets and other markets that have the same hours, you just need to select the hours that the market you are trading has in the main indicator settings to get the correct signals. There are options for stock hours(6.5 hours a day, 5 days per week), futures/forex hours(23 hours a day, 5 days per week) and crypto hours(24 hours a day, 7 days per week). Just select the correct option in the dropdown menu and the indicator will calculate based on those hours.
Master Trend Settings
The master trend is calculated using Timeframes 1-5, the setting for whether to use timeframes 1-5 for signals, ranging market filters 1-3 and only allow signals in the direction of timeframes 4 & 5. These settings will affect how the overall trend is calculated, which has to be trending in order for any confluence signals to come in.
Set timeframe 1 to a higher timeframe than your chart is set to. For example if you trade the 1 minute or 5 minute chart, timeframe #1 needs to be set to something higher than your chart so 15, 60 or 240. Then set timeframes 2-5 to be one timeframe higher than the previous one. So if timeframe 1 is 60, then timeframe 2 should be 240 and so on. Make sure to do this even if you do not turn on each timeframe to be used for master trend signals as the higher timeframes will still affect the confluence signals.
Turn on or off the toggle for each timeframe if you want the master trend to use. Keeping just lower timeframes on will give more signals for short term trends and leaving all of the timeframes on will only give signals when all of the timeframes are trending. I recommend keeping timeframes 1 & 2 on at the very least and then turning on or off timeframes 3-5 based on how many signals you want and how strong you want the trend to be in order for signals to be given.
Ranging Market Filters
The indicator has parameters to detect if the market is ranging or moving sideways on each timeframe and will show this by coloring the trend strength score in the bottom panel grey for that timeframe. When the market is ranging, it is best to not trade because there is no established trend. Use these filters to increase the probability of the master trend and confluence trend signals being correct and moving in the direction of the trend.
If you turn on the ranging market filters, you will not get any signals if the market is detected as ranging on any of the timeframes you have turned on for the ranging market filters.
You can use 1, 2 or all 3 ranging market filters to dial in the indicator to your preference. Make sure to backtest it and look at historical data to see how this will affect the indicator and choose what settings work best for your style of trading.
Signals Only Allowed In Direction Of Timeframes 4 & 5
If you only want to make sure you are trading in the direction of the long term trend, turn this setting on. It will prevent the indicator from giving any signals that are not in the same direction as the long term trends and increase your probability for winning trades.
This setting allows you to quickly filter out any noise that you will get from lower timeframe trends that are not in the same direction as the long term trends and helps to ensure you stick to the overall trend. Markets will usually make much faster and larger moves in the direction of the overall trend and have high resistance, choppy moves when going in the opposite direction, so this will help you avoid getting into those trades even if you don’t have timeframes 4 & 5 turned on in the master trend timeframe settings.
Strong Buy & Sell Signals
When the master trend detects a trending market and the trend is strong on all 5 timeframes, the indicator will show crosses on the chart meaning these are great entry points to get into the market with positions in the direction of the trend. There are 3 levels of these signals and will show as small crosses, medium crosses and large crosses. The larger the cross is, the stronger the trend is and is more likely to continue the trend.
Use these strong buy & sell signal crosses as entry points and place your stop loss at the most recent major pivot. Then trail your stop loss with the trade to lock in profits.
Pullbacks During Strong Trend Signals
When there is a strong trend on timeframes 3-5 and a pullback on timeframes 1 & 2, then move back in the direction of the higher timeframe trend, this will fire a signal to enter a trade in the direction of the trend. These are excellent entries since the market has pulled back, allowing you to have a good entry with low potential drawdown.
These signals will appear as label tag or price tag looking signals. Use these for your entries and then place a stop loss just beyond the most recent major pivot and trail your stop loss as the trade moves in your favor to lock in profits.
Strong All Timeframe Trend Signals
When the trend is strong on all timeframes that you have set to use for master trend signals, the indicator will show circles/dots on the chart above or below the candles. There is also a second type of strong trend calculation that it uses that will detect a strong trend in a slightly different way and that formula will paint a background color on the chart as extra confluence. When the background color and dots show up at the same time, that means both formulas are showing strong trends.
Use these dots and background coloring to confirm your position and continue to hold it for more gains. Strong trends typically continue in the same direction so use these signals as extra confluence to hold your position and stay in the trade.
Trend Strength Score Signals
Each timeframe will have a trend strength score calculated. If you turn the visuals on in the master trend timeframe settings, they will show up as an oscillator in the bottom panel. It will show red for bearish trends and green for bullish trends and grey when the market is ranging. It will also show a label next to each timeframe telling you the score out of the maximum score for that timeframe.
Pay attention to these as they will give you a very quick way to read the long term and short term trends. When all timeframes are trending strongly, the background will paint red or green to notify you of strong trends that you can trade.
When the long term trends agree, but short term trends are going against the long term, look for the short term trends to reverse and use those areas as entry positions for longer trades in the direction of the overall trend. Doing this really helps to identify possible reversals and keep you from getting into those types of trades too early.
Timeframes The Indicator Can Be Used On
The indicator is setup to be used on the following chart timeframes: 15 seconds, 30 seconds, 1 minute, 2 minute, 3 minute, 5 minute, 10 minute, 15 minute, 30 minute, 1 hour, 2 hour, 4 hour, 6 hour, 8 hour, 12 hour and 1 day charts.
If your chart is set to a different timeframe than the ones listed above, it will not calculate properly, so make sure your chart is on the correct timeframe.
Markets The Indicator Can Be Used On
The indicator has 3 modes for various market hours. The type of market doesn’t matter, what matters is how many hours that market is open for. Almost all markets fall under 3 types of opening hours so we have provided the ability for the indicator to calculate correctly on all 3 types of market hours. The hours it can use are: stocks(6.5 hours per day, 5 days per week), crypto(24 hours per day, 7 days per week) and futures/forex(23 hours per day, 5 days per week).
You will need to update this setting from the dropdown at the top of the indicator settings to match the chart that you are on for it to calculate correctly.
Filtering Other Indicators Using The Trend Direction Of This Indicator
The indicator has a built in trend direction value that can be sent to other indicators and used as a filter. By setting an input.source() value on other indicators that are on the same chart as this indicator, you can set that indicator to do or not do whatever you want when this trend indicator shows a trend or not.
The name of the source you can use on your external indicator is called Trend Direction To Send To External Indicators. The values it sends are as follows: 0 when there is no master trend direction, 1 when the master trend is bullish and -1 when the master trend is bearish.
By using this source, you can prevent other indicators from giving sell signals during up trends, prevent other indicators from giving buy signals during down trends and prevent other indicators from giving any signals when the market is ranging or not showing an established trend.
Alerts Available To Use
The indicator has alerts for bullish versions as well as bearish versions of each type of signal available. Use these alerts to notify you of strong trends on markets that you may not have the charts up for at all times but still want to trade.

Volatility-Volume Index (VVI)Volatility-Volume Index (VVI) – Indicator Description
The Volatility-Volume Index (VVI) is a custom trading indicator designed to identify market consolidation and anticipate breakouts by combining volatility (ATR) and trading volume into a single metric.
How It Works
Measures Volatility : Uses a 14-period Average True Range (ATR) to gauge price movement intensity.
Tracks Volume : Monitors trading activity to identify accumulation or distribution phases.
Normalization : ATR and volume are normalized using their respective 20-period Simple Moving Averages (SMA) for a balanced comparison.
Interpretation
VVI < 1: Low volatility and volume → Consolidation phase (range-bound market).
VVI > 1: Increased volatility and/or volume → Potential breakout or trend continuation.
How to Use VVI
Detect Consolidation:
Look for extended periods where VVI remains below 1.
Confirm with sideways price movement in a narrow range.
Anticipate Breakouts:
A spike above 1 signals a possible trend shift or breakout.
Why Use VVI?
Unlike traditional volatility indicators (ATR, Bollinger Bands) or volume-based tools (VWAP), VVI combines both elements to provide a clearer picture of consolidation zones and breakout potential.

[GrandAlgo] Candle Trap ZonesThe Candle Trap Zones indicator identifies areas where price becomes "trapped" within a defined range and refines these zones using a proprietary algorithm. This unique approach ensures that only the most relevant zones, based on both proximity and price behavior, are highlighted for traders. By integrating advanced features like Fibonacci Cloud visualization and customizable detection parameters, the indicator offers tools to support detailed and adaptable price action analysis.
How It Works:
The Candle Trap Zones indicator evaluates historical price data to identify ranges where price has been trapped. Zones are filtered using proximity detection to prevent overlaps and maintain clarity. Additionally:
The strength parameter adjusts the sensitivity of zone identification, while the trap detection range determines how far back the algorithm evaluates price data.
The Fibonacci Cloud acts as an extension of the identified zones, providing additional precision by highlighting key levels just outside the zones
The auto-adjustment feature dynamically modifies zones if new zones are formed in close proximity, ensuring the chart reflects the most relevant areas.
The zone extension feature expands zones when price re-enters, allowing traders to track extended interactions with critical levels.
Key Features:
Proximity-Based Trap Zone Detection
Dynamically identifies and refines trap zones while avoiding overlaps to keep charts clean.
Fibonacci Cloud Integration:
Extends trap zones with Fibonacci-based levels, providing actionable reference points for potential reactions.
Customizable Detection Parameters:
Fine-tune zone detection with adjustable strength and range settings to suit various trading styles.
Real-Time Alerts:
Sends notifications when price enters, exits, or re-tests a trap zone, enabling timely trading decisions.
Dynamic Zone Updates:
Continuously recalculates zones as new data becomes available, reflecting current market conditions.
Clear and Intuitive Visuals:
Trap zones and Fibonacci clouds are highlighted in distinct colors for seamless chart analysis.
Use Cases:
Identify areas where price consolidates or liquidity builds up.
Monitor zones for potential breakouts or reversals.
Fibonacci Clouds serve as additional reference points for anticipating market reactions and refining trade setups
Trap zones may highlight areas of accumulation or distribution where traders can anticipate price reversals or breakouts.
Useful for identifying liquidity zones in range-bound markets or pinpointing key levels for breakout trades in trending markets.
Adaptable for use in Forex, crypto, stocks, and other trading markets.
Disclaimer:
This indicator is a technical analysis tool designed to assist traders by providing insights into market conditions. It does not guarantee future price movements or trading outcomes and should not be relied upon as a sole decision-making tool. The effectiveness of this indicator depends on its application, which requires your trading knowledge, experience, and judgment.
Trading involves significant financial risk, including the potential loss of capital. Past performance of any tool or indicator does not guarantee future results. This script is intended for educational and informational purposes only and does not constitute financial or investment advice. Users are strongly encouraged to perform their own analysis and consult with a qualified financial professional before making trading decisions.
