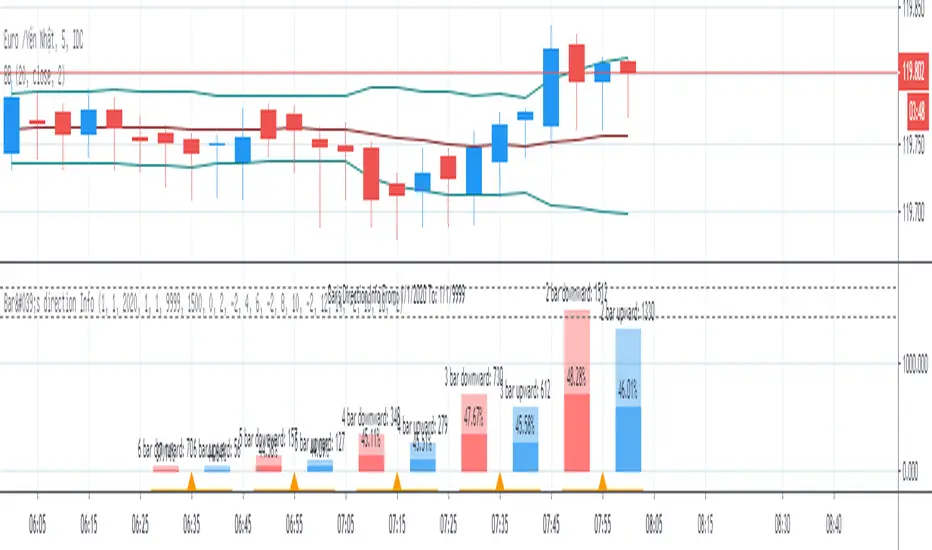
Bar's direction InfoBar's direction Info show number of case which bars have same direction and counting percent of next bar's direction. This info may be useful to trade Binary Option.Penunjuk Pine Script®oleh inno14Telah dikemas kini 44169
Meme Countan adaptation of td count that removes the cap on 9, but instead updates the shoulder when we go past 9. that way it's sort of like a tweaked shoulder in strong mo, hopefully it gives more meaningful s/r levels.Penunjuk Pine Script®oleh ParCornTelah dikemas kini 22130
Synergy StatsSynergy Stats This indicator is intended to complement the Synergy indicator. It provides the following statistics: A percentage showing how often the two assets move in the opposite direction over a given lookback period. Similarly, another percentage showing how often the two assets move in the same direction over the same lookback period. Count the number of times (occurrences) when the two assets move in the same direction for more than 4 bars. Count the number of times the alternative asset moves more than x% Count the number of times that chart asset moved in the same direction of the alternative asset when the alternative asset moved more than x% Both indicators were developed for use in an investigation/tutorial using Pine Script to analyse Gold and US Dollar Index correlation. The full free post can be found here: backtest-rookies.comPenunjuk Pine Script®oleh BacktestRookies1142
Gann Swings Trend CounterBased on Rick Santos ' Swing Charts V1 Darvas Box V0.1' However I have migrated script to pine version 3, customized to suite and added a higher number for the trend count Penunjuk Pine Script®oleh Lij_MCTelah dikemas kini 1111 1 K
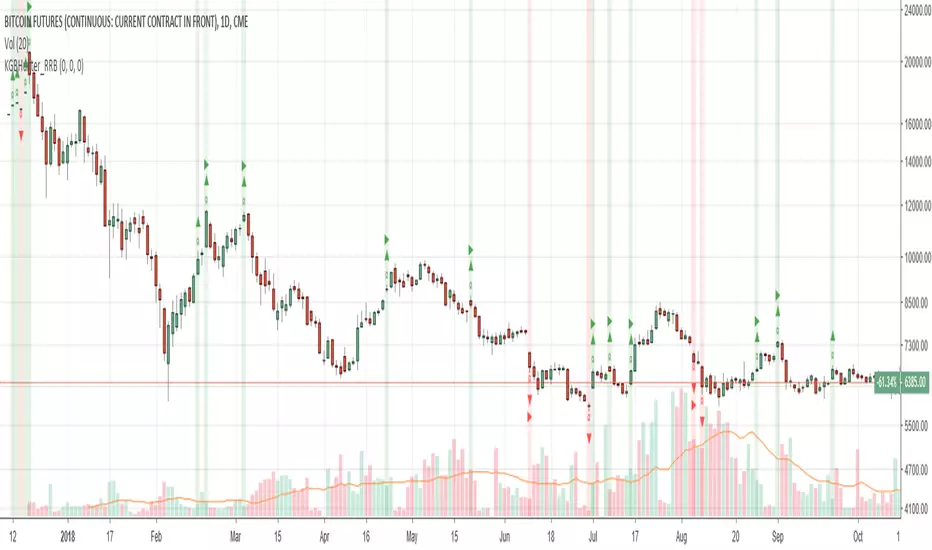
Katana Gaps Bounty Hunter (Show Gaps Counter) by RRBKatana Gaps Bounty Hunter (KGB_Hunter) by RagingRocketBull 2018 Version 1.0 This indicator shows/counts/filters gaps on a chart There are several versions: Simple, Pro and Zones. This is the Simple version. The Differences are listed below. - Simple: shows/counts gaps, changes color based on gap dir (2 colors), filters out price gaps within session, large gaps, and high volume gaps - Pro: +shows all types of gaps, multi color, more filters (time gaps, doji, etc) - Zones: +shows gaps as dynamic horiz zones Features: - highlights gaps using barcolor and plotchar chars (2 colors x 2 dirs) - can show/hide gaps/chars based on gap dir - changes color of gaps/chars based on gap dir - displays chars above/below bar based on gap dir - can filter out price gaps, large gaps, and high volume gaps - counts all filtered gaps Good Luck! Feel free to reuse the code and make it your ownPenunjuk Pine Script®oleh RagingRocketBullTelah dikemas kini 55116
Hurst Exponent Market Phases [DW]This study is an experiment designed to identify market phases using changes in an approximate Hurst Exponent. The exponent in this script is approximated using a simplified Rescaled Range method. First, deviations are calculated for the specified period, then the specified period divided by 2, 4, 8, and 16. Next, sums are taken of the deviations of each period, and the difference between the maximum and minimum sum gives the widest spread. The rescaled range is calculated by dividing the widest spread by the standard deviation of price over the specified period. The Hurst Exponent is then approximated by dividing log(rescaled range) by log(n). The theory is that a system is persistent when the Hurst Exponent value is above 0.5, and antipersistent when the value is below 0.5. The color scheme indicates 4 different phases I found to be significant in this formula: - Stabilization Phase - Destabilization Phase - Chaos Increase Phase - Chaos Decrease Phase This script includes two visualization types to choose from: - Bar Counter Mode, which displays the number of bars the exponent is consecutively in each phase. - Hurst Approximation Mode, which displays the approximated exponent value. Custom bar colors are included. Please note: This is a rough estimate of the Hurst Exponent. It is not the actual exponent. Numerous approximations exist, and their results all differ slightly. Penunjuk Pine Script®oleh DonovanWall88806
Green BarsA simple script to count the number of up days, or intraday bars, (Green Bars) for a given Look Back period. Inputs are: Look Back Period and Increment. Use 0 for the Increment to count only the up days, or bars. Use -1 to include the down days, or bars, in the sum.Penunjuk Pine Script®oleh 4X4good103
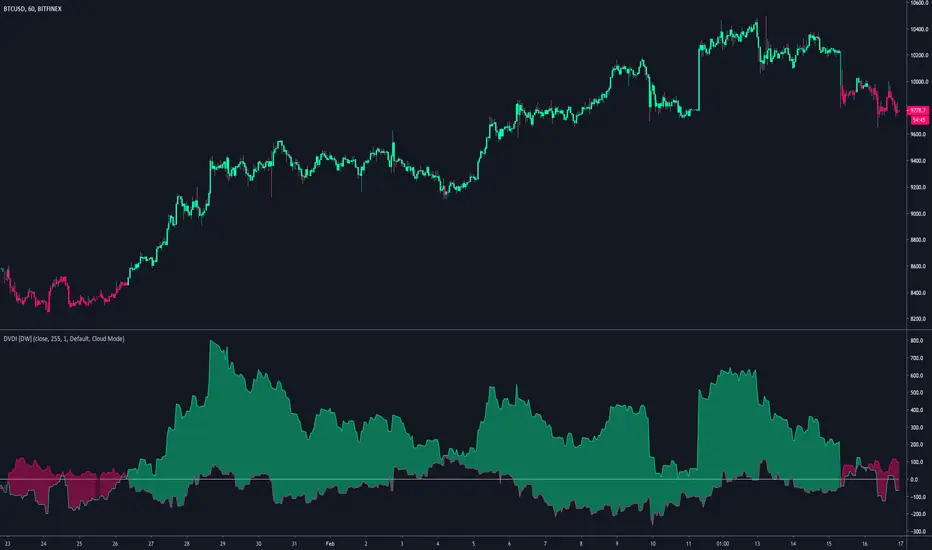
Dual Volume Divergence Index [DW]This is an experimental variation of Paul L. Dysart's Positive Volume Index and Negative Volume Index that tracks the divergences between the PVI and its EMA, and the NVI and its EMA, then plots both together for comparison. This tool can be used to identify trending price activity.Penunjuk Pine Script®oleh DonovanWallTelah dikemas kini 1414 1.6 K
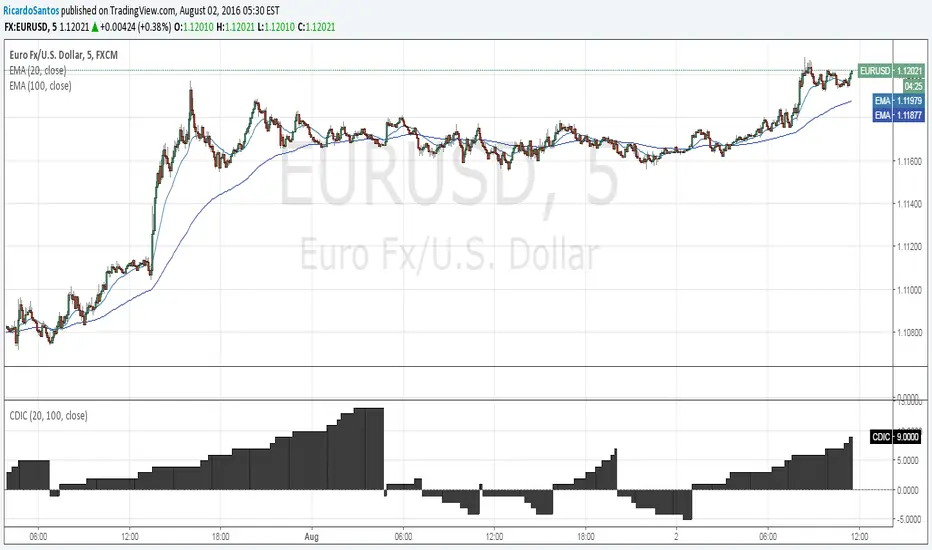
[RS]Convergence Divergence Impulse Counter V0EXPERIMENTAL: Counts the number of impulses with the same direction within a larger trend.Penunjuk Pine Script®oleh RicardoSantos55244