2 EMA Meeting PointThis script will calculate when the next candle needs to close for the moving averages to cross .
If you use EMAs that are far away, the convergence point may be ridiculously far away from the chart. I recommend using ' Scale Price Chart Only ' with this script.
I think you can use this to organize your watchlists if you trade crossovers. If your cross is completely out of the chart, its symbol can be down below, because the cross is unlikely to happen in the next candle.
Good luck!
Cross
Gann Square 9 Price Line Helper (Experimental)This indicator was intended as educational purpose only for Gann Square 9, specifically to show Cross and Cross Cardinal.
This indicator was build upon The Tunnel Thru The Air Or Looking Back From 1940, written by WD Gann .
Values shown is theoretical for basic understanding and may not represent actual market trend.
This pine script for educational purpose as basic understanding only, not recommend for actual trade and use at your on risk.
Indicator features :
1. Font size for table from tiny to huge.
2. Table can change position or hide.
2. For desktop display only, not for mobile.
3. All values can be selected individually or group to display individual or group lines and labels.
FAQ
1. Credits
WD Gann , The Tunnel Thru The Air Or Looking Back From 1940
2. Page involved
195 - 198
3. Code Usage
Free to use for personal usage.

Gann Square 9 Table Concept Alternate UIThis indicator was intended as educational purpose only for Gann Square 4, specifically to show Cross Cardinal.
This indicator was build upon The Tunnel Thru The Air Or Looking Back From 1940, written by WD Gann .
This build was improved by grouping similar values after selected to save time.
User Interface also was improved.
Indikator ini bertujuan sebagai pendidikan sahaja untuk Gann Square 4, khusus untuk menunjukkan Cross Cardinal.
Indikator ini dibina berdasarkan buku The Tunnel Thru The Air Or Looking Back From 1940, ditulis oleh WD Gann .
Binaan ini telah ditambah baik engan mengumpulkan nilai yang sama setelah dipilih untuk menjimatkan masa.
User Interface juga telah ditambah baik.
Indicator features :
1. Font size from tiny to huge.
2. For desktop display only, not for mobile.
3. All values can be selected by group.
Kemampuan indikator :
1. Saiz font dari paling kecil ke paling besar.
2. Untuk paparan desktop sahaja, bukan untuk mobile.
3. Semua nilai boleh dipilih secara berkumpulan.
FAQ
1. Credits / Kredit
WD Gann , The Tunnel Thru The Air Or Looking Back From 1940
Ganzilla
2. Page involved / Muka Surat terlibat
195 - 198
3. Code Usage / Penggunaan Kod
Free to use for personal usage.
Bebas untuk kegunaan peribadi.
4. Previous build / Binaan sebelum ini
Gann Square 9 Cross Cardinal Table Concept
5. Related build / Binaan berkaitan
Gann Square 4 Cross Cardinal Table Concept
Gann Square 4 Table Concept Alternate UI
Left : Even array number / Kiri : Array nombor genap
Right : Odd array number / Kanan : Array nombor ganjil
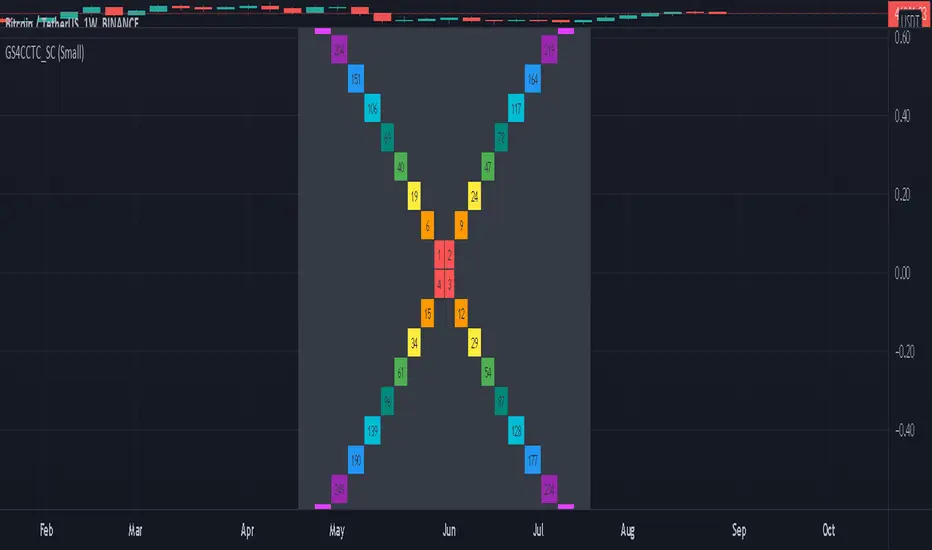
Gann Square 4 Cross Cardinal Table ConceptThis indicator was intended as educational purpose only for Gann Square 4, specifically to show Cross Cardinal.
This indicator was build upon The Tunnel Thru The Air Or Looking Back From 1940, written by WD Gann.
Gann Square 4 is similar to Gann Square 9 (Refer this build) but limited to Cross Cardinal only.
Indikator ini bertujuan sebagai pendidikan sahaja untuk Gann Square 4, khusus untuk menunjukkan Cross Cardinal.
Indikator ini dibina berdasarkan buku The Tunnel Thru The Air Or Looking Back From 1940, ditulis oleh WD Gann.
Gann Square 4 hampir sama dengan Gann Square 9 (Rujuk binaan ini) tetapi terhad kepada Cross Cardinal sahaja.
Indicator features :
1. Font size from tiny to huge.
2. For desktop display only, not for mobile.
3. All values can be selected individually.
Kemampuan indikator :
1. Saiz font dari paling kecil ke paling besar.
2. Untuk paparan desktop sahaja, bukan untuk mobile.
3. Semua nilai boleh dipilih secara individu.
FAQ
1. Credits / Kredit
WD Gann , The Tunnel Thru The Air Or Looking Back From 1940
Ganzilla
2. Page involved / Muka Surat terlibat
195 - 198
3. Code Usage / Penggunaan Kod
Free to use for personal usage.
Bebas untuk kegunaan peribadi.
Left : All values off / Kiri : Semua nilai off
Right : All values on / Kanan : Semua nilai on
Left : Random Usage / Kiri : Kegunaan Random
Right : Ideal Usage / Kanan : Kegunaan Ideal
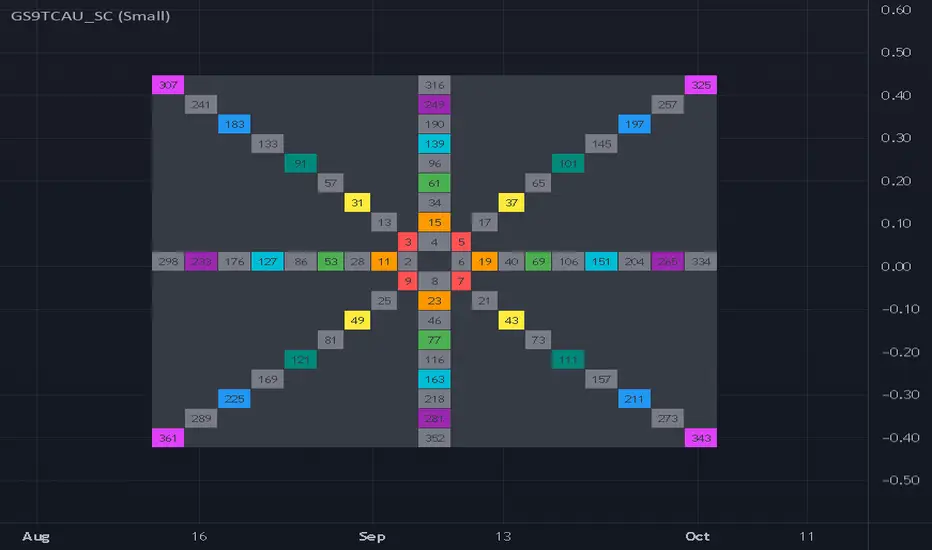
Gann Square 9 Cross Cardinal Table ConceptThis indicator was intended as educational purpose only for Gann Square 9, specifically to show Cross and Cross Cardinal.
This indicator was build upon The Tunnel Thru The Air Or Looking Back From 1940, written by WD Gann.
Indikator ini bertujuan sebagai pendidikan sahaja untuk Gann Square 9, khusus untuk menunjukkan Cross dan Cross Cardinal.
Indikator ini dibina berdasarkan buku The Tunnel Thru The Air Or Looking Back From 1940, ditulis oleh WD Gann.
Indicator features :
1. Font size from tiny to huge.
2. For desktop display only, not for mobile.
3. All values can be selected individually.
Kemampuan indikator :
1. Saiz font dari paling kecil ke paling besar.
2. Untuk paparan desktop sahaja, bukan untuk mobile.
3. Semua nilai boleh dipilih secara individu.
FAQ
1. Credits / Kredit
WD Gann, The Tunnel Thru The Air Or Looking Back From 1940
Ganzilla
2. Page involved / Muka Surat terlibat
195 - 198
3. Code Usage / Penggunaan Kod
Free to use for personal usage.
Bebas untuk kegunaan peribadi.
Left : All values off / Kiri : Semua nilai off
Right : All values on / Kanan : Semua nilai on
Left : All Cross / Kiri : Semua Cross
Right : All Cross Cardinal/ Kanan : Semua Cross Cardinal
Left : Random Usage / Kiri : Kegunaan Random
Right : Ideal Usage / Kanan : Kegunaan Ideal

Cross Average PriceSimple script that allows you to view crossings and averages 14/50/100/200 in a simple and intuitive way.
With this script you can keep an eye on trends visually.
Green Point = 14 crosses 50
Yellow Point = 14 crosses 100
Red Point = 14 crosses 200

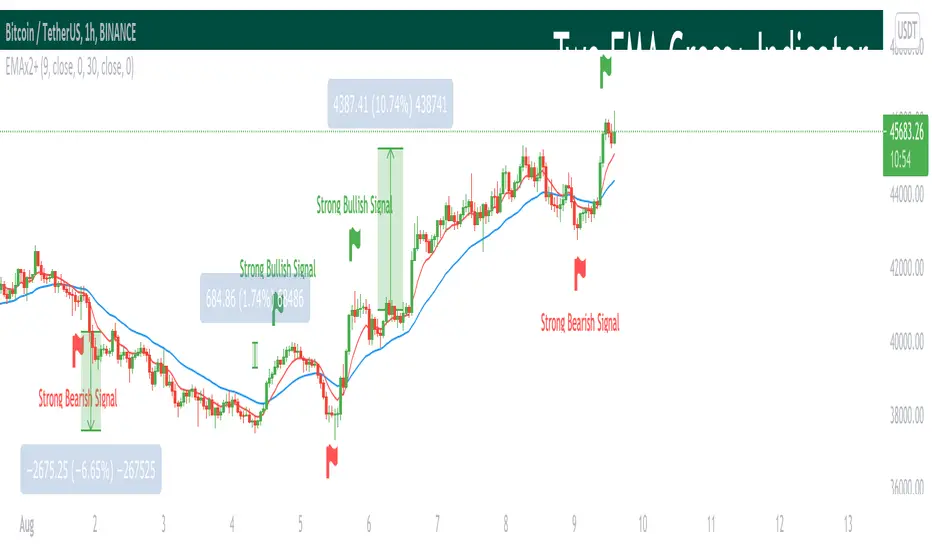
Two EMA Cross+ IndicatorHello traders!
Today we gonna demonstrate out heuristic of classical EMA Indicator. We decided to simplify your trading staff and add some meta data. So, let’s look at it from the very beginning and initially speak about what EMA is and then I’ll tell you why our indicator is extremely convenient and useful.
So, what is EMA? An exponential moving average ( EMA ) is a type of moving average (MA) that places a greater weight and significance on the most recent data points. The exponential moving average is also referred to as the exponentially weighted moving average . An exponentially weighted moving average reacts more significantly to recent price changes than a simple moving average ( SMA ), which applies an equal weight to all observations in the period.
Key takeaways:
-The EMA is a moving average that places a greater weight and significance on the most recent data points.
-Like all moving averages, this technical indicator is used to produce buy and sell signals based on crossovers and divergences from the historical average.
As you know, EMA Cross is one of basic and most popular Entry Indicators. It’s kinda easy to understand and even easier to use. This indicator consists of two EMAs - fast (red line) and slow (blue line). Fast EMA is EMA of less length that the fast EMA (default parameter is 9). Thus, it reacts the price change more actively than the slow. We can say that it takes into consideration the most actual price movements. Speaking about slow EMA (default parameter is 30) it’s more inert and it’s more difficult to change its action vastly. We can say that the EMA «looks» at the historical data more accurate, but doesn’t forget about actual price movements.
But how it works? Trivial. When the fast EMA crosses the slow bellow, it provides bearish signal, whereas when it crosses it above, it’s bullish signal. Even more, we added some «confirmation» factor. As you know, when the price is above the slow EMA, the slow EMA plays the role of support line for price and means that the price is in uptrend. Thus, when we see the cross above and it takes place under the price, we called it «strong Bullish Signal». When the price is bellow the slow EMA, slow EMA is resistance. Thus, when we see the cross bellow and it’s under the slow EMA, we called it «strong Bearish Signal».
To make your trading process easier, we plotted the places of crosses on the chart and added the descriptions of the crosses. The flags mean the place of cross. The default parameters have nice backtest on 1H chart. However, you can also change them depending on your goals and the time period. The places of cross looks like flags (red flag is «bearish» cross, green - «bullish»). As you can see, it’s really convenient.
I hope you’ll enjoy our heuristic of classical EMA Cross. We are sure that the meta data that we are taking into consideration makes the signals more accurate and the deals more profitable. The SkyRock Team with support of Trading View try to make your trading process more successful and profitable. Every day we works in conjunction to boost both your skills and trading balance. We hope, it’s really useful for you, dear traders!
Full Forex scalper StrategyTHis is a FOREX scalping system that can be optimized with almost all majors and crosses pairs.
Its made of multiple elements such as :
MACD
Stochastic RSI
Fast VW moving average
Slow VW moving average
Time management( forex sessions as inputs)
Rules for entry
Long
Last 2 MACD values were ascending, fast moving average is below moving average and stochastic RSI is below 30 level. At the same time we are either into London or NY session.
Short
Last 2 MACD values were descending, fast moving average is above moving average and stochastic RSI is above 70 level. At the same time we are either into London or NY
Rules for exit
WE have 2 exit possibilities: we can exit either at the end of NY/London Session or based on a TP/SL risk management calculating % in movement.
If you have any questions let me know !

EMA StrategyThis is a simple EMA cross strategy. This script was published by CaptJava. I added in the ability to check off a box and allow shorting, the ability to select a back testing date range and also the ability to enter the buy message and sell message in the properties. You then create the webhook alert and put only this in the message:
{{strategy.order.alert_message}}
That will pull in your alert message dynamically.
I may add more features to this over time.

Ichimoku all signalsIchimoku Cloud All Signals!
This indicator shows all Ichimoku Cloud signals for (entering/exiting/confirming/or even staying) in a position.
you can choose a signal related to your strategy and use it.
you can choose which signals to be shown on the chart by changing the settings.
here are some examples of signals that you can get from this indicator:
Crossover/under conversion line & base line
Crossover/under lead line1 & lead line2
Crossover/under conversion line & lead line1
Crossover/under base line & lead line1
Crossover/under conversion line & lead line2
Crossover/under base line & lead line2
Crossover/under close & base line
Cloud Breakouts in both directions!
and 74 signals more !!!!

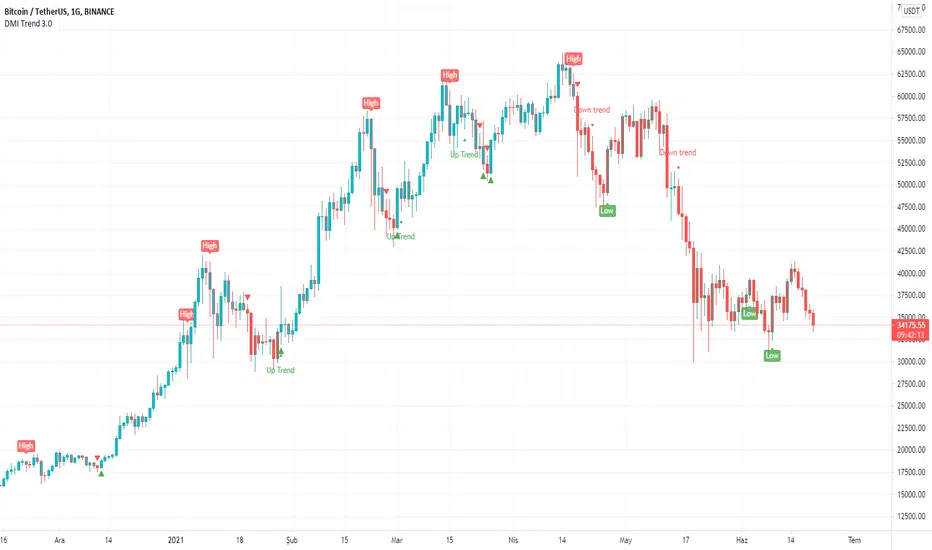
DMI With Crosses (MyNewTrade)Directional Movement Indicator:
+DI and -DI
I changed the color of the bar bars according to the crossed of +DI and -DI . It helps us to have an idea of whether the trend is continuing or not.
+DI crossover to -DI barcolor is Aqua, if not bar color is Red.
It also helps us to find the lowest and highest points of the graph according to the positions of Adx +DI and -DI .
It gives warnings at the lowest and highest points, which helps us to detect the direction of the trend.
MA Cross + Strategy by RealmixTwo Moving Average with crossmarker and strategy when both indicators are crossing for a possible position
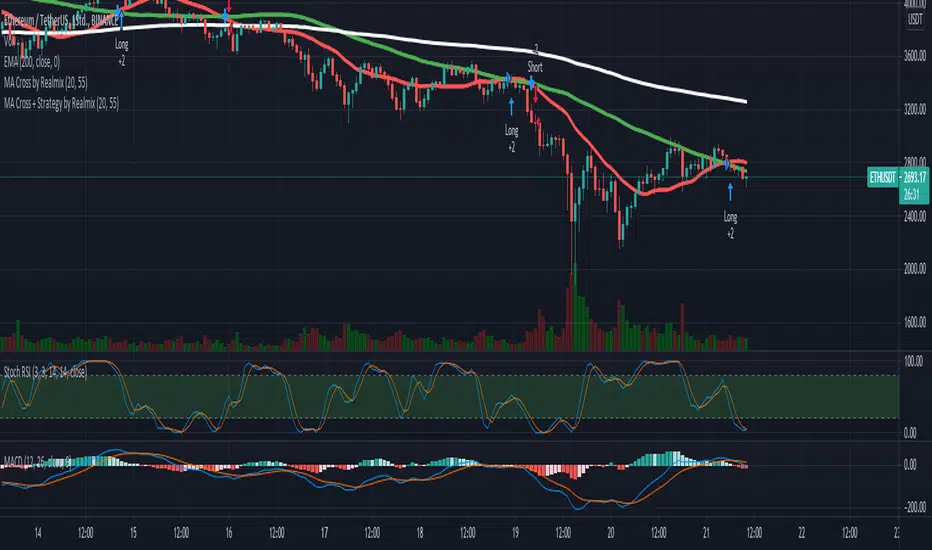
MA Cross by RealmixTwo Moving Average with crossmarker when both indicators are crossing for a possible position

Moving Average Crossover with Shading Signals This script uses 3 moving averages (2 simple moving averages and 1 exponential moving average ) to signal long and short opportunities based on moving average crossovers.
A long SMA (Signal SMA2) is used to determine longer term trend. When the EMA crosses above the Slow SMA1 and price is above the Signal SMA2. The space between the moving averages will shade green and the Signal SMA should also be green.
A sell signal occurs when the EMA crosses below the Slow SMA1 and price is below the Signal SMA2. The space between the moving averages will turn red and the Signal SMA should also be red.
A retracement, consolidation, or reversal may be occurring if the shaded color is yellow.
Use the identifying shapes to learn when to open or close positions.

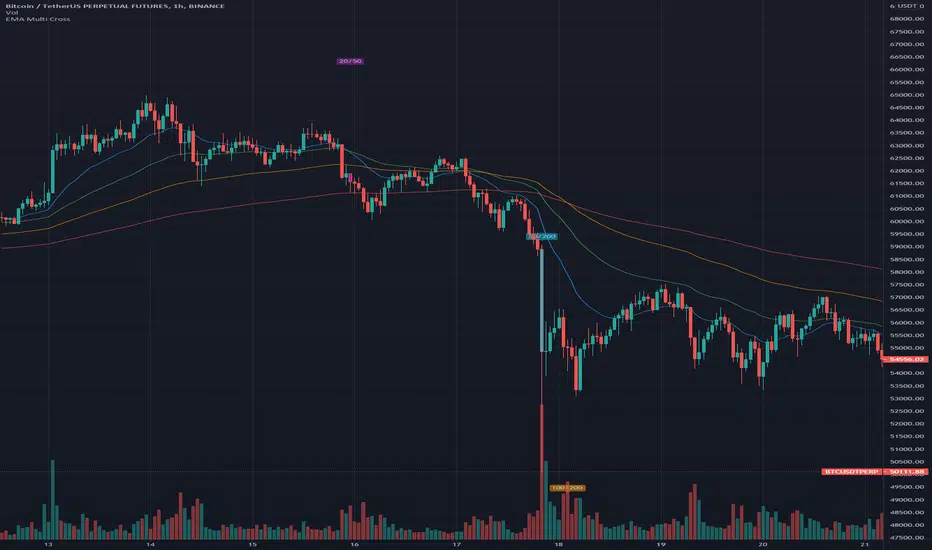
EMA Multi CrossThis is just a very simple EMA indicator that shows the 20, 50, 100, and 200 Exponential Moving Averages and plots some shapes when the lines cross from the 20 & 50, the 50 & 200, and the 100 & 200.
I know there are many EMA indicators out there, but I couldn't find one that let me edit the colors, values, and toggle the crossings. Maybe some of you will find usefulness in having some of these extra options too.
I use this occasionally on the Bitcoin 1 hour charts to see how the long-term trend is going.
Here are some ways to read EMA lines:
Slope: A rising moving average generally reflects a rising trend, while a falling moving average points to a falling trend.
Crosses: Seeing when a slower moving average crosses over/under a faster moving average can be an indication of a trend. If a shorter moving average remains above the longer moving average after they cross, the uptrend is considered intact. The trend is seen as down when the shorter moving average is below the longer moving average.
I prefer the slope of the two since crosses can cause some false positives if you are relying on it for trades.
MACD Moving Average Convergence/Divergence - DurbtradeDurbtrade MACD - macd line changes color based on vertical direction. This makes it easier to see and discern movements and also helps the indicator to retain maximum functionality when taking up less chart real estate (also, having the color change really helps me see charts on small screens... such as when it's bright outside and I'm driving in my car and glancing at a chart on my phone... it helps having the info pop visually). A fill option is included to fill the space between the macd and signal lines, though I personally prefer to disable this function. Also, you get a zero line if you want it, and it doesn't extend past the current time, removing unnecessary info and keeping your chart looking a bit cleaner. Finally, there are color-coded, cross-over and cross-under background fills, signaling when the macd line crosses the signal line.
This is my 2nd published script, and 2nd script ever. If you like this style, see my 1st published script: Durbtrade Bollinger Bands Width.
Hope you find this useful.
Feel free to comment.

Altered True Strength Indicator (TSI) Reupload-
Altered TSI provides a slightly more volatile signal that demonstrates extremities in price action with greater success than standard TSI. In addition, I added bull/bear cross indicators (green/red) to make it easier to notice the crosses to save time when the market is moving fast (I couldn't find a regular TSI script with this addition). Finally, the signal also has overextension parameters (red and green lines)
I think this is best used on Intraday time frames as the signals respond to volatility very well and using Heikin Ashi candles, trend is more visual. In this particular example, I am showing SPY on the 3m time chart (my favorite short time frame) and the signal alone provided many opportunities for trades when using simple divergences and countering overextension direction when short term (blue) signal crosses either
In the first example (purple lines), SPY ramps but it was a dull signal given the signal strength flatlining- we would be looking for a short entry. When the signal fires, it provides a clean $1.50 move down in spy.
In the second example (orange), the blue signal provides a nice V shape (rebound signal) in which we are looking for a long entry. 390.50 is a strong SPY support in confluence with 2nd std dev VWAP extension, but disregarding that bull signal fires resulting in a 2 dollar move upwards. Exit is provided when blue line crosses green overextension.
In the third example (white), we are searching for a short entry at 392.5 resistance in confluence with divergently higher highs. Bear cross signal when fired and a significant cross is visible provides a $2.50 move to the downside with a potential exit provided when blue line crosses red overextension line in confluence with previous LOD area.
In the fourth example (green), we watch as the blue line provides a V pattern, we are searching for a long entry. If you didn't take a riskier long at 2nd std dev VWAP overextension with V recovery on blue line at red overextension for a ride to vwap, then you are looking for a secondary entry long as you wouldn't take the trade at resistance (vwap). Bullishly divergent lows provide this entry and the signal does not bear cross at all (but looking for significant crosses is more important even if the signal were to make a minor bear cross). Bullishly divergent double bottom provides a long entry to end of day with a nice clean signal for a $5.00 move until eod or when signal crosses overextension range.
Ideally, close to the money options or SPY/SPXS/SPXL are best used in the intraday time frame.
Again, this is not a standalone indicator but it's best used in conjunction with other indicators/trading strategies
Any questions feel free to comment

Open Close Cross Strategy plus ExplorerOpen Close Cross Strategy plus Explorer
V 1.0
There is a code that can control sensitivity. try to change 'ATR Multiplier' menu
There is a code for prevent 'repaint'. If you want it check 'Forces Non-Repainting' menu
thanks to
PMax Explorer STRATEGY & SCREENER KivancOzbilgic
Open Close Cross Strategy R5 revised by JustUncleL JustUncleL

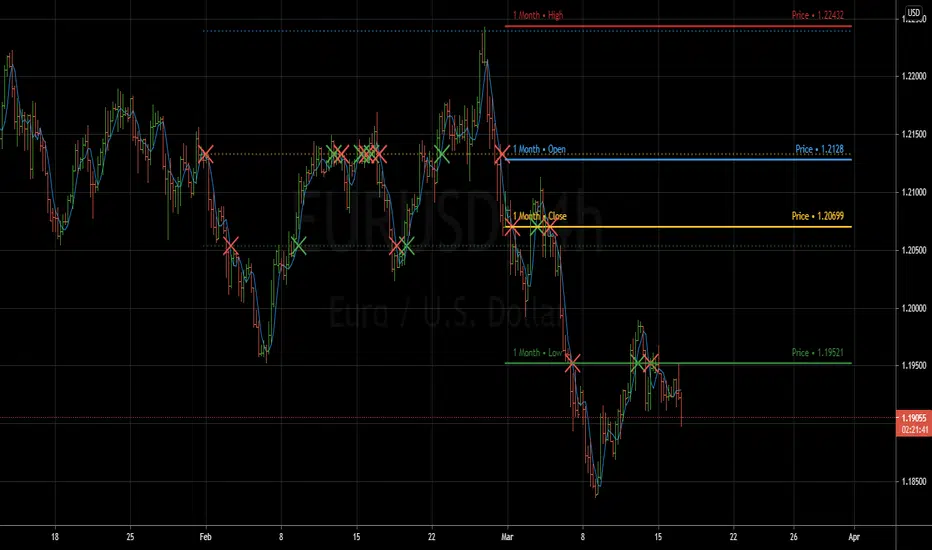
Previous Period Levels - X Alerts====== ABOUT THIS INDICATOR
- A simple but highly customisable display of previous higher time-frame
OHLC values, drawn using line.new and label.new. Nothing fancy but...
- Customised resolution input which excludes time frames lower than 1 hour
while extending the common higher reference inputs to include:
• 6, and 12 Hour
• 5 Day
• 3, and 6 Month
• 1 Year
- Alert conditions using an adjustable SMA to help reduce false positive
spam.
- Full visual customisation options for (almost) every aspect, so it can be
tuned to suit most individual preferences.
- In line with the miriad visual customisation options is the ability to
change the display format of the Labels, to show more or less information,
or disable them altogether.
====== REASON FOR STUDY
- To practice advanced user input option handling to allow for a full visual
customisation experience without stepping outside of, or interfering with,
the intended function of the indicator.
- Provide reasonably clear code commenting and structure in order to be
useful as a potential learning aid for others, and future reference for
myself.
====== DISCLAIMER
Any trade decisions you make are entirely your own responsibility.
I've made an effort to squash all the bugs, but you never know!
EL Relative Strength Index cross - by Epullemanepulleman RSI long and short
probability of uptrend when red cross-up blue (with small yellow dot)

[DS]Entry_Exit_TRADE.V01-StrategyThe proposal of this script is to show the possible trading points of BUY and SELL based on the 15-minute chart of the Nasdaq Future Index. The start point of the strategy was schedule for 2021/01/01 and until the time of this publication (2021/01/31), for 1 index contract the results presented area a Gross Profit of 2.97% with a Net Profit of 1.35%.
█ FEATURES
The indicator shows on the graph the position of the MACD and TSI indicators that are the places of strength among Buyers and Sellers.
It's possible to observe a sharp fall or rise in the price of these positions.
On the current candle, a label is displayed containing the value of the William %R Mod indicator, which will display the OverBought position (dark red) and OverSold position (dark green). The other colors like light red and green are the regions where the price makes the decision of which direction to go.
There are also other indicators:
a) The positions of the BUY (light green) and SELL areas (light red);
b) The label with the position of BUY (dark green) and SELL (dark red) with the line that connects these points;
c) DEMA 72 (orange);
d) EmaOchl4 in the color green for BULL and red for BEAR market;
e) Pivots high and low
f) Maximum (purple light) and minimum areas (blue light)
█ FUNCTIONS AND SETTINGS
The indicator uses the following functions:
(1) DEMA - Double Exponential Moving Average (08,17,34, 72)
(2) ema () - Exponential Moving Averge (72, ohlc4)
(3) plot()
(4) barcolor()
(5) cross()
(6) pivots ()
(7) William R% Md (OverBought = -7, OverSold=-93)
(8) Maximum and Minimum Value
(9) fill()
(10) macd () - Moving Average Convergence Divergence (Fast Lengt=12, Slow Length=26, Source=close, Signal Smoothing=9)
(11) tsi() - Trading Strenght Indicator==> Índice de Força Real ( IFR ) (Long Length=72, Short Length=17, Signal Length=17)
(12) Buy and Sell TRADE Points
█ PERFORMANCE AND ERRORS
The positions of BUY and SELL points are defined through the crossing of the Dema 34 candles with the Ema Ohcl4. As it is an indicator, it can present different positions from de market direction. Thus there is a need to observe the direction of the market in order to verify whether the indicate decision is really acceptable. The decision to BUY or SELL an asset must be well studied to avoid financial losses. The indicator will only help you in this decision, is your responsibility the decision of entering or leaving an asset.
█ THANKS TO
PineCoders for all they do, all the tools and help they provide, and their involvement in making a better community. All the PineCoders, Pine Pros, and Pine Wizards, people who share their work and knowledge for the sake of it and helping others, I'm very happy and grate full indeed.
█ NOTE
If you have any suggestions for improving the script or need help using it, please send a message in the comments

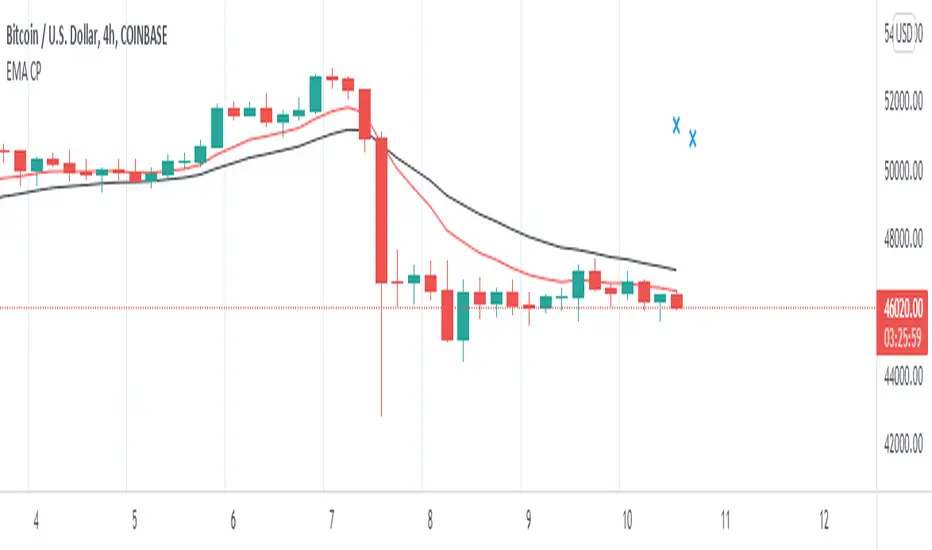
Double EMA CROSS
Double EMA CROSS (DEC)
Useful for identifying and receiving alerts about uptrends and downtrends.
This script uses two Exponential Moving Averages (EMAs) to find price uptrends and downtrends.
An Exponential Moving Average ( EMA ) is a type of moving average that places a greater weight and significance on the most recent data points.
The script produces uptrend and downtrend signals based on crossovers and divergences between the two EMAs,
the user will be able to spot a trend change (when the EMAs crossover) and to determine the strength of the current trend (when the EMAs diverge).
It is also posible to get alerts for uptrends and downtrends on the web and mobile app with sound and pop-ups as well as via email.
The optimal time to enter and exit the market can be concluded from this trend changes.
The user can set their own EMAs, by default they are set to 25 and 75 periods for medium and long term respectively.
When the medium term EMA crosses below the long term EMA the asset is in a downtrend and the price will decline, and when the
medium term EMA crosses above the long term EMA the asset is in an uptrend and price will increase.
This scripts plots the following indicators and signals on the chart to help the user to identify trends:
1.- Medium and long term EMAs as lines overlaid on the price chart.
2.- Up green triangles above bars when the price is on an uptrend and down red triangles below bars when the price is on a downtrend.
3.- Arrows with text to indicate the start of an uptrend or downtrend.
The user can enable and disable the indicators and signals as well as set colors and shapes to their liking.
This script also lets the user create alerts for uptrends and downtrends. To create a new alert using this script follow this instructions:
1.- Once you added this script to your chart, go to the alerts panel (right on web or bottom tool bar on the mobile app) and add a new alert (alarm clock icon with a plus sign).
2.- A modal window will open. On the “Condition” dropdown menu select “DEC”.
3.- On the next dropdown menu (right below the “Condition” one) you can select.
4.- Lastly you can set all the normal alert options and create the alert.

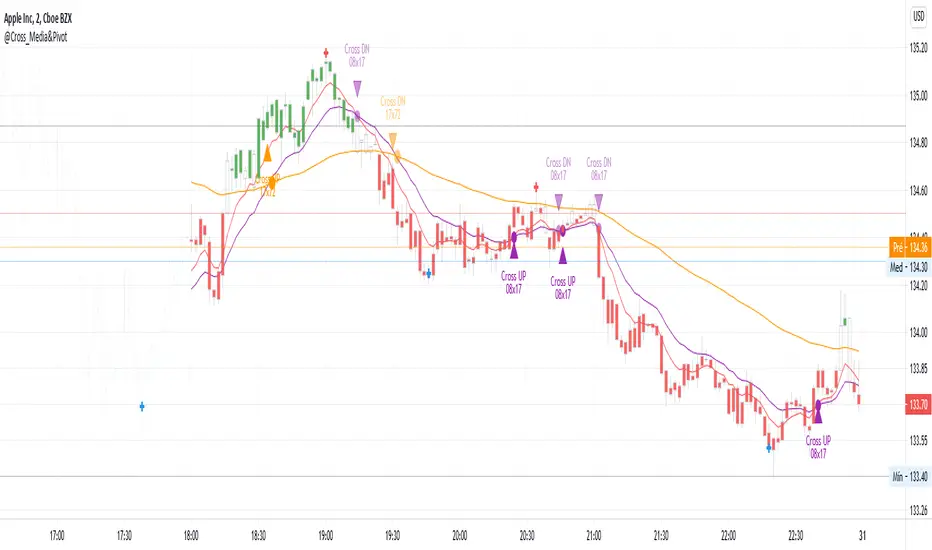
@Cross_Media&Pivot&TRADE_Entry_and_ExitThis script uses the functions plot(), cross(), plotcandle(), pivothigh() and pivotllow(). You can see the candles in the color green, above EMA 72 (Exponetional Move Average), and the color red, below EMA72. You can identify the position of the crossing UP and DOWN of the EMA 08 x EMA 17, EMA 17 x EMA72. You can identify the TRADE ENTRY points with the pivot high and TRADE EXIT with the pivot Low.