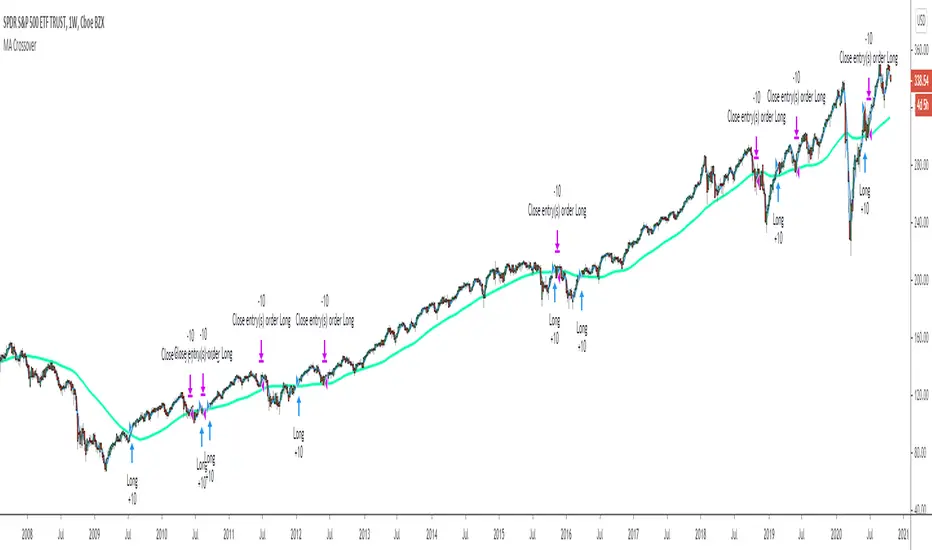
Moving Average Cross Strategy early Closing This is my example for the Moving Average Cross Strategy with early Closing. You can modify the strategy for your individual setup and market.
I tested the strategy in DAX30 and SP55
Crossover
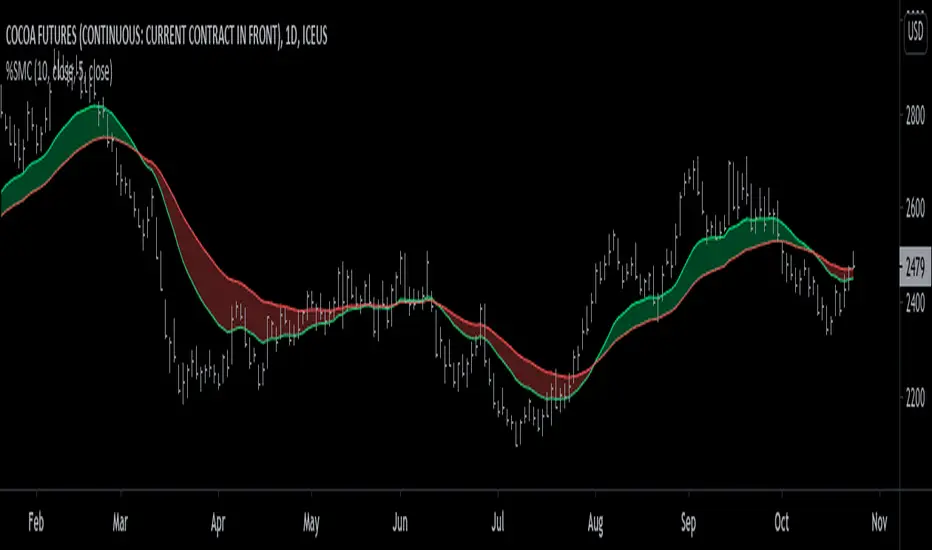
% Sensitivity MA Cross [racer8]This is my third published indicator on % Sensitivity MA, if you're not familiar with it, go check out my first one.
This time its a cross between 2 % Sensitivity MAs.
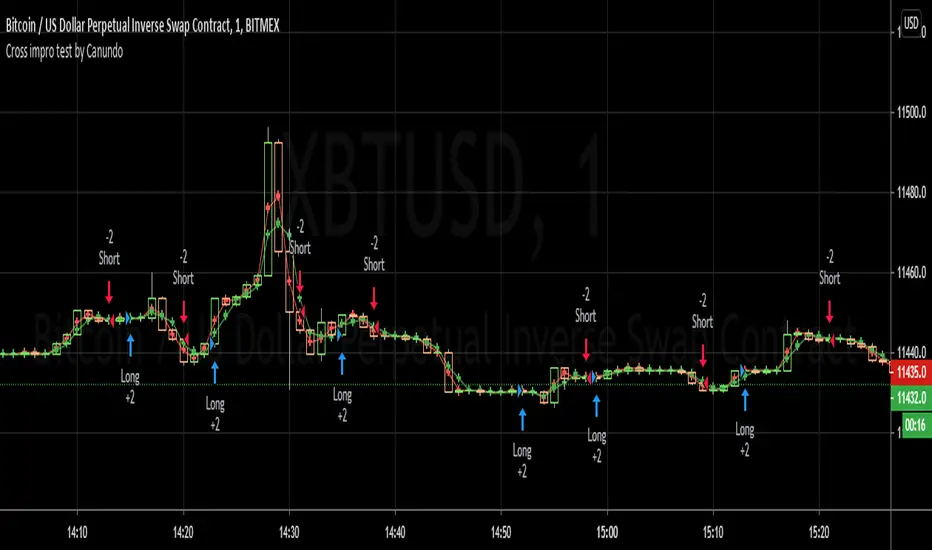
Cross impro test by Canundo Crossover Crossunder Tick valuesThis is a script where I tried to check the following things:
Even thought the tick of an asset is, for example 0.5, there are calculated prices, like SMA's that have even more decimals. Leading to crosses happening that for example happen at the same price. Consequently triggering totally useless in side markets. What happens if SMA values are restricted to the tick resolution? (Option works on it's own or with a combination of the others.)
What happens if I set my own tick value, like 0.8 instead of 0.5, what will be the effect for calculated values that are used for crossings? Will tick sizes improve the success rate? (This option will work only when the first option is active.)
Can success rate, especially for sideway markets be improved when adding a spread between MA's, so that it triggers less in sideway markets? (Option works on it's own or with a combination of the others.)
First of all, I had a hard time to round prices properly when it needs to be dynamic and working for different assets with different amounts of decimal values in the tick. The solution is that abs(floor(syminfo.mintick)) will give you the amount of decimals a tick has. It works for all ticks that are at least lower than 10. I'm not sure how huge ticks are out there. I did not implement this solution at the end since I found another way to test it.
Findings:
The first option, when activated, takes out half the trades and raises the percent profitability by 8% so there is some effect. However, all of the tested options have less advantage than I hoped for but are nevertheless something worthy for sideway markets. The first option just forces the MA's from the example to use the tick resolution.
See these two images. One when the first option is off, the second when it's active.
The lines are the MA's with adjusted values, the crosses are the places of the MA's when left as is.
Here a screenshot of the third option set to the value 2 on the 1 minute XBTUSD chart.
The advantage is that less trades trigger that have a low change in price and so less trading fees will happen.
The disadvantage is that all options can implement some delay for a crossing since the crossing will trigger once a slightly bigger move into the direction was taken.
This test environment was not meant to be profitable but to test the effects.
Maybe someone finds it interesting or wanted to test the same, so here you can save some work.
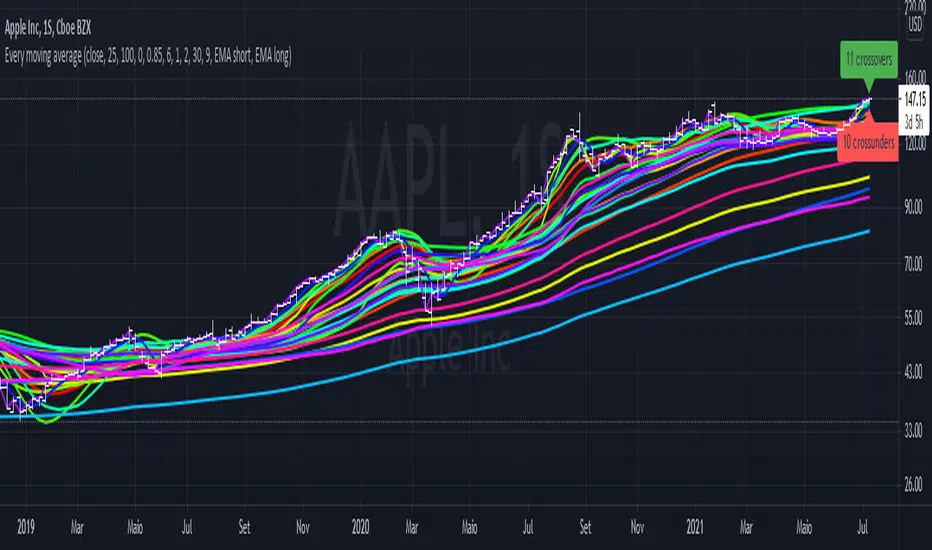
Every single moving average (ALMA, EMA, HMA, KAMA, RMA, SMA...)So you may be looking at the graph and thinking "this is a mess", and I agree.
The purpose of this script is to plot in the same graph every single type of moving average that I could think of, so you can find the ones that are better for your timeframe and for your asset. Once you add it, disable those types that doesn't seem to serve your purpose, until you can select one you like.
The average types are: ALMA, EMA, HMA, KAMA, RMA, SMA, SWMA, VIDYA, VWAP, VWMA, and WMA. Each one is ploted two times (except SWMA and VWAP), one with a short period, and another with a long, both of which you can configure.
Finnie's RSI + 3EMA crossover + MFI + Vix Fix-added a medium and long term rsiEMA, in addition to the previous short term, except this time there's a visual crossover :)
-added CM Williams vix fix
-and finally just a general visual overhaul!

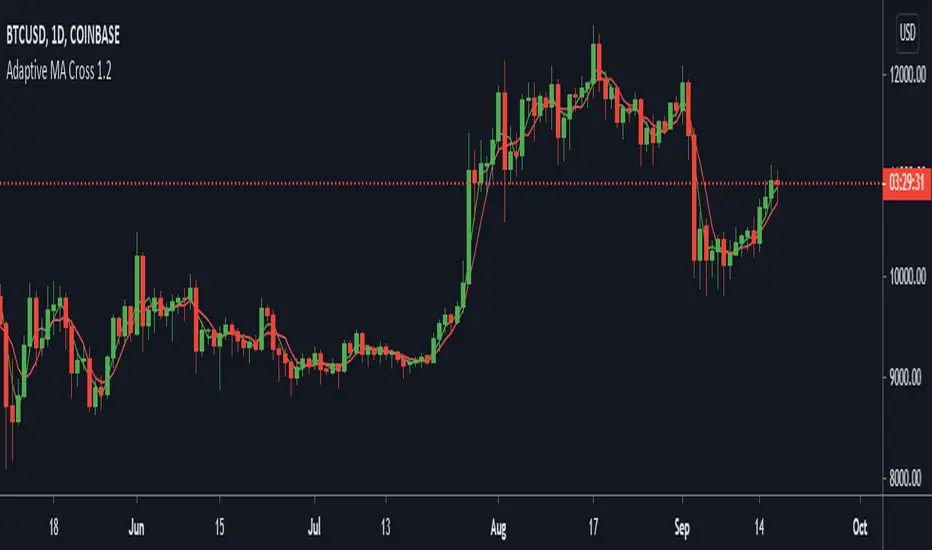
Adaptive MA CrossThis is part 5 of 11 in the system named Ninetales/Volt V2 you can find on Tradingview.
Add three values to test for Fast MA, and three for Slow MA and it will backtest a crossover strategy and show you the most accurate one.
Riley's Movement IndexBrief Description:
Riley's Movement Index is a new indicator developed and named after me.
RMI is quite interesting in that uses two lines to cross each other.
One line represents the bullish side of the market, and the other line represents the bearish side of the market.
A signal occurs when the two lines cross each other.
-------------------------------------------
Calculation:
Up
1. high > prev high?
2. If yes, then Up = (high - prev high)
3. If no, then Up = 0
Dn
1. low < prev low?
2. If yes, then Dn = (prev low - low)
3. If no, then Dn = 0
SumUp (n) = Sum of Up over n periods
SumDn (n) = Sum of Dn over n periods
Plot SumUp & SumDn lines.
-------------------------------------------
How to interpret a signal:
When SumUp > SumDn, market is bullish.
When SumUp < SumDn, market is bearish.
-------------------------------------------
Recommended setting:
I would suggest a setting of 10, the default setting.
-------------------------------------------
Enjoy, and smash that follow button!

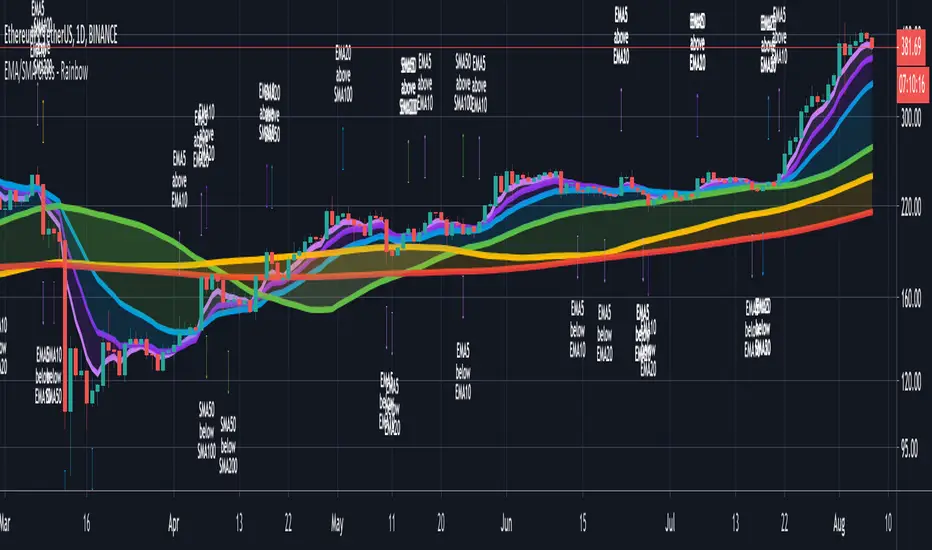
CryptoSignalScanner - Advanced Moving Averages - Cross & RainbowDESCRIPTION:
With this script you can plot 6 moving averages.
You can decide which Moving Average you want to show or hide.
For every plot you can decide to display the Simple Moving Average ( SMA ) or Exponential Moving Average ( EMA ).
It provides CrossOver and CrossUnder labels when loading the script. Those labels you can show or hide.
You have the possibility to show or hide the rainbow colors. This rainbow function gives you a clear view of the current trend.
HOW TO USE:
• When one Moving Average crosses above another Moving Average it signals an uptrend.
• When one Moving Average crosses below another Moving Average it signals a downtrend.
• The higher to length of the Moving Average the stronger the trend.
FEATURES:
• You can show/hide the preferred Moving Averages.
• You can set the length, type and source for every Moving Average.
• You can show/hide the rainbow colors.
• You can show/hide the CrossUp labels.
• You can show/hide the CrossDown labels.
• You can set alerts for every Moving Average.
• Etc...
DEFAULT SETTINGS:
• MA1 => EMA5
• MA2 => EMA10
• MA3 => EMA20
• MA4 => SMA50
• MA5 => SMA100
• MA6 => SMA200
Simple Moving Average vs. Exponential Moving Average:
SMA and EMA are calculated differently. The exponential moving average ( EMA ) focuses more on recent prices than on a long series of data points, as the simple moving average required.
The calculation makes the EMA quicker to react to price changes and the SMA react slower. That is the main difference between the two.
One is not necessarily better than another. It comes down to personal preference. Plot an EMA and SMA of the same length on a chart and see which one helps you make better trading decisions.
Moving Average Trading Strategies:
The first strategy is a price crossover, when the price crosses above or below a moving average, it signals a potential change in trend.
The second strategy applies when one moving averages crosses another moving average.
• When the short-term MA crosses above the long-term MA, it signals a buy signal.
• When the short-term MA crosses below the long-term MA, it signals a sell signal.
REMARKS:
• This advice is NOT financial advice.
• We do not provide personal investment advice and we are not a qualified licensed investment advisor.
• All information found here, including any ideas, opinions, views, predictions, forecasts, commentaries, suggestions, or stock picks, expressed or implied herein, are for informational, entertainment or educational purposes only and should not be construed as personal investment advice.
• We will not and cannot be held liable for any actions you take as a result of anything you read here.
• We only provide this information to help you make a better decision.
• While the information provided is believed to be accurate, it may include errors or inaccuracies.
If you like this script please donate some coins to share your appreciation.
Good Luck,
SEOCO
MACD VWAP IndicatorThis indicator uses a combination of the VWAP, EMA 9 and parts of the MACD in order to detect a bullish or bearish trend.
How to trade it:
Set SL either below or above the VWAP line (orange) and TP to 1:1.5 ratio (depending on last few candles, of course).
If EMA200 is close by then place SL either below or above EMA200 (blue) and TP to 1:1.5 ratio
Important:
Best traded in 15M, 30M => Intraday.
Have fun! :)

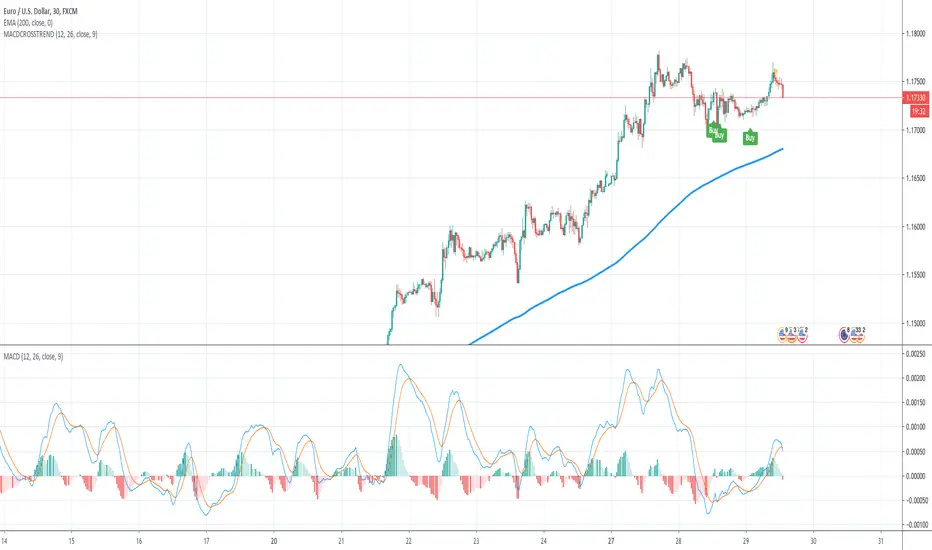
MACD Crossover Trend IndicatorThis is a very simple " the trend is your friend " indicator - if you are consistent!
How this indicator works:
This indicator detects MACD Crossovers based on the current trend. It checks wether the current close price is above or below the 200 EMA and therefore decides whether we are in an up- or down trend.
UP-TREND: If the price is above the EMA200, the MACD is below 0 and crosses up the signal line, then this is a BUY signal!
DOWN-TREND: If the price is below the EMA200, MACD is above 0 and crosses down the signal line, then this is a SELL signal!
You can also add an alert, that keeps you informed, once one of these scenario happens for a certain pair!
With this indicator you will never enter against the trend.
Have fun! :)

MACD Crossover Trend IndicatorHow this indicator works:
This indicator detects MACD Crossovers based on the current trend. It checks wether the current close price is above or below the 200 EMA and therefore decides whether we are in an up- or down trend.
UP-TREND: If the MACD is below 0 and crosses up the signal line, then this is a BUY signal!
DOWN-TREND: If the MACD is above 0 and crosses down the signal line, then this is a SELL signal!
How to trade this:
First rule: Be consistent!
Second rule: You will have lost trades and losing streaks - deal with it!
First set the SL slightly below the last significant low (eventually add/subtract the ATR value to/from it)
Then adjust the TP and ALWAYS use a RR ratio of 1.5.
NEVER get out of the trade earlier
Take every possible trade!
Important: Money management is key... so be consistent!
Have fun! :)
[PX] External LevelHello everyone,
today I'd like to share a script, which enables you to use external logic to plot levels on your chart.
How does it work?
The concept is based on two scripts. One script, which uses an external input as a trigger to print a new level and one script that calculates an output, which will be fetched.
Sounds complicated? It really is not! Let's take a closer look.
// This source code is subject to the terms of the Mozilla Public License 2.0 at mozilla.org
// © paaax
//@version=4
study("RSI OS/OB")
l = input(14, "RSI Length")
ob = input(70, "Overbought")
os = input(30, "Oversold")
r = rsi(close, l)
hline(ob)
hline(os)
plot(r, "RSI", color=color.orange)
// The following plot produces an output, which will be fetched the "External Level"-script.
// It evaluates to one of the following three values: 1.0, -1.0 or 0.0
plot(crossover(r, ob) ? 1.0 : crossunder(r, os) ? -1.0 : 0.0, "Output", transp=100)
The example script above uses an RSI and two threshold levels (70 and 30). The logic here is, that whenever the RSI is crossing down the lower threshold or crossing up the upper threshold we'd consider the current movement to be either oversold or overbought. Therefore, it's a point of interest, which we could visualize with a level.
The script creates an output when the crossover or crossunder of a threshold happens. A crossover would result in a value of 1.0, a crossunder in a value of -1.0. In all other cases the value would be 0.0.
The output of the RSI script would then be used as an input of the External Level script, which has a "Source"-parameter in its input-section. If the fetched input shows 1.0, then the script prints a resistance level. If it shows -1.0 a support level will be printed. And that's basically it. A very simple approach to print levels on your chart with an infinite number of use cases.
For example, you could use fetch outputs from a MACD script, MA script, outputs based on volume or price movement. Just remember the output has to evaluate to either 1.0 or -1.0 and has to be selected in the input-section.
Hope that might be useful to some of you :)
Please click the "Like"-button and follow me for future open-source script publications.
If you are looking for help with your custom PineScript development, don't hesitate to contact me directly here on Tradingview or through the link in my signature :)

MA Crossover IndexJust 3 Moving Averages with adjustable settings, plus signals crossover between price and MA Media.
Types of MAs supported:
SMA, EMA, WMA, VWMA, SMMA, DEMA, TEMA, Hull/MA, ZEMA, TMA, SSMA
The signal is given when the price crosses the MA Average.
The random line only works on indices, it indicates that if the price exceeds it, the continuation of that movement is possible.
Option to place TP and SL recommended only on Indices.

MultiType Shifting Predictive Moving Averages (MA) CrossoverJust 2 Moving Averages with adjustable settings and shifting capability, plus signals and predicting continuations.
At the time of publish these different types of MAs are supported:
- SMA (Simple)
- EMA (Exponential)
- DEMA (Double Exponential)
- TEMA (Triple Exponential)
- RMA (Adjusted Exponential)
- WMA (Weighted)
- VWMA (Volume Weighted)
- SWMA (Symmetrically Weighted)
- HMA (Hull)
I'm looking forward to any idea about filtering the signals. Thanks.

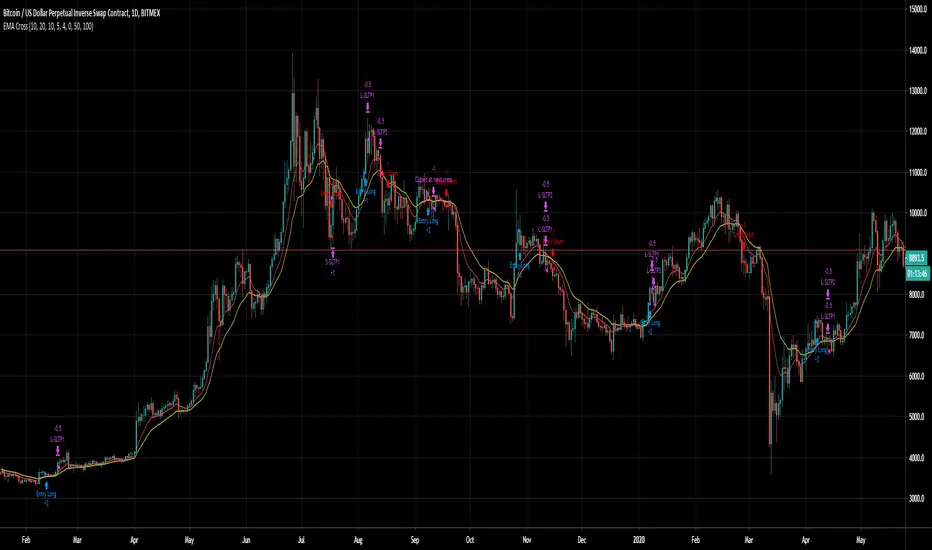
EMA Cross
Uses EMA crosses as a signal for entry.
Configurable first TP profit level
Stop moves up to entry after first TP
Option to use ROC and Price Gap as filters to entries
Jackrabbit.modulus.StochasticThis is the Stochastic for the Jackrabbit suite and modulus framework.
This indicator supports differential timeframe analysis and confirmational bias. Dynamic timeframes are supported.
This is an updated view of Stochastic and supports traditional overbought/sold boundaries and cross over regions.
The main indicatior and the confirmational indicator can both be individually tuned for the %K, and %D moving averages with different and independent lengths and 30 different moving average types:
SMA, Double SMA, Triple SMA,
EMA, Double EMA, Triple EMA,
RMA, Double RMA, Triple RMA
WMA, Double WMA, Triple WMA,
VWMA, Double VWMA, Triple VWMA,
Hull, Double Hull, Triple Hull,
ZLEMA, Double ZLEMA, Triple ZLEMA,
SWMA, Double SWMA, Triple SWMA,
SSMA, Double SSMA, Triple SSMA,
SMMA,Double SMMA, Triple SMMA
The Jackrabbit modulus framework is a plug in play paradigm built to operate through TradingView's indicator on indicatior (IoI) functionality. As such, this script receives a signal line from the previous script in the IoI chain, and evaluates the buy/sell signals appropriate to the current analysis. The results are either combined with the signal line, or used as confirmation to the signal line. A new signal line is generated for the next script in the link.
This script is not designed or meant to function outside my framework and contains no alert capabilities.
By default, the signal line is visible and the charts are turned off. Signal line visibility is controlled by the Style tab, and the charts display is controlled by the indicator settings tab.
This script is by invitation only. To learn more about accessing this script, please see my signature or send me a PM. Thank you.

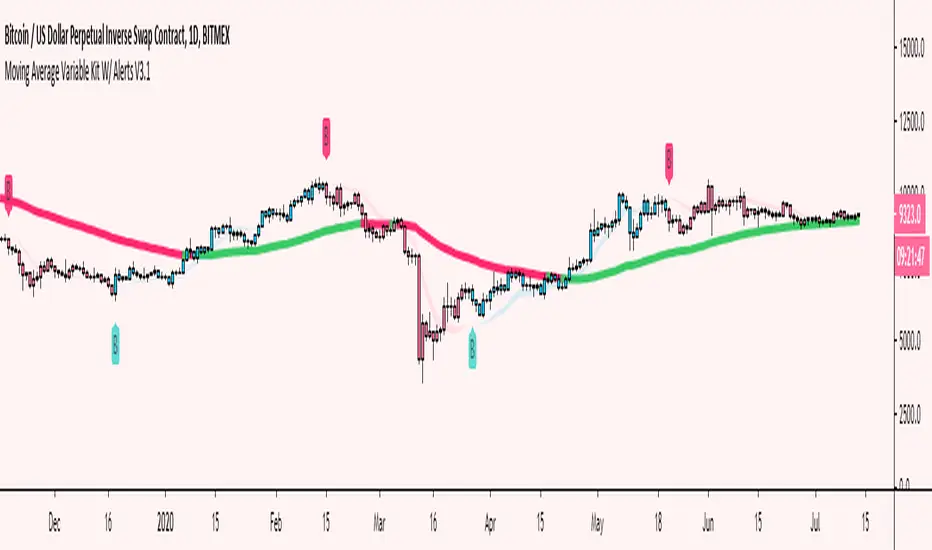
Moving Average Variable Kit W/ Alerts V3 [Moon]Create your own MA system
5 basic kinds of Moving Average types available for now
DEMA
EMA
SMA
TEMA
WMA
Mix and match moving average types and lengths.
Create your own alerts built into Tradingview.
Turn alerts or MAs off or on with 1 click.
Choose visual transparency and alert coloration - everything is customizable.
Trend candles on crossovers.
Choose your MA input source.
Create your own MA cloud or cloud ribbons.
Trend MA coloration on candle or bar interactions.
It really empowers you to experiment and create your own trading system or strategy.
Don't be afraid to use Renko or Heikin Ashi for trend spotting or reversals.
Copy built in exchange bands or indicators for an edge up on the competition or exchange users (these are heavily watched and in my opinion do affect the price action especially on smaller coins like alts).
This is Binance's default kit that you can easily make (7/25/99) SMAs.
Works well on traditional markets or Forex | Should be cross compatible on any asset or timeframe.
Turn off a majority of signals except for "buy" or "sell" alerts. Use these clusters to DCA, short, long or take profit.
Use it to monitor classic "Golden" or "Death" crosses - Set a TV alert to get a notification when it official goes off.
These are just a few of the things you can create. I encourage you to explore further.
Send me a DM if interested.
EMA Crossover StrategyEMA Crossover Strategy
This strategy will enter a long trade when the 21 EMA crosses over the 55 EMA and both EMAs and the close price are above the 200 EMA (long-term trend).
It will enter a short trade when the 21 EMA crosses under the 55 EMA and both EMAs and the close price are below the 200 EMA.
It will exit a long trade when the RSI crosses under from overbought and indicates that the uptrend could be coming to an end.
It will exit a short trade when the RSI crosses over from oversold and indicates that the downtrend could be coming to an end.
Backtesting shows that it works best on:
30 MIN:
SYMBOL - PROFIT FACTOR
AUDCAD - 1.126
EURJPY - 1.12
EURNZD - 1.04
EURUSD - 1.65
GBPAUD - 1.27
USDCAD - 1.08
1 HR:
SYMBOL - PROFIT FACTOR
CADJPY- 1.23
EURNZD- 1.166
GBPJPY- 1.23
GBPUSD- 1.282
NZDJPY- 1.246
USDCHF- 1.344
3 HR:
SYMBOL - PROFIT FACTOR
CADCHF- 1.975
EURGBP- 1.776
EURNZD- 1.911
GBPAUD- 1.364
GBPCHF- 1.311
USDJPY- 1.162
XAUUSD - 2.00
As always, this strategy does not guarantee you to achieve profits and you should always use confirmations before entering a trade.

Donchian Channel CloudsFor this indicator, I got inspired by this paragraph in an article on Investopedia:
"Donchian channels also make natural partners with another moving average indicator for a crossover strategy. The Donchian moving average middle line is likely to form the short-term average in these situations, although some have used a 20-day Donchian channel in conjunction with a five- or 10-day channel to exit a position before a consolidation eats into short-term profits."
The default is a 20-period Donchian channel with the middle line from a 10-period channel superimposed on it. Red for 20, green for 10. When 10 is over 20, the cloud between them is green; the cloud is red when 20 is over 10.

Combo Backtest 123 Reversal & EMA & MA Crossover This is combo strategies for get a cumulative signal.
First strategy
This System was created from the Book "How I Tripled My Money In The
Futures Market" by Ulf Jensen, Page 183. This is reverse type of strategies.
The strategy buys at market, if close price is higher than the previous close
during 2 days and the meaning of 9-days Stochastic Slow Oscillator is lower than 50.
The strategy sells at market, if close price is lower than the previous close price
during 2 days and the meaning of 9-days Stochastic Fast Oscillator is higher than 50.
Second strategy
The Moving Average Crossover trading strategy is possibly the most popular
trading strategy in the world of trading. First of them were written in the
middle of XX century, when commodities trading strategies became popular.
This strategy is a good example of so-called traditional strategies.
Traditional strategies are always long or short. That means they are never
out of the market. The concept of having a strategy that is always long or
short may be scary, particularly in today’s market where you don’t know what
is going to happen as far as risk on any one market. But a lot of traders
believe that the concept is still valid, especially for those of traders who
do their own research or their own discretionary trading.
This version uses crossover of moving average and its exponential moving average.
WARNING:
- For purpose educate only
- This script to change bars colors.

EMA BREAKOUT WITH TP OR SL [NLB]Hello Everyone,
Its Indicator Base On two exponential moving average (EMA) crossover You can Also Choice any input when EMA cross we are plots High and low
Indicator Feature
➤ Long Side Signal With Alerts
➤ Short Side Signal With Alerts
➤ Long side Take profit Calculated By Open Bar You Can Also Change Calculate Bar Source and percentage input
➤ Short side Take profit Calculated By Open Bar You Can Also Change Calculate Bar Source and percentage input
➤ Long side stop loss
➤ Short side stop loss
Important: This Indicator we are using for Automation Trading if You Want This Indicator Access Please Contact me PM on Tradingview

Moving Averages Convergence (Agulhada do Didi)The script is based on a strategy developed by Odir “Didi” Aguiar called “Agulhada do Didi”.
It consists in the use of 3 moving averages:
SMA 3
SMA 8
SMA 21
Strategy:
When the averages come together, preferably they pass through a candle, there is a signal. The crossing of the short average (3) with the long average (21) provides us with a confirma-tion of the entry.
Buy:
The average of 3 periods comes out on top, 8 goes in the middle and 21 goes down.
Sell:
Average of 21 periods comes out on top, 8 in the middle and 3 down.
PRIMEVAL_SERIES_0001.0 - Hyper-bullish EMA SequenceThe Primeval Series is the domain of combinations between EMAs of any specific length that apparently dictates the fabric of equity price movements. For best use, the 45-minute timeframe is ideal for short-term, explosive plays.
The series can be split into major and minor sub-series, i.e., "Epoch" and "Triassic." Epoch EMAs refer to the lengths of 618 periods and 1618 periods - these are the averages that denote major directional shifts when they cross each other on any timeframe. The Triassic EMAs are the 21, 62, and 186 lengths of any timeframe that offer incredible directional insight when they interact with the Epoch EMAs.
Triassic EMAs' seldom interact with Epoch EMAs intraday. However, their interactions with each other can be useful for quick swing trades. After discovering these oddly specific EMA lengths, my study and application of their interactions have increased my understanding of markets ten-fold. I hope they do for you as well.
Aside from the EMA lines themselves, I have created colored background lines for specific crossovers that seem to follow a bullish sequence. I have annotated the sequence in the script itself, but will also include here for ease of use. See below for more details:
Hyper-bullish EMA Sequence:
1) For best use, look for charts that are in a long-term bullish trend and have pulled back over the last 2 months.
2) Once such a stock has been identified, set the chart timeframe to 45 minutes, and apply the script.
3) The sequence begins on the nearest AQUA colored crossover. This denotes the beginning of the most-local retracement from near-term (could be all-time) highs.
4) Then, find the next ROYAL BLUE crossover background line for a potential entry. If I were tracking a stock that just displayed a ROYAL BLUE crossover, I would enter 1/4th of my planned full position.
5) Next, search for the next crossover highlighted in DARK BLUE. This is the key crossover. Enter your full position, as it is a very strong bullish confirmation signal.
6) Hold the long position until you see the penultimate GREEN crossover line. In certain cases, this is the final confirmation for the uptrend and denotes an extension upward. I would not add here, but would alternatively take 1/3rd of my profits.
7) If you take 1/3rd of your profits, you can ride the extension knowing that the trade is profitable regardless. House money trades are my favorite trades for this reason.
8) The toughest part is selling the remaining 2/3rds of your position, but there is a solution: when you see the first RED crossover line after GREEN, sell half of your remaining position. The price could come down a bit but would hold the remaining position until the next RED line appears.
**IMPORTANT: This strategy assumes that there is only ONE AQUA line at the very beginning of any given sequence. If there appears another AQUA line at any point in the sequence, SELL ALL. That is the only hard rule and is extremely unlikely to occur after a DARK BLUE cross. Keep in mind that some charts are so bullish that a GREEN LINE may never appear because the price action is so far above the Epoch_Zero EMA (yellow EMA ) that it will not be a factor for some time. Lastly, most RED crossover lines are insignificant until the GREEN line appears. Even then, they are only potential places to sell. AQUA lines are most meaningful and if you see one occur after a GREEN line, exit immediately.
Before you use this strategy, backtest it in the following way: pick any bullish stock over the past 3 months and see how the sequence pans out. I have done this over 100 times and it has worked 100 times WHEN you follow the rules listed in the "IMPORTANT" section above. Once validated, use this as a powerful weapon during bullish times.
Good luck and I hope this can make the world profitable someday.
- Perma H. Pig
