Nabz-BBMACD-2022-V1.1I have tried to make script which triggers indicators on combination of different feedback including Bollinger bands and MACD. Also used some of my logic by trial and error, It gave 744%+ profit on back-testing on coin RUNE/USDT from Jan 2021. It is my first script, I am happy to help the community. Please share your feedback.
Mata Wang Kripto

Oversold RSI with tight SL Strategy (by Coinrule)This is one of the best strategies that can be used to get familiar with technical indicators and start to include them in your trading bot rules.
ENTRY
1. This trading system uses the RSI ( Relative Strength Index ) to anticipate good points to enter positions. RSI is a technical indicator frequently used in trading. It works by measuring the speed and change of price movements to determine whether a coin is oversold (indicating a good entry point) or overbought (indicating a point of exit/entry for a short position). The RSI oscillates between 0 and 100 and is traditionally considered overbought when over 70 and oversold when below 30.
2. To pick the right moment to buy, the strategy enters a trade when the RSI falls below 30 indicating the coin is oversold and primed for a trend reversal.
EXIT
The strategy then exits the position when the price appreciates 7% from the point of entry. The position also maintains a tight stop-loss and closes the position if the price depreciates 1% from the entry price. The idea behind this is to cut your losing trades fast and let your winners ride.
The best time frame for this strategy based on our backtesting data is the daily. Shorter time frames can also work well on certain coins, however in our experience, the daily works best. Feel free to experiment with this script and test it on a variety of your coins! With our backtesting data a trading fee of 0.1% is taken into account. The fee is aligned to the base fee applied on Binance, which is the largest cryptocurrency exchange by volume. In the example shown, this strategy made a handsome net profit of 39.31% on Chainlink with 61.54% of trades being profitable.

Sideways Strategy DMI + Bollinger Bands (by Coinrule)Markets don’t always trade in a clear direction. At a closer look, most of the time, they move sideways. Relying on trend-following strategies all the time can thus lead to repeated false signals in such conditions.
However, before you can safely trade sideways, you have to identify the most suitable market conditions.
The main features of such strategies are:
Short-term trades, with quick entries and quick exits
Slightly contrarian and mean-reversionary
Require some indicator that tells you it’s a sideways market
This Sideways DMI + Bollinger Bands strategy incorporates such features to bring you a profitable alternative when the regular trend-following systems stop working.
ENTRY
1. The trading system requires confirmation for a sideways market from the Directional Movement Index (DMI) before you can start opening any trades. For this purpose, the strategy uses the absolute difference between positive and negative DMI, which must be lower than 20.
2. To pick the right moment to buy, the strategy looks at the Bollinger Bands (BB). It enters the trade when the price crosses over the lower BB.
EXIT
The strategy then exits when the move has been exhausted. Generally, in sideways markets, the price should revert lower. The position is closed when the price crosses back down below the upper BB.
The best time frame for this strategy based on our backtest is the 1-hr. Shorter timeframes can also work well on certain coins that are more volatile and trade sideways more often. However, as expected, these exhibit larger volatility in their returns. In general, this approach suits medium timeframes. A trading fee of 0.1% is taken into account. The fee is aligned to the base fee applied on Binance, which is the largest cryptocurrency exchange.

Three EMAs Trend-following Strategy (by Coinrule)Trend-following strategies are great because they give you the peace of mind that you're trading in line with the market.
However, by definition, you're always following. That means you're always a bit later than your want to be. The main challenges such strategies face are:
Confirming that there is a trend
Following the trend, hopefully, early enough to catch the majority of the move
Hopping off the trade when it seems to have run its course
This EMA Trend-following strategy attempts to address such challenges while allowing for a dynamic stop loss.
ENTRY
The trading system requires three crossovers on the same candle to confirm that a new trend is beginning:
Price crossing over EMA 7
Price crossing over EMA 14
Price crossing over EMA 21
The first benefit of using all three crossovers is to reduce false signals. The second benefit is that you know that a strong trend is likely to develop relatively soon, with the help of the fast setup of the three EMAs.
EXIT
The strategy comes with a fixed take profit and a volatility stop, which acts as a trailing stop to adapt to the trend's strength. That helps you get out of the way as soon as market conditions change. Depending on your long-term confidence in the asset, you can edit the fixed take profit to be more conservative or aggressive.
The position is closed when:
The price increases by 4%
The price crosses below the volatility stop.
The best time frame for this strategy based on our backtest is the 4-hr. Shorter timeframes can also work well, although they exhibit larger volatility in their returns. In general, this approach suits medium timeframes. A trading fee of 0.1% is taken into account. The fee is aligned to the base fee applied on Binance, which is the largest cryptocurrency exchange.

Optimised RSI strategy for Reversals (by Coinrule)The most common way to use the RSI to spot a good buy opportunity is to check for values lower than 30. Unfortunately, the RSI can remain in oversold territory for long periods, and that could leave you trapped in a trade in loss. It would be appropriate to wait for a confirmation of the trend reversal.
In the example above I use a short-term Moving Average (in this case, the MA9) coupled with an RSI lower than 40. This combination of events is relatively rare as reversal confirmations usually come when RSI values are already higher. As unusual as this setup is, it provides buy-opportunities with much higher chances of success.
The parameters of this strategy would be:
ENTRY: RSI lower than 40 and MA9 lower than the price
TAKE PROFIT and STOP-LOSS with a ratio of at least 2. That means that if you set up a take profit of 3%, your stop-loss shouldn’t be larger than 1.5%.
The advantage of this approach is that it has a high rate of success and allows you the flexibility of setting up the percentages of the take profit and stop-loss according to your preferences and risk appetite.

Fukuiz Octa-EMA + Ichimoku (Strategy)This strategy is based EMA of 8 different period and Ichimoku Cloud which works better in 1hr 4hr and daily time frame.
#A brief introduction to Ichimoku #
The Ichimoku Cloud is a collection of technical indicators that show support and resistance levels, as well as momentum and trend direction. It does this by taking multiple averages and plotting them on a chart. It also uses these figures to compute a “cloud” that attempts to forecast where the price may find support or resistance in the future.
#A brief introduction to EMA#
An exponential moving average ( EMA ) is a type of moving average (MA) that places a greater weight and significance on the most recent data points. The exponential moving average is also referred to as the exponentially weighted moving average . An exponentially weighted moving average reacts more significantly to recent price changes than a simple moving average ( SMA ), which applies an equal weight to all observations in the period.
#How to use#
The strategy will give entry points itself, you can monitor and take profit manually(recommended), or you can use the exit setup.
EMA (Color) = Bullish trend
EMA (Gray) = Bearish trend
#Condition#
Buy = All Ema (color) above the cloud.
SELL= All Ema turn to gray color.

Oversold RSI with Tight Stop-Loss Strategy (by Coinrule)KRAKEN:LINKUSD
This is one of the best strategies that can be used to get familiar with technical indicators and start to include them in your rules on Coinrule .
ENTRY
1. This trading system uses the RSI (Relative Strength Index) to anticipate good points to enter positions. RSI is a technical indicator frequently used in trading. It works by measuring the speed and change of price movements to determine whether a coin is oversold (indicating a good entry point) or overbought (indicating a point of exit/entry for a short position). The RSI oscillates between 0 and 100 and is traditionally considered overbought when over 70 and oversold when below 30.
2. To pick the right moment to buy, the strategy enters a trade when the RSI falls below 30 indicating the coin is oversold and primed for a trend reversal.
EXIT
The strategy then exits the position when the price appreciates 7% from the point of entry. The position also maintains a tight stop-loss and closes the position if the price depreciates 1% from the entry price. The idea behind this is to cut your losing trades fast and let your winners ride.
The best time frame for this strategy based on our back testing data is the daily. Shorter time frames can also work well on certain coins, however in our experience, the daily works best. Feel free to experiment with this script and test it on a variety of your coins! With our back testing data a trading fee of 0.1% is taken into account. The fee is aligned to the base fee applied on Binance, which is the largest cryptocurrency exchange by volume. In the example shown, this strategy made a handsome net profit of 52.6% on Chainlink with 66.67% of trades being profitable.
You can execute this strategy on your favorite exchanges with Coinrule .

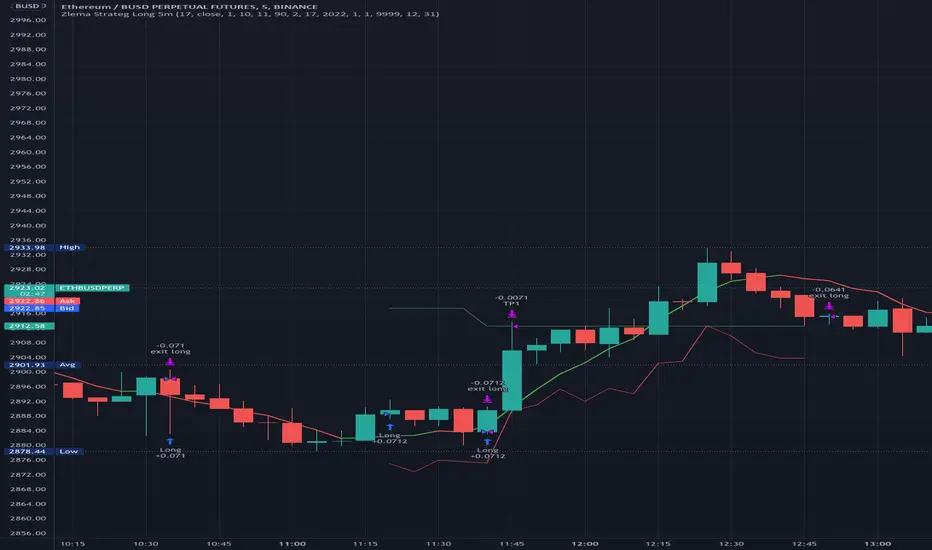
Zlema Strateg Long 5mJust putting this out there.
I created this Strategy based on Everget Zlema.
Opens long trade when Zlema changes color.
It is profitable as it is, but just putting it out to the community to see if someone else has ideas to make it better.
How to make this strategy better?
1. FInd a way to filter ranging bad trades.
2. Trades would be more profitable if entry point had an entry on the candle the zlema changes color.
3. I had to put TP 5 limit, but the optimal would be when the zlema changes color back to red (if ranging trades can we filtered that is).
In any case, just putting it out there, hope it is useful for someone, and I am open to suggestions.
Follow the Crypto ShortsThis script allows to test the impact of variations in the number of BTCUSD Shorts Positions on its price. In particular, it compares the number of short positions with its moving average to decide if shorts are being liquidated. In case the number of short positions crosses below its moving average, it will generate a Long Position, which will be closed if shorts crosses above its moving average.

Mayer Multiple StrategyCreated by Trace Mayer, the Mayer Multiple is calculated dividing the current price of Bitcoin by its 200-day moving average. This simple script allows to backtest strategies based on Mayer Multiple levels, which can be easily adjusted. It can be tested on any chart and any timeframe.

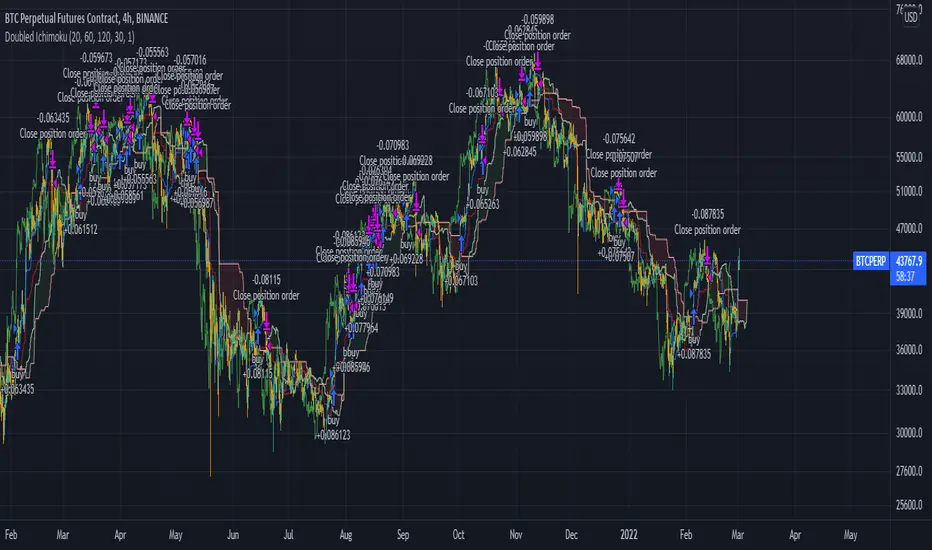
Ichimoku 4H crypto strategy -- LONG ONLYThis is a LONG ONLY strategy for 4h timeframe of any Cryptocurrency/USD pairs. The strategy opens only 1 position at a time with the following conditions.
Open Long Position when:
1. Closed price above cloud AND
2. Green cloud ahead AND
3. Conversion line above Baseline AND
4. Lagging span above cloud and price action AND
Close trade when:
1. Lagging span gets below price action or cloud OR
2. Price gets inside the cloud OR
3. Price gets below baseline
You can use it on a lower timeframe at YOUR OWN RISK. My optimal timeframe is 4 Hour candles.
Cheers.
TFO + ATR Strategy with Trailing Stop LossThis strategy is an experiment to learn what happens when The Trend Flex Oscillator (by Dr. John Ehlers) is used in conjunction with a volatility indicator like ATR. It was designed with cryptocurrency trading in mind.
The way I coded this experiment makes it unsuitable for bear market conditions.
When applied to a bull market, this trend-following strategy will open long positions when oversold price action appear to be reversing. It will typically close a position within a few days unless it gets caught in a bear market, in which case it holds on for dear life. I have tried to make back-testing very simple, but you should never trust it. It's merely and interesting tool for adjusting the many parameters that I've made editable in the configuration window. Those values include the ATR and TFO parameters, as well as setting a trailing stop loss. When closing a position, the strategy can optionally be told to ignore the trend analysis and only obey the trailing stop loss value. I've made an attempt to allow the user to define the minimum profit necessary to allow the strategy to close all all positions. In my observations, the 2H candlestick charts seem to produce the best results, although the parameters of the strategy could theoretically be adjusted to suit other time periods.
In summary...
This strategy has a bias for HODL (Holds on to Losses) meaning that it provides NO STOP LOSS protection!
Also note that the default behavior is designed for up to 15 open long orders, and executes one order to close them all at once.
Opening a long position is predicated on The Trend Flex Oscillator (TFO) rising after being oversold, and ATR above a certain volatility threshold.
Closing a long is handled either by TFO showing overbought while above a certain ATR level, or the Trailing Stop Loss. Pick one or both.
If the strategy is allowed to sell before a Trailing Stop Loss is triggered, you can set a "must exceed %". Do not mistake this for a stop loss.
Short positions are not supported in this version. Back-testing should NEVER be considered an accurate representation of actual trading results.
// portions © allanster (date window code)
// portions © Dr. John Ehlers (Trend Flex Oscillator)
This code is provided for educational purposes only. The results of this strategy should not be considered investment advice.
The user of this script acknowledges that it can result in serious financial loss when used as a trading tool

MZ SRSI Strategy V1.0Strategy Introduction
This strategy starts from selection of 1st Moving Average from one of following:
SMA
EMA
DEMA
TEMA
LRC
WMA
MF
VAMA
TMA
HMA
JMA
Kijun v2
EDSMA
McGinley
Then it calculates the RSI of selected 1st Moving Average
In the end it calculates Moving Average of previously calculated RSI and for this purpose 2nd Moving Average is also selected from above list.
Cross of RSI and its Moving Average generates Strategy Alerts
Only long trades are enabled currently
Default Settings
I've set the default selection to the perfect options for 1D and 4h timeframes. You can modify both MAs selection and their length according to your selected timeframe.
Following default settings are used:
Heiken Ashi Candles are selected by default as source
1st Moving Average selection is set to LRC (Linear Regression Curve)
Length of 1st Moving Average is set to 50
RSI length is set to 2 because it is supposed to be fast
2nd Moving Average of RSI is set to TMA (Triangular Moving Average)
Length of 1st Moving Average is set to 5
Start date is set to 2011
Backtesting can also be done selecting %age of equity
Suggestions for Usage
Mostly winning trades have no prominent drawdown so losing trades can be abolished with Stoploss. Would soon add Stoploss, MTF and Takeprofit options in next version. Also if you want an alerts version of it then just comment below and would publish it later. I’ve found this strategy useful on 1D and 4h timeframes with described default settings.

Double SupertrendThis strategy is based on a custom indicator that was created based on the Supertrend indicator. At its core, there are always 2 super trend indicators with different factors to reduce market noise (false signals).
The strategy/indicator has some parameters to improve the signals and filters.
TECHNICAL ANALYSIS
☑ Show Indicators
This option will enable/disable the Supertrend indicators on the chart.
☑ Length
The length will be used on the Supertrend Indicator to calculate its values.
☑ Dev Fast
The fast deviation or factor from one of the super trend indicators. This will be the leading indicator for entry signals, as well as for the exit signals.
☑ Dev Slow
The slow deviation or factor from one of the super trend indicators. This will be the confirmation indicator for entry and exit signals.
☑ Exit Type
It's possible to select from 4 options for the exit signals. Exit signals always take profit target.
☑ ⥹ Reversals
This option will make the strategy/indicator calculate the exit signals based on the difference between the given period's highest and lowest candle value (see Period on this list). It's displayed on the chart with the cross. As it's possible to verify in the image below, there are multiple exit spots for every entry.
☑ ⥹ ATR
Using ATR as a base indicator for exit signals will make the strategy/indicator place limit/stop orders. Candle High + ATR for longs, Candle Low - ATR for shorts. The strategy will show the ATR level for take profit and stick with it until the next signal. This way, the take profit value remains based on the candle of the entry signal.
☑ ⥹ Fast Supertrend
With this option selected, the exit signals will be based on the Fast Supertsignal value, mirrored to make a profit.
☑ ⥹ Slow Supertrend
With this option selected, the exit signals will be based on the Slow Supertsignal value, which is mirrored to take profit.
☑ Period
This will represent the number of candles used on the exit signals when Reversals is selected as Exit Type. It's also used to calculate the gradient used on the Fills and Supertrend signals.
☑ Multiplier
It's used on the take profit when the ATR option is selected on the Exit Type.
STRATEGY
☑ Use The Strategy
This will enable/disable the strategy to show the trades calculations.
☑ Show Use Long/Short Entries
Option to make the strategy show/use Long or Short signals. Available only if Use The Strategy is enabled
☑ Show Use Exit Long/Short
Option to make the strategy show/use Exit Long or Short signals (valid when Reversals option is selected on the Exit Type). Available only if Use The Strategy is enabled
☑ Show Use Add Long/Short
Option to make the strategy show/use Add Long or Short signals. With this option enabled, the strategy will place multiple trades in the same direction, almost the same concept as a pyramiding parameter. It's based on the Fast Supersignal when the candle fails to cross and reverses. Available only if Use The Strategy is enabled
☑ Trades Date Start/End
The date range that the strategy will check the market data and make the trades
HOW TO USE
It's very straightforward. A long signal will appear as a green arrow with a text Long below it. A short signal will appear as a red arrow with a text Short above it. It's ideal to wait for the candle to finish to validate the signal.
The exit signals are optional but give a good idea of the configuration used when backtesting. Each market and timeframe will have its own configuration for the best results. On average, sticking to ATR as an exit signal will have less risk than the other options.
☑ Entry Signals
Follow the arrows with Long/Short texts on them. Wait for the signal candle to close to validate the entry.
☑ Exit Signals
Use them to close your position or to trail stop your orders and maximize profits. Select the exit type suitable for each timeframe and market
☑ Add Entries
It's possible to increase the position following the add margin/contracts based on the Add signals. Not mandatory, but may work as reentries or late entries using the same signal.
☑ What about Stop Loss?
The stop-loss levels were not included as a separated signal because it's already in the chart. There are some possible ideas for the stop loss:
☑⥹ Candle High/Low (2nd recommend option)
When it's a Long signal from the entry signal candle, the stop loss can be the Low value of the same candle. Very tight stop loss in some cases, depending on the candle range
☑⥹ Local Top/Bottom
Selecting the local top/bottom as stop loss will give the strategy more room for false breakouts or reversals, keeping the trade open and minimizing noises. Increases the risk
☑⥹ Fast Supertrend (1st recommend option)
The fast supertrend can be used as stop-loss as well. making it a moving level and working close to trail stop management
☑⥹ Fixed Percentage
It's possible to use a fixed risk percentage for the trades, making the risk easier to control and project. Since the market volatility is not fixed, this may affect the accuracy of the trades
☑⥹ Based on the ATR (3rd recommend option)
When the exit type option ATR is selected, it will display the take profit level for that entry. Just mirror that value and put it as stop-loss, or multiply that amount by 1.5 to have more room for market noise.
EXAMPLE CONFIGURATIONS
Here are some configuration ideas for some markets (all of them are from crypto, especially futures markets)
BTCUSDT 15min - Default configuration
BTCUSDT 1h - Length 10 | Dev Fast 3 | Dev Slow 4 | Exit Type ATR | Period 50 | Multiplier 1
BTCUSDT 4h - Length 10 | Dev Fast 2 | Dev Slow 4 | Exit Type ATR | Period 50 | Multiplier 1
ETHUSDT 15min - Length 20 | Dev Fast 1 | Dev Slow 3 | Exit Type Fast Supertrend | Period 50 | Multiplier 1
IOTAUSDT 15min - Length 10 | Dev Fast 1 | Dev Slow 2 | Exit Type Slow Supertrend | Period 50 | Multiplier 1
OMGUSDT 15min - Length 10 | Dev Fast 1 | Dev Slow 4 | Exit Type Slow Supertrend | Period 50 | Multiplier 1
VETUSDT 15min - Length 10 | Dev Fast 3 | Dev Slow 4 | Exit Type Slow Supertrend | Period 50 | Multiplier 1
HOW TO FIND OTHER CONFIGURATIONS
Here are some steps to find suitable configurations
select a market and time frame
enable the Use This Strategy option on the strategy
open the strategy tester panel and select the performance summary
open the strategy configuration and go to properties
change the balance to the same price of the symbol (example: BTCUSDT 60.000, use 60.000 as balance)
go back to the inputs tab and keep changing the parameters until you see the net profit be positive and bigger than the absolute value of the drawdown
in case you can't find a suitable configuration, try other timeframes
Since the tester reflects what happened in the past candles, it's not guaranteed to give the same results. However, this indicator/Strategy can be used with other indicators as a leading signal or confirmation signal.

Bagheri IG Ether v2In this version, the winning ratio has been decreased, but the Risk to Reward Ratio (RRR) has been set to be better than the previous version.
This is a technical trading strategy for Ethereum ( BINANCE:ETHUSDT ). We built and developed it on MetaEditor and optimized it with MetaTrader optimizer.
The main indicators are Donchian Channel, Oscillator of ROC , Bears Power, Balance of Power , and Simple Moving Average ( SMA ). Default values in the input panel are the best combination of these indicators, but you can change any of them and try it for better results.
Please notice that this strategy has been optimized on the 1-minute chart of Ethereum .
For each position, you can see the Take Profit (TP) and Stop Loss (SL) levels. Also, you can find the values of mentioned TP and SL in points from the input panel of the script.
Attention: The price of Ethereum has 2 decimal places.
Therefore, 3000 points for TP means 30 USDT for trading 1 BINANCE:ETHUSDT .

WEEKLY BTC TRADING SCRYPTWeekly BTC Trading Scrypt(WBTS)
This script is only suggested for cryptocurrencies and weekly buying strategy which is long term.Using it in another markets(e.g forex,stock,e.t.c) is not suggested. The thing makes it different than other strategies we try to understand bull and bear seasons and buying selected crypto currency as using formula if weekly closing value crossover eight weeks simple moving avarage buy,else if selected crypto currency's weekly closing value crossunder eight weeks simple avarage sell. Eight week moving avarage is also uses weekly closing prices but for being able to use this strategy ,trading pair must have more than eight candles in weekly chart otherwise the 8 weeks simple moving avarage value cannot be calculated and script does not work.
This script has a chart called WBTS and it has following features:
Strategy group consist of 3 inputs:
1)Source: Close by default. Our whole strategy uses close values. You can change it but not suggested.
2)Loss Ratio: Because of the cases like the circumstances that manipulates market or high volatility , sometimes graphic show wrong buying signals and this ratio saves user from big money looses(Note : This ratio will always work when selling condition occurs to make user take his profit or prevent him to loss more money because of a wrong positive comes from the indicator.)
3)Reward Ratio : When selling condition happens it will exit user with more profit(if price is already higher than buying point) otherwise it will dimunish loss a bit(if user is below of buying point) or prevents looses(if user is in buying point when selling condition happened.
MA group consist of 2 inputs:
COLOR:Specifies color of the moving avarage.It is equal to #FF3232by hex color code by default.
LINE WIDTH: Specifies linewidth of the moving avarage. It is 2 by default.
GRAPHIC group consist of 2 inputs:
COLOR: It specifies the color of the line which consist of weekly closing prices. It is equal to #6666FF hex color code by default.
LINE WIDTH: Specifies linewidth of the line which consist of weekly closing prices. It is 2 by default.
STRATEGY EXECUTION YEAR: It will show the orders,profits and looses done by script after the input year giving in it.It is 2020 by default.
The last feature is strategy equity,it is not in one of these groups. User should click on settings button on the WBTS indicator than chose Style section and there is a deactivated check box near in the plot section if user activate it, the equity line will show in indicator's graph.
Logic of This Strategy:The story of this strategy began when I studied BTC's price movement from 2020 to today with 8 weeks simple moving avarage (it takes weekly closes as source) and weekly clossing values. I understood that there was a perfect interest between bull and bear market and following conditions:
buy_condition=crossover(weekly_closing_values,8_week_simple_moving_avarage)
sell_condition=crossover(weekly_closing_values,8_week_simple_moving_avarage)
and I tried same thing on the same and bigger time frames("for example i studied how the strategy works from the beginning to today with bitcoin and what is our final equity") with bitcoin and other cryptocurrencies and this made me saw better the relation between giving conditions and general market psychology, however I also witnessed some wrong positives coming by script and used a risk reward ratio to save user and set risk reward ratio 1/3 after a research.
For both conditions(buy_condition and sell_condition),when they are realised,script will alert users and an order will be triggered.
Before finishing the description,from settings/properties/ user can set initial capital,base currency,order size and type,but it is 100000 for initial_amount and 1 contract for order size by default.
In backtesting I used the options like the following example :
Initial capital=1000
Base_curreny=USD
Order size=40 USD
Properties place must set different by every single user according to his or her capital and order size must not be higher than his total money because this script is not the best or a good script for derivatives. It is only written for long term-crypto spot trading and I strongly recommend to users that margin may cause bad results and please do not use it with any margin or any market different than crypto market.
Thank you very much for reading)

Traffic Lights Strategy4HS Crypto Market Strategy
This strategy uses 4 ema to get Long or Short Signals
Length are: 4, 9, 18, 100
We take long positions when the order of the emas is the following:
green > yellow > red (As the color of Traffic Lights) and they are above white ema (Used as a filter for long positions)
We take short positions when the order of the emas is the following:
green < yellow < red (As the color of inverse Traffic Lights) and they are below white ema (Used as a filter for short positions)
Enable Long and/or Short Positions in settings
Enable Profit and Stop in strategy settings with different percentage to backtest the strategy. Also if it is better to use a Traditional Stop Loss or a Trailing Stop Loss based on ATR
Change ema filter resolution in settings for better strategy performance
This Strategy was tested on Crypto Market with good results in assets as BTC, ETH, BNB, ADA, LTC, XLM, BCH, among others
Feel free to optimize this strategy, optimizing its parameters. Each asset has its own "personality".

Bagheri IG EtherThis is a technical trading strategy for Ethereum ( BINANCE:ETHUSDT ). We built and developed it on MetaEditor and optimized it with MetaTrader optimizer.
The main indicators are Donchian Channel, Oscillator of ROC, Bears Power, Balance of Power, and Simple Moving Average (SMA). Default values in the input panel are the best combination of these indicators, but you can change any of them and try it for better results.
Please notice that this strategy has been optimized on the 1-minute chart of Ethereum.
For each position, you can see the Take Profit (TP) and Stop Loss (SL) levels. Also, you can find the values of mentioned TP and SL in points from the input panel of the script.
Attention: The price of Ethereum has 2 decimal places.
Therefore, 3000 points for TP means 30 USDT for trading 1 BINANCE:ETHUSDT .

Chaikin Money Flow + MACD + ATRHere I present you on of Trade Pro's Trading Idea: Chaikin Money Flow + MACD + ATR.
This strategy is not as profitable as it can be seen in one of his videos. In the forex market, the strategy could reach a maximum of 35% profitability.
I have, as some of my followers have requested, created an overview of the current position, risk and leverage settings in the form of a table.
Furthermore, one can again swap between short and long positions.
It is now possible to select or deselect individual indicators.
I have chosen the ATR alone as a take profit stop loss, as in his strategy.
A position is only triggered as soon as all prerequisites have been fulfilled and a command is executed. This prevents false triggering by bots and repainting.
-----------------------------------------------------------------------------------
How does the strategy work?
ENTRY
Long
The MACD indicator must be above the zero line.
Then the K line must cross the D line.
Finally, when this happens, the Money Flow Index must be above the zero line.
Short
Contrary to the premise of long positions.
EXIT
ATR Exit
The value of ATR at the time of buying is multiplied by the value entered in "Profit factor ATR" and "Stop factor ATR". As soon as the price reaches this value, it is closed.
Important
The script must be optimized for each coin or currency pair.
I will publish a guide to the strategy shortly. There I will explain how the table works and how to set the strategy correctly.
The results of the strategy are without commissions and leverage.
If you have any questions or feedback, please let me know in the comments.

MACD EMA - TradingRush StrategyHey there!
Today I present you a rather simple, but very profitable MACD strategy. Since I trade it with cryptocurrencies, the settings have been adjusted.
I discovered the strategy on a YouTube channel and tried to transfer it as a strategy into a script.
Tested with the crypto pair ETH/USDT in the 15 minute chart.
There is the possibility to switch between short and long positions.
-----------------------------------------------------------------------------------
How does the strategy work?
ENTRY
The MACD indicator must cross below the histogram. If it crosses when the price is below the EMA, only short positions are traded. Above the EMA - long.
EXIT
The Lowest Low (long) / highest high (short) serves as the stop loss. The TP is formed on the basis of a factor. (SL multiplied by factor 2.1 = TP).
The red lines are used to illustrate the SL. Above for short positions below for long positions.
The results of the strategy are without commissions and levers.
If you have any questions or feedback, please let me know in the comments.
If you need more information about the strategy and want to know exactly how to apply it, check out my profile.
I wish you good luck with the strategy!

EMA RSI ATR Hidden Div Strat - 1 MinHey there!
Hereby I present you the EMA RSI Lowest Low Hidden Divergence strategy, which I discovered on a youtube channel.
He has tested the strategy hundreds of times manually, herewith I try to automate the whole thing.
Since I use the strategy with a bot, it can only enter long positions for now. But in the future I will add the possibility to trade short positions.
The strategy was tested with BTC/ USDT in 1m chart (8 days). The values must be adjusted depending on the timeframe and coin.
-----------------------------------------------------------------------------------
How does the strategy work?
First of all, we need a bullish hidden divergence.
Once this is detected, the following parameters are checked:
The 50 EMA must cross the 250 EMA .
Then, the candle must close above the 50 EMA .
The K line of the RSI STOCH indicator need to crosses the D line.
If the next candle closes above the 50 EMA , a long position is opened.
The stop loss is determined with the "lowest low/highest high lookback".
The profit factor is multiplied by the value of the lowest low/highest high lookback.
The results of the strategy are without commissions and levers.
If you have any questions or feedback, please let me know in the comments.
In the future I will add other types of stop loss / take profits. (ATR; %; eg.)
I wish you good luck with the strategy!

Ichimoku EMA RSI - Crypto only long StrategyHey there!
Here I show you an Ichimoku Cloud Strategy.
I discovered the strategy on a YouTube channel and tried to transfer it as a strategy into a script.
He said in his video that you would make more profit with this strategy than holding the coin.
Tested with the crypto pair ETH/USDT in the four hour chart.
Period: beginning of 2017 until today.
The strategy should also work with foreign exchange. But then the settings have to be adjusted.
There is the possibility to activate two EMA's and a Stochastic RSI .
-----------------------------------------------------------------------------------
How does the strategy work?
ENTRY
The green Ichimoku lead line must above the red Ichimoku lead line - only the two lead lines are activated.
A green candle must closed above the green lead line.
EXIT
A red candle must close below the green Ichimoku lead line.
OPTIONAL ENTRY
EMA
Once you activate the EMA , long positions will only be taken once the EMA1 is above the EMA2.
Thereby I could observe a significant increase of the profit as well as a decrease of the maximum drawdown.
RSI
As soon as you activate the Stochastic RSI , long positions are only taken when the K line is above the D line.
In the future, I may add an oversold - undersold parameter.
The results of the strategy are without commissions and levers.
If you have any questions or feedback, please let me know in the comments.
If you need more information about the strategy and want to know exactly how to apply it, check out my profile.
I wish you good luck with the strategy!

Reversal with Bollinger Bands + RSI + ADX + ATR (Upgraded)Hi,
Welcome to my 4th script.
Someone asked me some questions about the Bollinger Band strategy I previously published. When I went back to my published script I couldn't help myself but simply try and make it better. Which I did.
Since I've published that script, I've gained much more knowledge about how Pinescript functions. As well as gaining more and more knowledge about how the markets are structered etc.
In this reversal script we use 4 indicators to determine good entry signals, we determine whether the market is ranging or trending and we still only want to take trades in the direction of the "trend".
Bollinger Bands are used for our entry signal. When price hits either side of the band, we wait for a reverse candlestick before we enter a position.
RSI is used to determine if we're in a trending market or in a ranging market. You can adjust the values in the inputs. You can determine the minimum RSI value and the maximum RSI value.
ADX is used the same way as RSI, you can adjust the value in the inputs. You can determine the minimum ADX value.
Last but not least we use two EMA's, a 200 EMA and 100 EMA. Both are adjustable through the inputs. I used two EMA's because I noticed when using this strategy that we'd enter a new position often after having a bad trade. Using two EMA's might clean up some signals, in my case with EUR/USD on a 15m timeframe, it didn't clean up enough signals.
All the default values are pretty decent but might require some finetuning on a certain instrument. Don't overfit the strategy though, that'll only give you bad signals in the future.
Then we are off to our exit signals.
Initially I wanted to incorporate my previous Bollinger Band exit signals as well, but it was too much of a hassle to make the script work as intended so I left it out. If you want to use those exit signals, just find my other script.
When we're in a position and price crosses the opposite band, we wait for a reverse candlestick before we exit the position.
Additionally we want our losses to be as small as possible, so we use RSI to signal us when the market is, or starts to, trend against us. This is where you use the minimum and maximum exit values. So when RSI crosses over or under that value, it'll exit the position.
Furthermore, we use the ATR indicator to set our stop loss, which is pretty basic stuff. You can adjust the ATR multiplier in the inputs. Disabling "Use Trailing Stop?" is really inadvisable unless you know this script inside out as your only exit signals will be opposite Bollinger Band Cross and RSI overbought / oversold areas.
