WMHA IndicatorFinalized name of my new indicator - WMHA - is now for sale for $40, on a monthly subscription basis. A free 15 day trial is offered for this indicator as well. This indicator can be used on timeframes above 5 minutes and below 4 hours. On a two week mock portfolio run, the indicator was 76% successful when placing a 0.69% stop-loss. That is right, a stop loss less than 1%. The two week mock portfolio yielded 75% profit compared to your initial trading stack value, and a 15% yield of profit for overall equity. This was using no leverage. With such a successful test run, utilizing such a low stop-loss, one could use 3x-10x leverage when using this indicator to make their profits grow exponentially and successfully. More videos of the WMHA Indicator will be posted shortly, if you have any interest in subscribing to my indicator, shoot me a PM.
As always, trade on.
James
Cryptotrading

EdgeAnalysisGroup: Fibbonaci BarsPrivate Message me for more info and EAG Scripts
-------------------------------------------
Colored bars based on EAG Fib MA script.
Potentials:
colorA changes to colorB going down = Open Short or Short Continuation
colorA changes to colorB going up = Open Long or Long Continuation
colorA changes to colorB and the next bar is colorA = Reversal Pattern
Based if used with the Yume Wave or a crypto modified RSI indicator
to determine the likelyhood of color reverse or breakout

Spectro™ M by HypesterThis is the commercial version of the Spectro™ M
The new BADASS Spectro™ M
Ok, I gotta say this is so cool that I've been dying to write this release note, we're really proud with the amazing features we are releasing and the fact we could deliver them without raising the prices.
Spectro™ Alerts New Settings
The classic and loved entry/exit point finder, and now you can set the Spectro™ Alerts to your own preferences from aggressive to the safest triggering style. So now it can adapt to any trading style easily, from minute-leveraged scalping to yearly positions.
Spectro™ Indicator (Pro 8X Indicator )
This is the Spectro™ brain, and before this update, it was an indicator that was worth extra $10, but now we decided to implement it on the M version for free! Knowing how Spectro™ is behaving will give you an edge when forecasting entry/exit points.
Spectro™ Direction Change Alerts
A life saver, subscriber's words not mine. Spectro™ plots warning signs when it detects possible trend changes before they happen!
Spectro™ Multi-Resolution
Another heavily requested feature, now you can check buy/sell alerts from other timeframes on your chart. Let's say you're trading on 5M but you only want the strongest signals, so you set your custom timeframe to 15M. Or if you are trading a 12H timeframe and you are sure of a reversal and you're trying to catch the bottom so you play around with the custom resolution around 30M~2H for a more reactive triggering.
Or you might just want to confirm if you have a buy on the Daily before proceeding, that's a smart way to check the mid-range trend.
Specter Clouds
This is dope. I wish I could be more polite but this is as badass as it gets. This awesome new feature will tell you when the price is growing or decreasing out of the "organic" area, therefore, it will warn that whatever you're seeing, you shouldn't. In plain English: It means a reversal is coming.
But it doesn't only warns you about reversals several bars before, it also forecasts the future price targets for the respective reversal!
Also, the coloring of the cloud helps you find the bottom/top, the very beginning of the following reversal.
X Algo Confirmations
This is practical as ****! We know you guys are always checking other indicators to improve your odds so we decided to do it for you, but faster, better and more precise. We called it X because it checks so many indicators that we just called it X.
This is a proprietary blend weighted average between several indicators, you can name all the common ones...STOCH, RSI, STOCH RSI, BB, DMI, ATR, MFI, OBV, CCI, MFI, DPO, MACD, EMO, TSI, Elliot Waves, Fractal Patterns, Fibonacci LEVELS...well you get it... plus 3 proprietary indicators on the conservative mode. Now speaking English: We check up to 20 indicators for you and deliver it in a way that all it takes is one second to check ALL of them.
It also has an aggressive, moderate and conservative mode. The difference is just the amount indicators we check for you, more confirmations you need, more conservative you are.
Trend Analyser 2.0
We offer 3 types of TA. A brand-new proprietary price-based trend analyzer that warns you about violent price change and corrections, an MA blend good for scalping and spotting trend reversals and a classic fully customizable MA crossing.
Spectro offers you 8 different types of the most popular moving averages for the custom mode, from Simple Moving Averages to Fractal Moving Averages - so that creates 64 basic trend analyzer options. You can change the lookback (length) period, time frame resolution, and more. Resulting in a very flexible, simple to use and powerful trend analyzer with endless customization options.

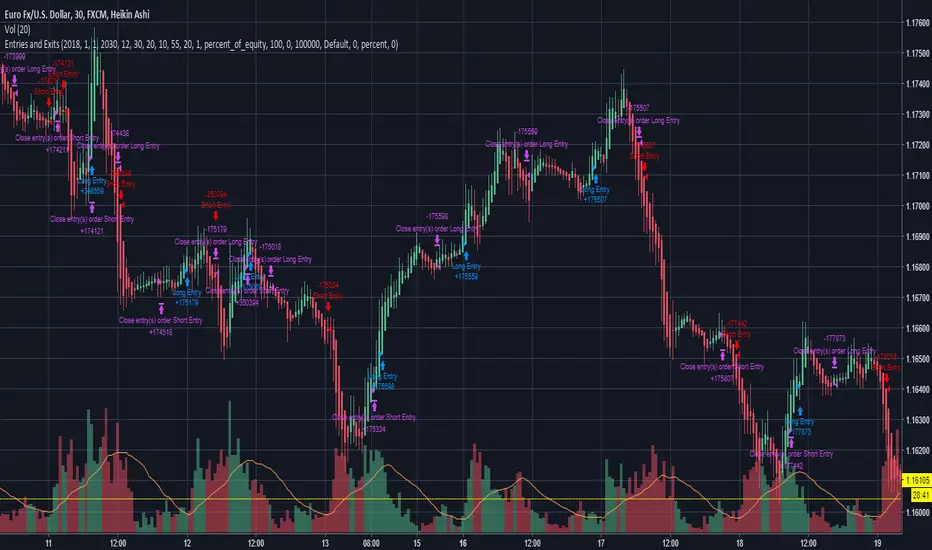
Entries and Exits (plus alerts)Simple breakout strategy that can be used for most equities, FOREX and cryptocurrencies. Inputs can be customized to suit your trading style and can be applied to any time frame chart. Comes with matching alert indicator which is useful for autotrading or just simply never missing a trade for manual trading. Please message me for access. Happy trading!
loscuentosdelacryptoThe stories of the crypto indicate possible areas to enter or exit with crossings of macd
Recommendations of this indicator
Use and compare with macd crossovers and the distance direction
Use zoom in the candle chart to see all the signs
Do not operate in lateral
Use temporality 15 minutes.
To request access I like it and send your request I will deliver it without cost
Español:
Los cuentos de la crypto indica posibles zonas en donde entrar o salir cumpliendo con cruces de macd
Recomendaciones de este indicador
Usar y comparar con cruces de macd y la direccion de la distancia
Usar zoom en el grafico de velas para poder ver bien todas las señales
No operar en lateral
Usar temporalidad 15 minutos.
Para pedir acceso dele me gusta y enviar su solicitud se lo entregare sin costo

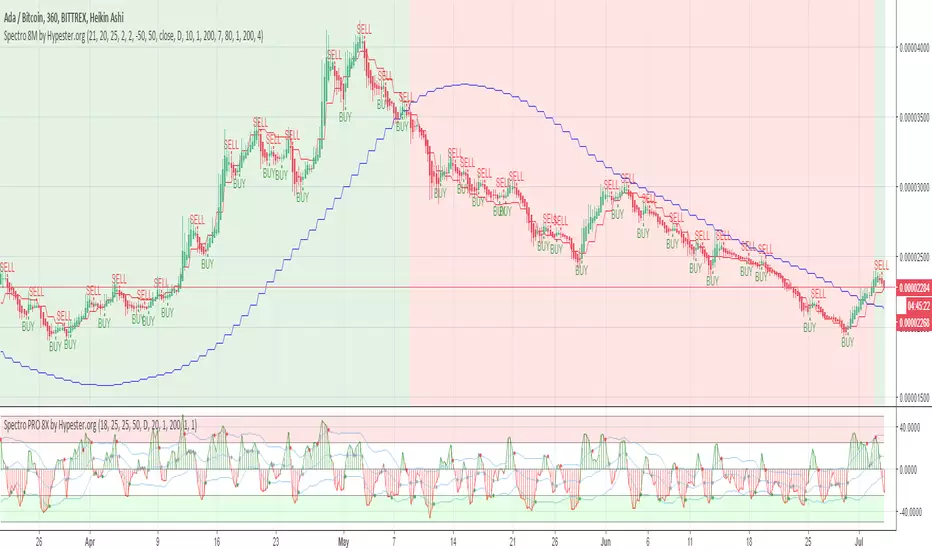
Spectro PRO 8X by HypesterThis is the new Spectro™ Pro 8X update including the following features:
✓ Auto renews Each Month
✓ Cancel Any Time & No Extra Fees
✓ Works With Market, Asset & Timeframe
✓ Entry/Exit Points Alerts
✓ Direction Change Warnings
✓ Noise Reduction
✓ Trend Analyser w/ Multiple Resolutions
✓ 8 Types of Moving Average Crossings
✓ Fine Tuning Panel
(Available on Pro 8X only - )
✓ Fine Tuning Advanced Visual Tools
✓ Dynamic Triggering System
✓ Bollinger Band® Triggering System
✓ Highly Customizable For Maximum Precision
SignalToSignal.com Volume Trend AdvisorThe Signal to Signal Volume Trend Advisor is a proprietary volume and priced-based trend predictor. Leveraging over 20 years of volume-price trading and systems development, we utilize proprietary Volume Spread Analysis ( VSA ) concepts and internal market dynamics to alert you visually and in real time of an imminent trend change.
The indicator was developed to keep autonomous trading systems on track while a trader is away from their charts. While it is meant to be used in conjunction with other trading systems and methods as a filter or as confluence, VTA also stands strongly on its own.
The trend analysis algorithm indicates trend changes visually and in realtime based on static, non-lagging market information. This means that the Volume Trend Advisor does not and cannot repaint, ensuring any signal received is valid and actionable.
Large moves are captured and even trades that result in a small loss when taken to the next signal generally move some significant amount in the direction of the signal, meaning that given proper trade management, even a failed trend can still be profitable.
Because the indicator works using volume and price data, the Volume Trend Advisor works well on any chart. We personally use the indicator to successfully trade Stocks, Forex, Commodities, and Crypto Charts such as Bitcoin ( BTC ).
To gain access to the Volume Trend Advisor, please visit our website - signaltosignal.com
If you have any questions, please contact us through the Contact link on our website - signaltosignal.com

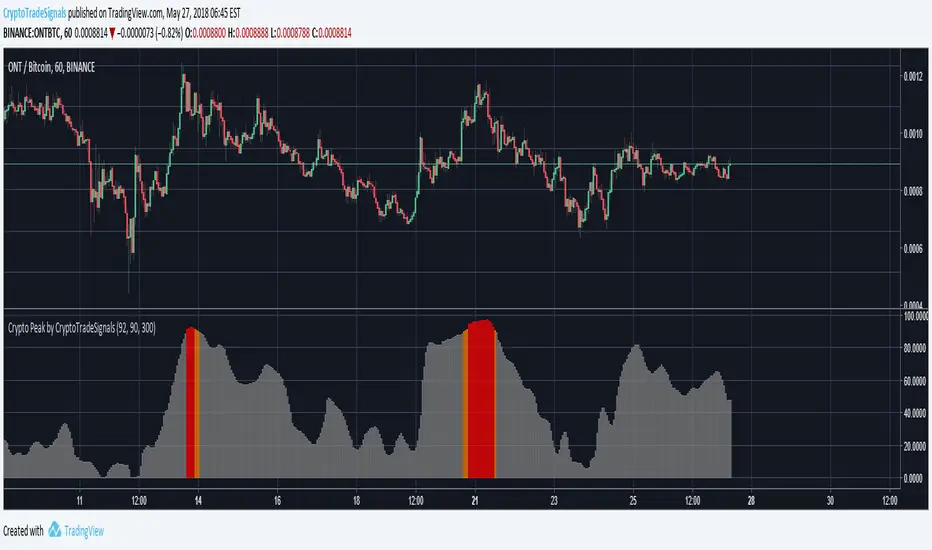
Crypto Peak by CryptoTradeSignalsRelease Notes:
1. AUTOMATED ALERTS: Staring at your phone all day? Get "Crypto Peak" alerts via email or via SMS (requires TradingView PRO Subscription).
2. CRYPTO PEAK SIGNAL: Not sure if a crypto has reached it’s “high point”? Identify the top of the market with this trading signal. When used in combination with the “Crypto Bottom Signal”, identifying the best points to “buy in” now becomes possible.
>>Get access to our Crypto Trading Indicators by visiting our website (please go to my main profile page or check the my signature)<<
Simple profitable trading strategyThis strategy has three components.
Philakones EMAs are a sequence of five fibonacci EMAs. They range from 55 candles (green) to 8 candles (red) in length. A strong trend or breakout is marked by the emas appearing in sequence of their length from 8 to 55 or vice versa. These EMAs are also used to signal an exit. Only two EMAs are used for exit signals - when the 13 EMA crosses over/under the 55 EMA.
RSI gives a bullish signal when 40 > rsi > 70. Exit signals are oversold (30) or overbought (70)
Stochastics give a bullish signal when stoch < 80 and an exit signal when > 95.
Results include 3 ticks of slippage and taker fees of .002. Provides a pretty smooth equity curve with a 73% win rate and beats buy and hold by than 10x (returns about 60x overall) since start of 2017.

RSI Buy/sell signal with TP_SL_TL_15min by rajistaRSI Buy/sell signal with TakeProfit_Stop loss_Trailing_SL script -can be used on any altcoin/btc pair on the 15min chart .
This script can be used for backtesting pupose and also to give buy/sell signals based on the settings provided by you.
Benefits of the script:
1> Fully customizable script according to your trade setups.
2> The script incorporates Take-profit, Stop-loss & Trailing SL.
3> Cuts your losses significantly, in comparision to a script without TP, SL & TL strategies.
4> Based on RSI Overbought/Oversold levels, which can also be customizable.
5> Doesn't take too many trades in a day, thereby decreasing commission paid to exchanges & hence enhances the overall profit.
Here's how, you can fully customize the script, according to your strategy, once you have been provided access:
( To gain access to the script just hit the like/comment in the #tradingview published article & i'll grant access based on your tradingview userid )
You can add this script to your charts in 15min timeframe, like adding any other simple indicator.
Once you have added the script, just hit the settings button to fully customize the script according to your strategy and plan, that you have, for your trade setup.
Take profit, Stop loss, Trailing Stop loss values can be entered in satoshis from the setting panel.
RSI Overbought & Oversold values can also be entered according to your trading setup.
Like in below example , i have put the following values as default
Test date is set as 1 May 2018
Take profit=1000, stop loss=5, Trailing SL=40
RSI Overbought=70, Oversold=20
" Above mentioned values are default values and may not be profitable in every condition, you have to backtest the strategy by changing these values and then see the results of given values under the Strategy tester tab- located at bottom of your #tradingview chart. "
Lets see how the scipt is able to make these awesome gains:
Suppose your script enters a trade(buys Verge) when #Verge is at 800sats
Then the bot will close the trade(sell Verge) when either of these things happen:
a> Verge surges to 1800 sats, then the script will close trade by Taking profit
b>Verge increases to 850 only, but the RSI value in 15min chart has gone above 70 (Overbought-default value) then scipt will close trade.
c>Verge decreases to 995 sats, then script will close trade by Stop loss hit.
d>Verge surges to 840 but then again drops slightly to 835, script will again close trade by Trailing SL hit.
Initial capital is set to 10 btc
Make sure to check the performance summary tab below and overview of the script running on #XVGBTC since 1 May 2018-Till date
Profit -11.6% while running script
Where Buy and hold return for verge in the same period is:
- to get an instant notification, once i publish a script or a trading analysis/trade-setup , which will always be available for free for everyone!!!

CryptoWave ProProps to Lazy Bear for his WaveTrend Oscillator which I've used as the basis of this indicator.
Whats changed?
Tweaked values for crypto markets - Working well on the 1h chart but can be used on essentially any time frame.
- Added visual buy sell signals
- Colored Arrow
- Bar Colors On Chart
Added alert syntax to easy TradingView alerts
Access given to all CryptoProTools members

ETHUSD LONGS & SHORTS Bitfinex (margin traders)It is the interpretation of margin positions ETHUSD. Data — Bitfinex

RAGNAROK MK IIRagnarok MK II the second gen of Sniper V7. A trend market indicator which confirms the sentiments of the traders where it is heading; such as a possible reversal, exit and entry indication. For those who are interested you can try Sniper v7 for free; Just favorite the script so you can use it into your chart. Feel free to dm me for questions and suggestions. :)
You can check down below about the Sniper V7 for the successful trade using the indicator
EXAMPLE OF SNIPER V7
SANUSD 2H
EOS 4H
ETHUSD 2H

Bitfinex Margin VolumesQuick view on longs/short margin positions on Bitfinex for current Crypto Symbol.

min_Crypto_Thesis_indicator_MoriceauThis indicator is for minute candlestick and this back test work perfectly with Bitcoin and Gold.
The indicator tells you when you need to buy and sell your position. The backtest work at 86% of the last year.

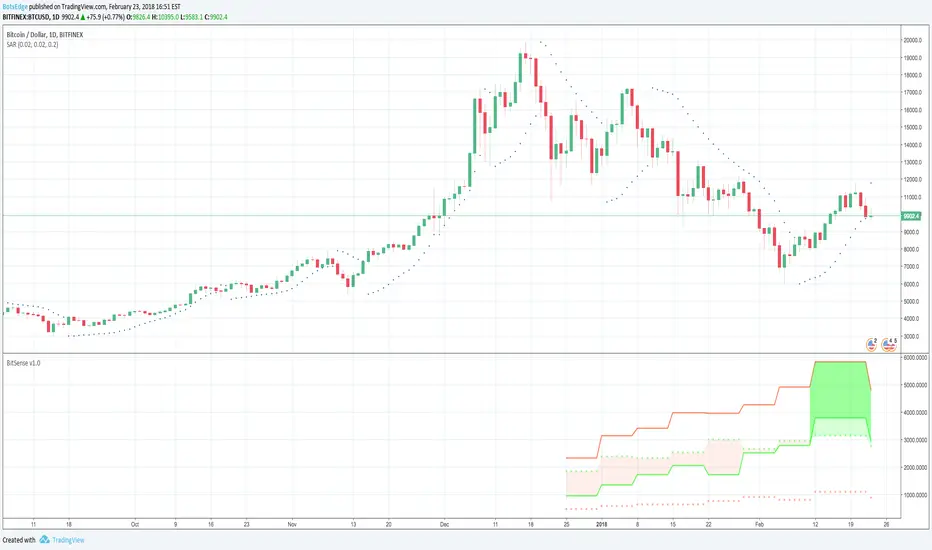
BTC-USD Commitment of Traders Bitsense v1.0INDICATOR EXPLANATION
The main data from the COT report is plotted using 4 lines. These are
The solid red line shows the commercial short (hedge) positions
The solid green line shows the commercial long positions
The dotted red line shows the non commercial short (not hedging) positions
The dotted green line shows the non commercial long positions
The shaded areas show the long and short situation in the bitcoin market as weak and strong
The lighter the color, the weaker the market is. So for example for Jan 2018 the first full month with the new futures we see a light red color between the commercial (solid green) and the noncommercial (dotted green) positioning line. This means that the market is weakening but on a longer timeframe still on an upward move. So this is a possible launchzone for any short trade but it is weak
The darker the color, the stronger the market. So for example in the middle of Feb 2018 we see a bigger area with different shades of green. There is a light green color shown between the commercial long (solid green) and the non commercial long (dotted green) line and a darker green color between the commercial long (solid green) and the commercial short (solid red) line. So this is a possible and strong launchzone for a long trade in bitcoin
HOW TO USE
Whenever Bitsense shows a light shaded colored area, that area then can be used as a launchzone for trades in the direction of the market but one needs to know that the light colors represent weak market conditions. So a light shaded red area represents a possible launchzone for a short trade but it is a very weak short market (no matter how many points the market moves in that direction it is still a weak condition)
Whenever Bitsense shows a darker shaded colored area, that area then can be used as a launchzone for trades in the direction of the market. The same goes for areas where light and darker shaded areas are together. These represent strong market conditions
As can be seen (mid feb 2018), even though the commercial shorts stay on top, Bitsense shows a strong long situation and the market starts rising. The COT report is different from traditional indicators and Bitsense shows this clearly. To explain, both of the dotted lines show the non commercial positions either long or short. These positions are traded in the direction of their color, so if the non commercial dotted green line stays on top of the non commercial red dotted line there are more long positions on bitcoin futures out there than there are short positions. But this is not that easy with the commercial positions. These are usually hedging positions which means a high commercial solid red line represents the commercial traders hedging a market that they think i a) high and b) can rise more, so they sell short positions to lock in gains from the market position, whereas solid green line commercial positions start rising only when markets are low because these traders usually lock in cheap market prices with buying long positions
Since there is just a very short accumulation of data since the inception of both bitcoin futures the indicator still might not work correctly and you have to be very careful in using it. It is published here as an information tool only and should not be used for any real trading without other means of information about the market
By using this indicator you acknowledge that you have read and understood that this is for research purposes only and I am not responsible for any financial losses you may incur by using this indicator. All trading involves high risk and past performance is not necessarily an indication of future results
Khaos-Crypto-TraderThis indicator has been developed to trade crypto-currencies, but can also be used to trade forex, stocks, and futures.
This Indicator is a full trading system that offers setups with Entries, Targets and Stops. This indicator is very accurate because it uses advanced setup detection and filtering logic.
The setup is triggered if the price passes the blue dot. Do not enter the trade unless price passes the blue dot. Each setup has 3 possible targets, which are dots colored green for longs and red for shorts.
The initial stop is the green square for longs, or the red square for shorts.
You can use the base-line (which is the dark blue line with dots) to manage the trade. One strategy would be if you enter a trade long, and reach the first target, you can take some profits, but still let the some of the position run, where a bar closing below the blue line, would stop out your remaining position.
To summarize:
Blue Dot = Entry Trigger
Green Dots = Long Targets (3 of them, for different price targets: target 1, 2 and 3)
Green Square = Long Stop Price
Red Dots = Short Targets (3 of them, for different price targets: target 1, 2 and 3)
Red Square = Short Stop Price
The great thing about this indicator is that its universal, there are no settings necessary -- just put it on the chart and it finds high probability setups and paints it on the chart as they occur. There is NO Repainting with this indicator.
Of course, you can add other indicators if you wish, and even add this indicator to your existing trading system.
Again, this indicator does NOT repaint.
Once a setup is found, the indicator draws the targets and stop at the setup bar close.
Setup Alerts are fully supported, via email, sms, and desktop notification.
LEGAL STUFF:
Risk Disclosure
Futures , forex, stock, crypto and derivative trading contains substantial risk and is not for every investor. An investor could potentially lose all or more than the initial investment. Risk capital is money that can be lost without jeopardizing ones’ financial security or life style. Only risk capital should be used for trading and only those with sufficient risk capital should consider trading. Past performance is not necessarily indicative of future results
Hypothetical Performance Disclosure
Hypothetical performance results have many inherent limitations, some of which are described below. no representation is being made that any account will or is likely to achieve profits or losses similar to those shown; in fact, there are frequently sharp differences between hypothetical performance results and the actual results subsequently achieved by any particular trading program. One of the limitations of hypothetical performance results is that they are generally prepared with the benefit of hindsight. In addition, hypothetical trading does not involve financial risk, and no hypothetical trading record can completely account for the impact of financial risk of actual trading. for example, the ability to withstand losses or to adhere to a particular trading program in spite of trading losses are material points which can also adversely affect actual trading results. There are numerous other factors related to the markets in general or to the implementation of any specific trading program which cannot be fully accounted for in the preparation of hypothetical performance results and all which can adversely affect trading results

Cryptotutor CrossThe cryptotutors cross is a lagging indicator that can help detect a change in the trend. For example, it can help detecting an upwards or downwards movement of Bitcoin (on 1H), which can save you a lot of money when you are in altcoins.

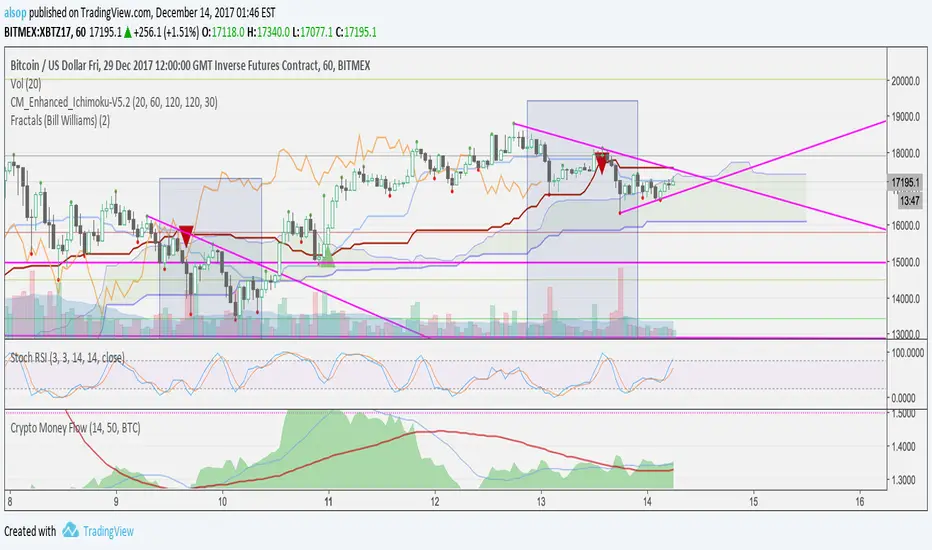
Crypto Money Flow RatioThis indicator shows you the movement of buyers and sellers in the market. Combined with other indicators like Stochastic RSI it can be a very powerful early indicator to buy and exit.
In this example, there are two moving averages applied to the indicator (at the bottom). Once the Fast crosses the Slow and the area is above both - this tells you the major market players are accumulating and you should be looking to long.
In addition, Stochastic RSI is also oversold and Ichimoku shows price above the cloud - all confluence on a long trade. As you can see, in the next hour price rocketed.
This size of move isn't always common, and this move may have been due to news. Even if so, people were aware and started buying and you could see it happen.
Another example here with DASH.
In this example, you can see there was a previous bull move that we applied a fib to and had a 38% retracement. We bought on the indicator cross and ratio above averages with a target of a 38% extension. It hit almost exactly and we closed out.
To apply this to other currencies, change the settings. For example, for ETHUSD - change the setting from BTC to ETH.
BITFINEX:BTCUSD
Kovach Altcoin IndexCombined with the Kovach Crypto Spread, these two indicators can help visualize asset flows from Bitcoin to Altcoins and vice versa. For example, now we have a bit of a pullback in Bitcoin due to the Segwit2x fork cancellation. We can clearly see, using the Altcoin index, that Altcoins are rallying from investors pulling out of Bitcoin.
This is further confirmed with the Kovach Crypto Spread indicator, which measures the spread in returns between Bitcoin and the top Altcoins.
Both of these scripts weight Altcoins proportional to their market capitalization, and this is updated weekly so that you constantly have up-to-date parameters, and the indicators adequately reflect the markets in real time.
Check out these indicators as well as the Kovach Momentum Indicators and the Reversals indicator at quantguy.net
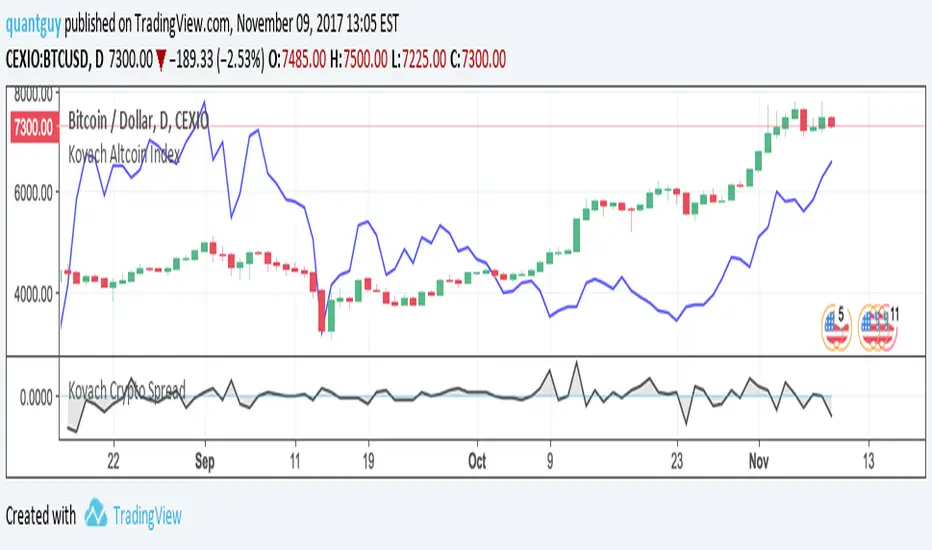
Kovach Crypto SpreadThe Kovach Crypto Spread indicator calculates the spread in profit between Bitcoin and the leading Altcoins. The Altcoins are weighted by market cap and this script is update weekly so you constantly have the most relevant Altcoins and their coefficients in the indicator.
Values above zero indicate a net flow from Altcoins to Bitcoin and vice versa. Let's consider how to use this data.
1. If Bitcoin is rallying, and the spread is well above zero, this indicates that Bitcoin is providing more profit than Altcoins. Consider taking some profits from BTC and investing in Altcoins.
2. If Bitcoin is retracing, but the spread is still above zero, it means that Altcoins are getting hit harder than Bitcoin, and you should keep your position in Bitcoin.
3. If Bitcoin is ranging, and the spread is below zero, it means that Altcoins are rallying and Bitcoin is stagnant.
For access to this indicator and more, please visit quantguy.net
