+ Balance of PowerThe Balance of Power is an indicator that measures the strength of buyers versus that of sellers in the market, and needs to be smoothed by a moving average to be of much practical use (come to think of it, most indicators are smoothed by a moving average; this is why the RSI lookback mostly commonly used is 14, and not 1, but I digress...). I suppose it is possible to use it without smoothing, but that would be very difficult I think.
The oscillator pivots around a center line, and as with most indicators like this, above 0 is generally considered bullish in a bullish trend, and vice versa in a downtrend.
It can be good for spotting divergences (moreso with smaller lookback periods than I like).
To wit, you might be wondering why I have the default lookback period set at such a large number. My only answer I can give is that I prefer it that way.
The indicator is quite choppy, even when smoothed. The long period helps me to make beter sense of the data (smooth it with a Hull or Jurik MA and you get a different story, though).
In my version of this indicator I provide a pretty broad selection of moving averages with which one may choose to smooth out the BOP, as well as an EMA provided to use as a sort of signal line for trade entries and/or exits, taking partial profits, scaling into a position, etc.
I've also added the option for a second BOP, which is on by default. I think you might find the results interesting by pairing differently smoothed BOPs together.
Of course, you don't have to use both. In the case of the default settings you might look at the EMA-BOP crossing the JMA-BOP as an opportunity to look into exiting or entering trades.
Candle coloring is, as usual, included. I'd say I kind of overdid it here, but that seems to be my style. I just couldn't deal with the fact that with the indicator set to cumulative modes there is no zero line, therefor the color of the indicator plot and the candle coloring would not match the color swatches for bullish/bearish colors. So, there are selections for cumulative indicator/candle colors, and standard indicator/candle colors. Donchian Channels obviously doesn't matter because the colors of things are based on the channel only.
I've added Donchian channel bands (which I've begun adding to many of my indicators), and all necessary alerts as well.
The Donchian Channels can be a really effective tool for entering and exiting trades. I haven't mentioned it in my other indicators that have it, so I will here:
The outermost edge of the band is that which references the indicator for where it is plotted, and the inner channel is sort of dragged along, creating the band
It's a simple mathematical calculation that TradingView actually provided themselves in their manual for pinescript.
When the BOP (or any other indicator using this) enters the band and then exits that could be an indication that price may be reversing, this the bands themselves act, or rather, show a current area of support/resistance for the BOP plot.
One thing that I did with it that they did not, is give the user the ability to change the width of the band. It can only go so narrow, obviously, but anywhere from three (quite wide) to eight is probably sufficient.
I've also provided the option of plotting the BOP as a cumulative line (like OBV), making it no longer an indicator which oscillates around a central pivot.
Because the balance of power is plotted as an accumulation, you may actually want to set the lookback to 1 (it works because it's not an oscillator then).
If you wish to smooth the noise, I suspect a low number would be acceptable here, but it's not necessary.
Oh, and lastly (almost forgot, as this was a late addition), I've added options for the BOPs calculated with volume as well. Gives a different bit of a perspective on the market, versus the traditional version which does not include volume. Screenshots below.
The above image is the balance of power calculated with volume. You can see the obvious difference versus the traditional indicator, where price is in a downtrend and you'd want to sell the orange.
Cumulative version. Looks a lot like OBV.
Cumulative version with volume.
Cumulative

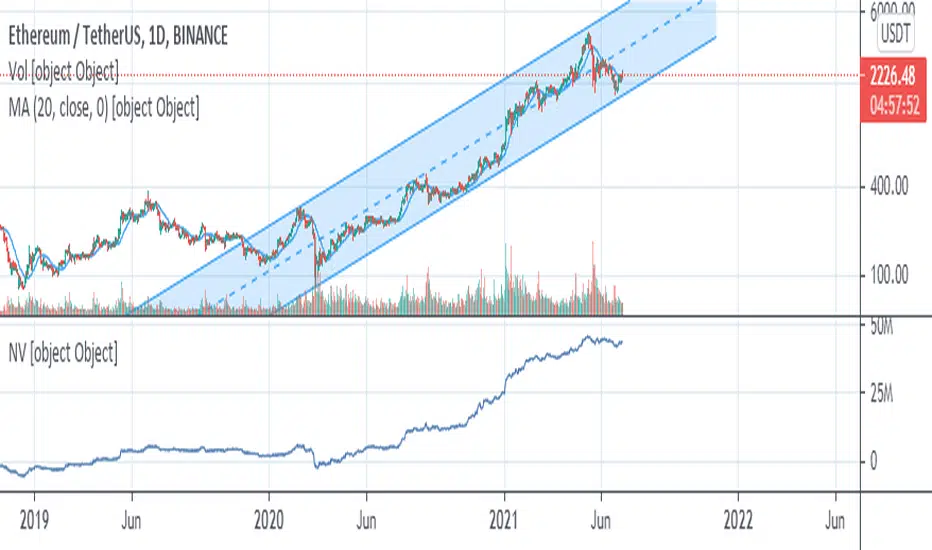
Net VolumeNet Volume, or NV in short, is a cumulative volume indicator similar to OBV and A/D. Though it might look similar to these two indicators (especially A/D), rest assured it's better and more accurate than both. What it basically does, is dividing the volume session into buyers and sellers volumes; then subtracts former from the latter and adds the result to previous session's net volume (In the script, these two intermediate volumes are not calculated and only the subtraction is formulated in an integrated form).
Another important difference between NV and A/D indicator, is that it brings price gaps into account. That's why it requires next session's open price to calculate current session's NV. What it actually mean is that the price gap, in either direction, is the result of the traders' efforts in respective direction in previous session, as if the current session closes where next session opens.
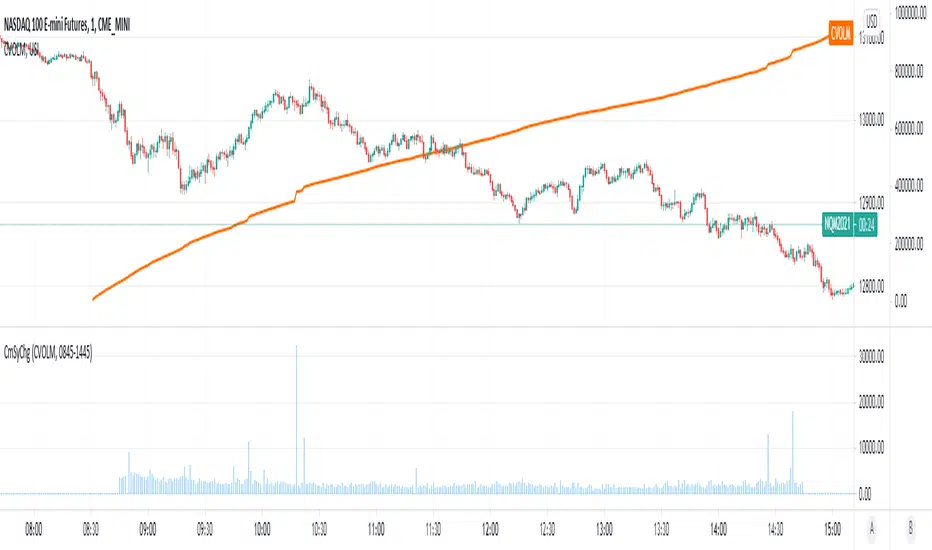
Cumulative Symbol ChangeSome symbols in trading view are cumulative - meaning they increment continuously throughout the trading day and are reset to 0 at the new trading day.
For example USI:CVOLM (Call Volume in Miami).
This script subtracts the current cumulative value from the prior cumulative value, so the change/delta in the cumulative value can be determined bar-by-bar.
Cumulative Volume DeltaCumulative Delta Volume is one of the key analysis in figuring out the Volume Price Action dependencies
Its very Intuitive in nature,
The below image shows how it is computed!
Enjoy

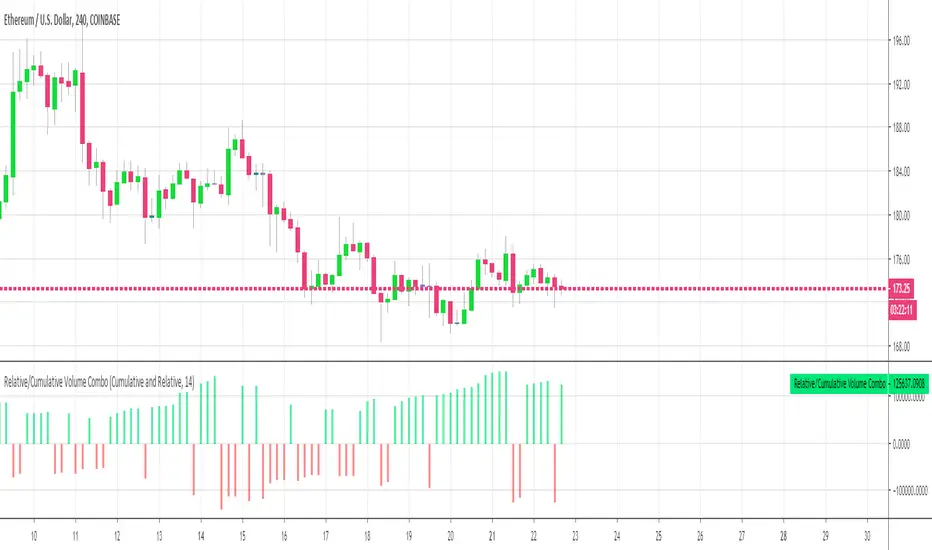
Relative Volume Combined With a Cumulative FunctionHi everyone
The today's script was suggested by a follower.
--------------------------------------
1 minute of Knowledge
--------------------------------------
Many traders look at volume as a pre-signal that a move may happen.
In trading, some say that "the volume precedes the movement".
This simply means that often volume will increase before a significant move in the stock.
Imagine if a unique trader is buying a crypto/stock. The volume is unlikely to move.
But, if all the mass goes to mass spot buy an asset, then we could see a volume spike announcing a potential upwards move.
---------------------------------------------
What's the story with that indicator?
---------------------------------------------
It's an interesting way of presenting the volume data.
Will show the total volume for the selected period.
You can choose between relative and cumulative presentation.
The users can display the consecutive rising volume above the 0 line and the failing volume below that line.
--------------------------------------
Mix knowledge with usefulness
--------------------------------------
A price making a higher/high (HH) or lower/low (LL) has a real and strong meaning- a HH or LL on a volume has a significant meaning also.
Increasing volume for a stock/crypto, could signify that buyers were willing to purchase a bigger number of shares at a higher price (comparatively to the day before)
Obviously, non-stop crazy buying/shorting won't work at some point - and that "some point" may hurt a bit.
Such volume indicator combined with others like momentum or strength indicators is a nice trading strategy.
The volume announces that a move may happen and the other indicators will confirm the prophecy :)
Peace
Dave
Cumulative Price Change %Tracking cumulative percentage change in price for each candle over a period.

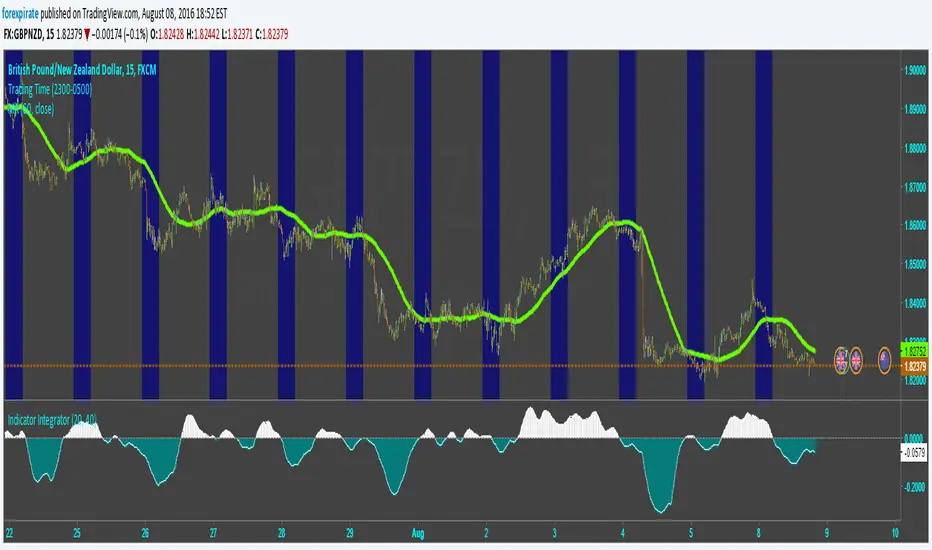
Indicator IntegratorHere is a light piece of code, The Indicator Integrator. It sums up a function (like an integral for you calculus folks). Unlike the 'cum' function that does a million bars of look back you can change the look back period, like limits of integration.
Built in is a difference of the close from an SMA. And there is an ROC. By changing what is summed up in the loop you can sum up the differences from the SMA or sum up the ROC. Pick your SMA length/ROC length. Then pick your look back period of how much to add up (bars to add up). There is a built in SMA smoother of three bars on the final summation.
Comments welcomed
[RS]Cumulative Average Price Gridgrid based on the cumulative average price.
on a sidenote: looks like im baned from chat for a week.
