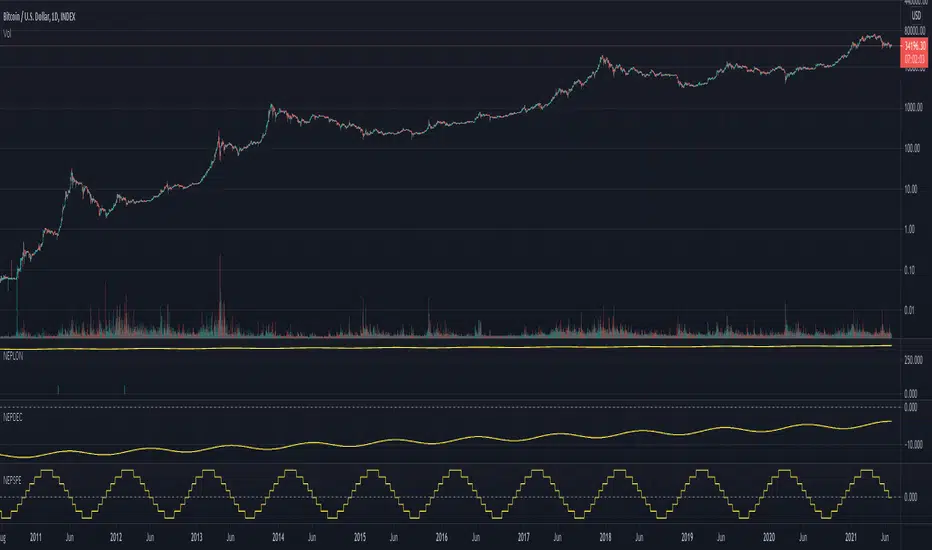
Financial Astrology Neptune SpeedNeptune retrograde and stationary phases indicates periods of delusion, on that moments the traders optimism bubble is burst, as consequence, we can see that most of this retrograde speed phase periods correlates with BTCUSD price correction or consolidation periods. Is very clear to see in the chart that only once, the Neptune retrogradation occurrence in September 2020, resulted in price growth. Therefore, periods of price growth and optimism are more likely when Neptune is direct.
Note: The Neptune speed indicator is based on an ephemeris array that covers years 2010 to 2030, prior or after this years the speed is not available, this daily ephemeris are based on UTC time so in order to align properly with the price bars times you should set UTC as your chart timezone.
Cycleanalysis
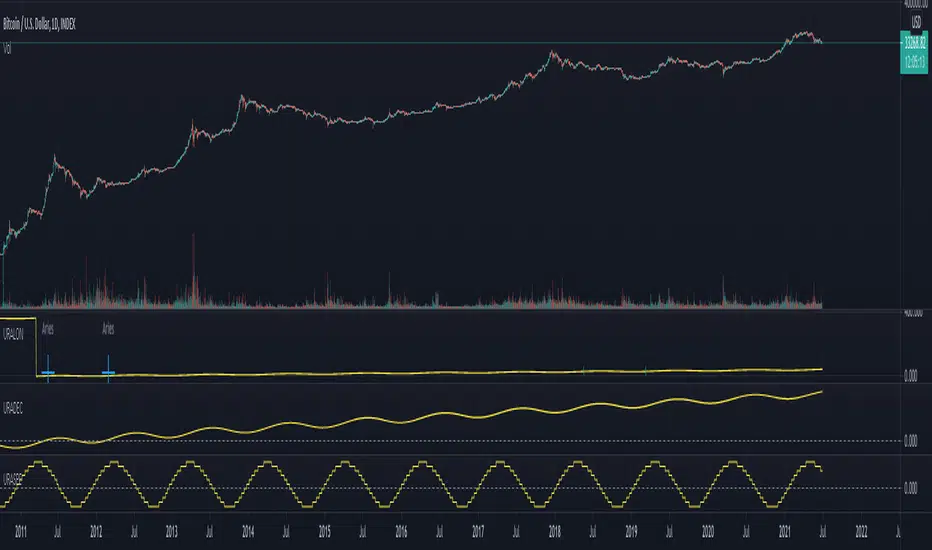
Financial Astrology Uranus SpeedWhen Uranus is accelerating in speed from retrograde to direct phase, there is a quick acceleration of price change. We can observe very clearly that in BTCUSD the most relevant price growth periods happened after the retrogradation period, when Uranus was moving direct and accelerating. Additionally, is very clear that when Uranus is decelerating in speed a period of correction or price congestion occurs. Very similar speed effect pattern was observed for multiples planets speed cycles so is clear that what is good for price growth is that most of the planets are in direct motion.
Note: The Uranus speed indicator is based on an ephemeris array that covers years 2010 to 2030, prior or after this years the speed is not available, this daily ephemeris are based on UTC time so in order to align properly with the price bars times you should set UTC as your chart timezone.
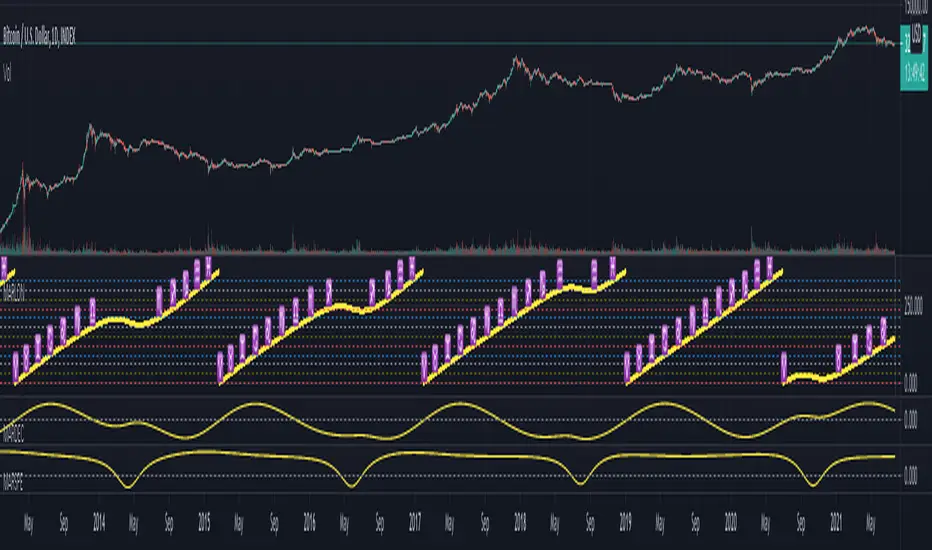
Financial Astrology Saturn SpeedSaturn maximum/minimum speed and stationary periods (zero speed) correlate quite well to determine high/low pivot points at BTCUSD, from using the speed indicator alone we cannot determine the direction of the trend, is clear to see that relevant tops occurred very close to maxima or minima values. Usually when there is a dominant trend and speed deceleration goes from maxima to zero degrees per day (stationary) will indicate a period of traders indecision (waiting) and as consequence a congestion within limited price range, once the speed accelerates and reach the average speed, a breakout tends to happen.
Note: The Saturn speed indicator is based on an ephemeris array that covers years 2010 to 2030, prior or after this years the speed is not available, this daily ephemeris are based on UTC time so in order to align properly with the price bars times you should set UTC as your chart timezone.

Financial Astrology Sun SpeedSun speed from geocentric view represents the apparent daily move (in degrees) of the Sun through the Zodiac wheel, we know well that is the Earth which is moving and this Sun dance through the tropical Zodiac is just apparent. The maximum speed 1.02 degrees per day is reached at the perihelion (closest to Sun) which occurs in January at the zodiac sign of Capricorn, the minimum speed is 0.97 at aphelion (further to Sun) and occurs at July at the sign of Cancer. The speed is inversely correlated to the Sun declination so at the maximum value in North declination we get the minimum value in speed and viceversa.
Is interesting to note that at the speed maxima, minima or exact average (that coincide with the start of the different Earth seasons) we can identify some of the most relevant top and bottoms in BTCUSD. Is said that "gold" metal is ruled by the Sun so would be great to analyse if there is a relevant correlation of top and bottoms in GLD market with in speed extreme value, I will leave this as homework to some of the amazing astro traders that do research with Trading View charts.
Note: The Sun speed indicator is based on an ephemeris array that covers years 2010 to 2030, prior or after this years the speed is not available, this daily ephemeris are based on UTC time so in order to align properly with the price bars times you should set UTC as your chart timezone.

Financial Astrology Saturn LongitudeSaturn energy strengthen the temperance, rectitude, constancy, greed, pessimism and precautionary. Under this influence the crowd will move with caution, slow and with strong and rigorous sense, analysing the environment in detail and deducting all the possible action outcomes based on the past experiences and utilising all the accesible wisdom. This cycle rules the land and real state, the state and institutions, officials, and regulations.
Due to the essential nature of this energy is expected that traders take more caution and reflexion in their investment decisions where Saturn transits through earth element (Taurus, Virgo, Capricorn) because the persons become more prudent and rigid. In water elements (Cancer, Scorpio and Pisces) traders will be reducing exposure to risky assets because the emotions are more unstable and the fear to loss results in risk aversion.
This cycle takes 29 years to complete so we don't have enough observations in the crypto-currencies sector to evaluate the potential effect of Saturn through all the zodiac signs but with the historical data available, there are some interesting patterns: the most bearish zodiac signs was Scorpio (water) and Capricorn (earth) and the most bullish was Sagittarius and Aquarius. This correlates well with other planet cycles where we have observed that air zodiac signs are usually bullish.
This indicator provides longitude since 2010 so will be limited in the zodiac signs that is possible to be analysed, however the periods of retrogradation and stationary speed phases could give interesting trading signals. We encourage you to analyse this cycles in different markets and share with us your observations, leave us a comment with your research outcomes. Happy research!
Note: The Saturn tropical longitude indicator is based on an ephemeris array that covers years 2010 to 2030, prior or after this years the longitude is not available, this daily ephemeris are based on UTC time so in order to align properly with the price bars times you should set UTC as your chart reference timezone.

Financial Astrology Jupiter LongitudeJupiter energy influence the expansion, enthusiasm, joviality, optimism, devotion, administration and judgement. Is associated with people of nobility and good social position: ministers, bishops, religious leaders, judges, bankers, lawyers, merchants, influencers and so forth. This cycle is relevant for the industries of consumer goods, travel, publishing, higher education, banking, gambling and legal.
For most of the crypto-currencies is hard to analyse the impact of the Jupiter transit across different zodiac signs due to the emergent nature of this disrupting financial industry, many coins was launched in 2017 and have not experienced the complete Jupiter cycle. However, in BTCUSD we almost have a complete orbit and through the buy/sell frequency analysis we have observed the following patters: the bullish zodiac signs was Virgo, Libra, Capricorn and Aquarius, the bearish was Leo, and Scorpio. We was not able to obtain price data for the period when Jupiter transited Aries to Cancer so we are pending to analyze the trend direction during those zodiac positions.
This indicator provides Jupiter longitude since 2010 so will be limited to the analysis of 1 cycle, however we noted that the periods of retrogradation and stationary could give interesting trading signals. We encourage you to analyse this zodiac sign / speed phases cycles in different markets and share with us your observations, leave us a comment with your research outcomes. Happy research!
Note: The Jupiter tropical longitude indicator is based on an ephemeris array that covers years 2010 to 2030, prior or after this years the longitude is not available, this daily ephemeris are based on UTC time so in order to align properly with the price bars times you should set UTC as your chart reference timezone.

Financial Astrology Mars LongitudeMars energy control the initial impulse, the courage to execute a risky action or to start a new entrepreneurship, to declare the war and fight. It allow us to focus our energy into impulsive action that will require a lot of our forces to produce the initial movement and momentum. Mars drives and directs our motivation into quick and impulsive actions. This planet also rules the angry, fight, conflict, wars and explosive reactions. Therefore, from trading perspective, Mars rules all the industries that imply a higher risks: sports, military, defence, startups (new entrepreneurship), high volatility industries and so forth. Aries zodiac sigh, the domicile of Mars is the archetype of the persons that are willing to move quick from the idea into the action, that are looking to explore new territories and take high risks.
With the manifestation of this impulsive and initiating energy through the zodiac signs we can predict the level of risk that the traders influenced by Mars and dominated by fire will take. This individuals, will desire higher risks when Mars is located in a zodiac sign that strengthens the fire force. Is not a surprise that BTCUSD is more bullish when Mars transits Aries, Gemini (air strength fire) and Sagittarius and bearish when transits Leo (this energy becomes more oriented to pleasures, parties, romance, passions), Virgo (challenge the impulse with the analytic thinking), Aquarius (boring of the existing holding needs to move into another stuff and is desiring a change), Pisces (period of reflexion and mediation of the results of the impulsive cycle that completes).
The most relevant Mars bullish zodiac signs positions for BTCUSD are: Aries 62% days, Gemini 66% days, Sagittarius 58%. The all history buy/sell frequency distribution is 55% (bull) 45% (sell) so BTCUSD has bias to the bullish side, even considering that, the bull frequency on this signs seems to be very relevant and can be analysed with this indicator in the BTCUSD TradingView index that provide historical price since 2010.
With this indicator there is unlimited possibilities to explore the impulsive risk prone actions across different markets to study how this plays out, no more manual chart annotations to identify the zodiac sign location of Mars. We encourage you to analyse this zodiac sign cycles in different markets and share with us your observations, leave us a comment with your research outcomes. Happy research!
Note: The Mars tropical longitude indicator is based on an ephemeris array that covers years 2010 to 2030, prior or after this years the longitude is not available, this daily ephemeris are based on UTC time so in order to align properly with the price bars times you should set UTC as your chart reference timezone.
Ehlers Adaptive Center Of Gravity [CC]The Adaptive Center Of Gravity was created by John Ehlers and this is a regular center of gravity indicator combined to be use with the current cycle period. If you are not familiar with stock cycles then I would highly recommend his book on the subject: Cycle Analytics. Buy when the indicator turns green and sell when it turns red.
Let me know if there are any other indicators you want me to publish!

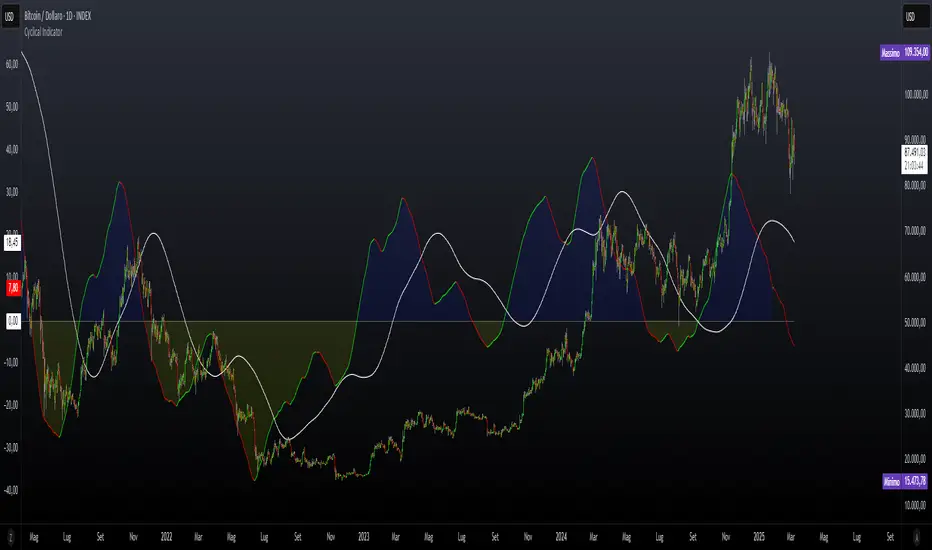
Cyclical IndicatorThis tool is an oscillator that detects cycles.
It is built on the basis of our centered moving averages.
It is fully configurable in design moreover it is possible to set the centering through the offset !
Offset 2, half cycle centering.
Offset 4, 1/4 cycle centering.
Recommended setting :
Offset 4
Cyclical ratio 2
On Chart Reverse RSI cyclic smoothed + DivergenceThis indicator is based on the amazing work of (@whentotrade) Lars von Theinen's RSI cyclic smoothed (cRSI). More information on the original indicator and how to use it can be found below.
The On Chart Reverse cRSI is a visual representational spin of the cRSI or (RSI cyclic smoothed, by Lars von Theinen) you all know and love with the addition of two key features, that in conjunction can be used to greatly assist the end-user in their decision making for entry, exit and risk management.
The first feature is the visual reverse engineered calculations of the HighBand, LowBand, as well as the user defined Upper and Lower Levels (70 & 30 by default), compared to the cRSI Level, in relation to the current price level as the point of divergence, which at a glance can then be used to visually see on the chart the closing price level needed in order to cross the cRSI either under or over the afore mentioned levels.
The second feature is the addition of my advanced On Chart divergence script in order to display regular as well as hidden divergences on the cRSI compared to the price level, in order to help the end-user train their eyes to spot them more accurately.
Divergence colors and description:
-------------------------------------
Green : Regular Bullish Divergence
White : Hidden Bullish Divergence
Red : Regular Bearish Divergence
Orange : Hidden Bearish Divergence
Optional Settings Include:
-----------------------------
1.) Show/Hide Reverse Levels
2.) Change the Reverse Levels Text Size
3.) Change the Reverse Levels Text Color
4.) Change the Reverse Levels Text Left Margin
5.) Change the Reverse Levels Decimal value
6.) Show/Hide the Reverse Levels Currency
7.) Show/hide the cRSI Divergence lines
8.) Change the cRSI Divergence line offset
9.) Show/hide the cRSI Divergence arrows
10.) Change the Regular Bullish Divergence Color
11.) Change the Hidden Bullish Divergence Color
12.) Change the Regular Bearish Divergence Color
13.) Change the Hidden Bearish Divergence Color
14.) Change the cRSI Divergence lookback (No. of bars to lookback)
RSI cyclic smoothed (cRSI)
-----------------------------
The RSI cyclic smoothed (cRSI) indicator is developed by Lars von Theinen and is subject to the terms of the Mozilla Public License 2.0 at mozilla.org Copyright (C) 2017 CC BY, whentotrade / Lars von Thienen. For more details on the cRSI Indicator:
RSI cyclic smoothed v2
The RSI cyclic smoothed (cRSI) is an enhancement of the classic RSI , adding
1) additional smoothing according to the market vibration,
2) adaptive upper and lower bands according to the cyclic memory and
3) using the current dominant cycle length as input for the indicator.
It is much more responsive to market moves than the basic RSI . The indicator uses the dominant cycle as input to optimize signal, smoothing, and cyclic memory. To get more in-depth information on the cyclic-smoothed RSI indicator, please read Decoding The Hidden Market Rhythm - Part 1: Dynamic Cycles (2017), Chapter 4: "Fine-tuning technical indicators." You need to derive the dominant cycle as input parameter for the cycle length as described in chapter 4.
Please PM me to obtain access.
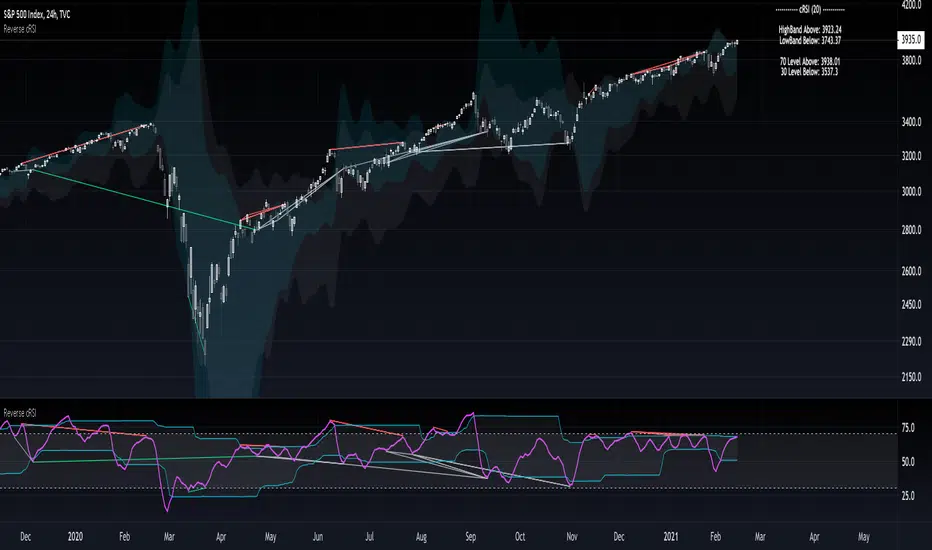
Reverse RSI cyclic smoothed + DivergenceThis indicator is based on the amazing work of (whentotrade) Lars von Theinen's RSI cyclic smoothed (cRSI). More information on the original indicator and how to use it can be found below.
The Reverse cRSI is in essence the same cRSI or (RSI cyclic smoothed, by Lars von Theinen) you all know and love with the addition of two key features, that in conjunction can be used to greatly assist the end-user in their decision making for entry, exit and risk management.
The first feature is a reverse engineered calculation of the HighBand, LowBand, as well as the user defined Upper and Lower Levels (70 & 30 by default), compared to the cRSI Level, in relation to the current price level as the point of divergence, which at a glance can then be used to determine the closing price level needed in order to cross the cRSI either under or over the afore mentioned levels.
The second feature is the addition of my advanced divergence script to display regular as well as hidden divergences on the cRSI, in order to help the end-user train their eyes to spot them more accurately.
Divergence colors and description:
-------------------------------------
Green : Regular Bullish Divergence
White : Hidden Bullish Divergence
Red : Regular Bearish Divergence
Orange : Hidden Bearish Divergence
Optional Settings Include:
-----------------------------
1.) Show/Hide Reverse Levels
2.) Change the Reverse Levels Text Size
3.) Change the Reverse Levels Text Color
4.) Change the Reverse Levels Text Left Margin
5.) Change the Reverse Levels Decimal value
6.) Show/Hide the Reverse Levels Currency
7.) Show/hide the cRSI Divergence lines
8.) Change the cRSI Divergence line offset
9.) Show/hide the cRSI Divergence arrows
10.) Change the cRSI Divergence arrow offset
11.) Change the Regular Bullish Divergence Color
12.) Change the Hidden Bullish Divergence Color
13.) Change the Regular Bearish Divergence Color
14.) Change the Hidden Bearish Divergence Color
15.) Change the cRSI Divergence lookback (No. of bars to lookback)
RSI cyclic smoothed (cRSI)
-----------------------------
The RSI cyclic smoothed (cRSI) indicator is developed by Lars von Theinen and is subject to the terms of the Mozilla Public License 2.0 at mozilla.org Copyright (C) 2017 CC BY, whentotrade / Lars von Thienen.
RSI cyclic smoothed v2
The RSI cyclic smoothed (cRSI) is an enhancement of the classic RSI , adding
1) additional smoothing according to the market vibration,
2) adaptive upper and lower bands according to the cyclic memory and
3) using the current dominant cycle length as input for the indicator.
It is much more responsive to market moves than the basic RSI . The indicator uses the dominant cycle as input to optimize signal, smoothing, and cyclic memory. To get more in-depth information on the cyclic-smoothed RSI indicator, please read Decoding The Hidden Market Rhythm - Part 1: Dynamic Cycles (2017), Chapter 4: "Fine-tuning technical indicators." You need to derive the dominant cycle as input parameter for the cycle length as described in chapter 4.

Cycle Swing MomentumAdaptive Ultra-Smooth Momentum indicator
The Cycle-Swing-Indicator "CSI" provides an optimized "momentum" oscillator based on the current dominant cycle by looking at the swing of the dominant cycle instead of the raw source momentum. Offering the following improvements:
Smoothness
Zero delay
Sharpness at turning points
Robust and adaptable to market conditions
Accurate deviation detection
The following common problems with standard indicators are solved by this indicator:
First, normal indicators introduce a lot of false signals due to their noisy signal line. Second, to compensate for the noise, one would normally try to add some smoothing. But this only results in adding more delay to the indicator, which makes it almost useless. Third, standard indicators require a length adjustment to derive reliable signals. However, you never know how to set the right length.
All three problems described above are solved by the developed adaptive cyclic algorithm.
The above chart shows current Bitcoin 4h data from the last days as of writing with the proposed signal reading for this indicator. The standard momentum indicator is included for comparison.
HOW TO USE
The indicator works without any parameter and can be applied to any chart and any time-frame. It will adapt automatically to the Dominant Cycle and use the dominant cycle of the source data to derive the ultra smooth momentum curve. Adaptive upper/lower bands are included and highlight areas with extreme readings. Automatic divergence detection can be turned off/on.
HOW TO READ
The indicator can be used like any oscillator. In addition, it provides adaptive high and low bands.
* Look for turns above the upper/lower bands
* Look for divergences between source and signals line
Further reading/Original source:
The indicator uses the dominant cycle to optimize signal, smoothing and cyclic memory. To get more in-depth information on the Cycle Swing Indicator, please read Chapter 10 "Cycle Swing Indicator: Trading the swing of the dominant cycle" of the book "Decoding the Hidden Market Rhythm, Part 1" available at your favorite book store.
Related ideas:
Please also check the cyclic RSI indicator which also uses cyclic information to improve the signal.

Oracle v2.0 [Market Vision]This algorithm uses Fibonacci Cycles to identify high probability reversal zones. It works on Crypto, Forex and Stocks. All timeframes are supported.
It contains several modes, such as "Equinox", "Regular", "Scalp" and "Fib". Use these modes to adjust the script to your favourite asset and timeframe.
This is a premium algorithm , that can be rented on a monthly basis.
PM if you are interested.
-Hawk
Some additional pictures:
15 minute 'Fib'
1 hour 'Equinox'

Gann Cycle IndicatorVersion "Beta 1.0.0"
The "Gann Cycle Indicator" helps you analyze market cycles, from the smaller ones to the bigger ones. It requires you to know how Gann used market cycles to trade efficently. It helps predict where to expect a minum or a maximum and where to expect the start of a new cycle. It works with any market and can be set up as you prefer. It takes some inputs to work properly:
1) Starting X: this is the offset on the X axis where all the cycles start from. Once you applied this indicator on your graph, you must adjust the starting position to match the start of the cycle you found on the graph.
2) Cycles (1 to 4). These are the period, expressed in candles number, of each cycles. "Cycle 1" (i.e 3,25 days) should be the smaller of the 4 while "Cycle 4" the bigger one (i.e 15 days).
In this example, we trade BTCUSD on the 15 days cycle, so 15 days on the graph is composed of 360 candles. Our bigger cycle (Cycle 4) take 360 as period. For simplicity, "Cycle 3 to 1" take each time half of the period so: Cycle 3 -> 180, Cycle 2-> 90, Cycle 1 (smaller) -> 45.
3) Trend. 0 to a rectangle trend, -1 for bearish trend and 1 for a bullish trend .
4) Trend strength. From 0 to 2, step 0.1
This parameter expresses the strength of the trend. In a bullish market (Trend set to 1) you can set Trend strength from 0 to 2 to allow the indicator to follow the current market trend
Note:
This indicator must be put in a separate Y axis so it can overaly the graph.
Dynamic Equalizer [DW]This is an experimental study inspired by techniques primarily utilized in the visual and audio processing worlds.
This study is designed to serve as a pre or post processing filter designer that allows you to shape the frequency spectrum of your data on a more "in-depth" level.
First the data is fed through my Band-Shelf Equalizer function.
The EQ in this script works by dividing the input signal into 6 bands and 2 shelves using a series of roofing filters.
The bands are then gain adjusted recursively (in %) to match source as closely as possible at unity gain.
The recursive adjustment size can be changed using the "Gain Adjustment Increment" input, which will affect how tightly the resulting filter approximates source at unity.
The frequency range of each band is adjustable via the period inputs. In default settings, these are the ranges:
-> Low Shelf : 256+ Samples Per Cycle. This shelf is the largest trend component of the signal. Unlike the other bands and shelf, this shelf is not zero mean unless source data is.
-> Band 1 : 128 - 256 Samples Per Cycle. This band is a moderate trend and low cyclic component of the signal.
-> Band 2 : 64 - 128 Samples Per Cycle. This band is a mild trend and moderate cyclic component of the signal.
-> Band 3 : 32 - 64 Samples Per Cycle. This band is a high cyclic component of the signal.
-> Band 4 : 16 - 32 Samples Per Cycle. This band is a high cyclic component of the signal.
-> Band 5 : 8 - 16 Samples Per Cycle. This band is a moderate cyclic and mild to moderate noise component of the signal.
-> Band 6 : 4 - 8 Samples Per Cycle. This band is a high noise component of the signal.
-> High Shelf : 4- Samples Per Cycle. This shelf is primarily noise.
Each band and shelf can be manually gain adjusted via their respective inputs.
After EQ processing, each band and shelf is then optionally fed through my Peak Envelope Compressor function for dynamics control.
The compressor in this script works by reducing band power by a specified percentage when it exceeds a user defined percentage of the peak envelope.
The peak envelope measures maximum power of the band over its period range multiplied by a user defined integer.
There is an option included to apply Butterworth smoothing to the envelope as well, which will alter the shape of the compressor.
If you want an envelope that quickly responds to power peaks, use little to no smoothing. If you desire something more static, use a large smoothing period.
Attack and release are included in the algorithm to shape the sensitivity of the compressor.
Attack controls how many bars it takes from being triggered for attenuation to reach its target amount.
Release controls how many bars it takes from being un-triggered for attenuation to reach back to 0.
In addition, the compressor is equipped with parallel processing.
The "Parallel Mix" inputs control the amount of compressed vs non-compressed signal presence in the final output.
And of course, the compressor has a post-processing gain input (in %) to fine-tune the presence of the band.
For easy visual tuning, you can view each independent band's magnitude or power by selecting them in the display inputs.
This display setup can also be beneficial analytically if you wish to analyze specific frequency components of the source signal.
The default preset for this script is meant to show how versatile EQ filtering and compression can be for technical analysis.
The EQ preset detrends the data, moderately smooths the data, and emphasizes dominant cyclical ranges.
The compression preset provides fast, moderately heavy shaping to dial in dynamics and reduce transient effects.
The resulting curve is a great filter for responsively analyzing cyclical momentum.
The script is also fully equipped with outputs that can be used externally by other scripts.
You can integrate these external outputs with your own script by using a source input. Simply select the desired output from the dropdown tab on your script.
Multiband filtering and compression are concepts that are not conventionally used in the world of finance.
However, the versatile capabilities of these concepts make this a wonderful tool to have in the arsenal.
By surgically adjusting separate frequency components of a signal, you're able to design a wide variety of filters with unique responses for a vast array of applications.
Play around with the settings and see what kinds of filters you can design!
---------------------------------------------------------
This is a premium script, and access is granted on an invite-only basis.
To gain access, get a copy of the script overview, or for additional inquiries, send me a direct message.
I look forward to hearing from you!
---------------------------------------------------------
General Disclaimer:
Trading stocks, futures, Forex, options, ETFs, cryptocurrencies or any other financial instrument has large potential rewards, but also large potential risk.
You must be aware of the risks and be willing to accept them in order to invest in stocks, futures, Forex, options, ETFs or cryptocurrencies.
Don’t trade with money you can’t afford to lose.
This is neither a solicitation nor an offer to Buy/Sell stocks, futures, Forex, options, ETFs, cryptocurrencies or any other financial instrument.
No representation is being made that any account will or is likely to achieve profits or losses of any kind.
The past performance of any trading system or methodology is not necessarily indicative of future results.
---------------------------------------------------------
NOTE: Unlike standard tools of this nature in other applications, I scaled the signals in % rather than dB, mainly since it's proven so far to be more user-friendly to keep things linear on here.
In addition, no transitions to frequency domain are done in this script. This EQ is an experimental variant that processes in the time domain and relies on a network of roofing filters.
When changing cutoff periods, make sure they are organized in descending order with low shelf as the highest period, and high shelf as the lowest period.
Using non-descending lengths may result in an undesired output.
Lastly, when changing cutoff periods, parts of the spectrum may leak slightly differently between bands, so the "Gain Match Adjustment Increment" may need to be changed as well if you want it to match as closely as possible at unity.
Despite these shortcomings, this tool functions surprisingly well, especially with the default periods, and it's quickly become one of my favorites. I hope you all enjoy it!

RSI cyclic smoothed v2Cyclic Smoothed Relative Strength Indicator
The cyclic smoothed RSI indicator is an enhancement of the classic RSI , adding
additional smoothing according to the market vibration,
adaptive upper and lower bands according to the cyclic memory and
using the current dominant cycle length as input for the indicator.
The cRSI is used like a standard indicator. The chart highlights trading signals where the signal line crosses above or below the adaptive lower/upper bands. It is much more responsive to market moves than the basic RSI.
You can also review this short idea where BTC went down from 4300 USD (3 Sept 17) to 3700 USD (15 Sept 17) after the idea was posted and showed the clear short exit with the next low:
The indicator uses the dominant cycle as input to optimize signal, smoothing and cyclic memory. To get more in-depth information on the cyclic-smoothed RSI indicator, please read Chapter 4 "Fine tuning technical indicators" of the book "Decoding the Hidden Market Rhythm, Part 1" available at your favorite book store.
This is the open-source code version of the requested script already published as protected indicator back in 2017 "RSI cyclic smoothed". Now made public as v2. Would love to receive feedback and see your ideas.

Ehlers Cyber Cycle [CC]The Cyber Cycle was created by John Ehlers (Cybernetic Analysis For Stocks And Futures pg 34) and this is one of my favorite Ehlers indicators. I use it personally for exits but it has several uses. It gives great entry and exit signals when you enter when it is at the bottom or at the very top during a cycle. When it is above 0 then the stock is in a strong uptrend and when it is below 0 then the stock is in a strong downtrend. It is also very reactive as well with zero lag according to Ehlers. Buy when the indicator line is green and sell when it is red.
Let me know if there are other scripts you would like to see me publish or if you want something custom done!

Vicious Cycle 1.2 [CR] - Enhanced█ OVERVIEW
Vicious Cycle 1.2 is an advanced oscillator-based momentum indicator designed to identify high-probability reversal and continuation setups. This new version features adaptive threshold technology, visual trend state classification, and a higher timeframe alignment system to filter low-quality signals.
The indicator analyzes multiple timeframe components and market dynamics to generate a composite momentum score, which is then smoothed and compared against statistical thresholds. Unlike traditional static oscillators, Vicious Cycle adapts its sensitivity zones to current market conditions, reducing false signals during volatile periods and increasing responsiveness during consolidation.
█ FEATURES
Adaptive Threshold System
The indicator employs percentile-based threshold calculations that automatically adjust to recent market behavior. This ensures optimal signal generation across different instruments and market regimes without manual recalibration.
• Toggle between dynamic and fixed threshold modes
• Adjustable lookback period for threshold calculation (50-500 bars)
• Customizable percentile levels for sensitivity tuning
• Separate calibration for overbought and oversold zones
Visual Trend State Classification
Background coloring provides instant visual feedback on market condition strength without requiring analysis of indicator position. The six-state classification system combines oscillator position with signal line relationship to identify:
• Strong bullish momentum
• Moderate bullish bias
• Weak bullish condition
• Weak bearish condition
• Moderate bearish bias
• Strong bearish momentum
Higher Timeframe Trend Alignment
An optional filtering system analyzes higher timeframe trend direction to block counter-trend signals. Two modes are available:
• Single EMA Mode: Uses price position relative to a customizable moving average
• Dual EMA Mode: Employs fast and slow moving average crossover logic
The filter only permits long signals during bullish trends and short signals during bearish trends, significantly improving signal quality in trending markets.
Signal Detection Modes
Multiple signal generation methods accommodate different trading styles:
• Zone-Based Signals: Fires when oscillator crosses key threshold levels
• Signal Line Cross: Generates entries based on oscillator and signal line interaction
Comprehensive Alert System
Pre-configured alert conditions cover all major indicator events:
• Primary signal alerts (zone cross and signal line methods)
• Zone entry and exit warnings
• Extreme level notifications
• Trend filter status changes
• Convenience aggregators for "any long" or "any short" condition
█ HOW TO USE
Initial Configuration
The indicator ships with optimized default settings suitable for most instruments and timeframes. New users should observe the indicator's behavior for at least 50 signals before adjusting parameters.
1 — Add the indicator to your chart and leave default settings unchanged.
2 — Monitor signal generation and background color transitions for several trading sessions.
3 — Set up basic alerts using the "ANY LONG Signal" and "ANY SHORT Signal" conditions.
4 — After observation period, adjust sensitivity based on your instrument's characteristics.
Threshold Configuration
For instruments with higher volatility, increase the percentile values (example: 90/75 instead of 85/65). For ranging or lower volatility instruments, decrease percentile values (example: 80/60 or 75/55).
The lookback period controls how quickly thresholds adapt to changing conditions. Longer lookbacks (150-200) provide smoother adaptation, while shorter lookbacks (50-75) offer more responsive adjustments.
Trend Filter Guidelines
Enable the trend filter in clearly trending markets to reduce whipsaw trades. In ranging or choppy conditions, consider disabling the filter or using a shorter EMA period.
• For position trading: Use 200-period single EMA
• For swing trading: Use 150-period single EMA or 50/200 dual EMA
• For day trading: Use 100-period single EMA or 50/100 dual EMA
If the filter blocks all signals, the market may be ranging near the trend reference level. This is intentional behavior designed to keep you out of low-probability setups.
Signal Interpretation
Primary signals occur when the oscillator crosses threshold zones or intersects the signal line in extreme regions. The strongest setups combine:
• Signal generation in the expected direction
• Background color matching the trade direction (bright colors indicate high conviction)
• Trend filter alignment
• Price action confirmation at key support or resistance levels
█ NOTES
Alert Configuration
Alerts must be manually configured in TradingView and do not activate automatically. Access the alert menu by clicking the indicator name and selecting "Add Alert on Vicious Cycle 1.2...". Choose your desired condition from the dropdown menu and configure notification preferences.
We recommend starting with the aggregated "ANY" alerts rather than subscribing to all individual signal types, as this prevents notification overload during active market periods.
Dynamic Threshold Behavior
The adaptive threshold system requires sufficient historical data (minimum equal to the lookback period setting) to calculate percentiles accurately. During the initial bars, threshold values may appear unusual until adequate history accumulates. This is expected behavior and resolves automatically.
Performance Considerations
The indicator performs percentile calculations on each bar using array operations. While optimized for efficiency, users experiencing performance issues on lower-end devices may reduce the dynamic lookback period or disable the adaptive threshold feature to use fixed thresholds instead.
Compatibility
Vicious Cycle 1.2 is built on Pine Script version 6 and works on all instrument types and timeframes. The indicator does not repaint—all signals finalize at bar close. Historical signals remain stable and do not change with additional price data.
█ RISK DISCLOSURE
This indicator is an analytical tool and does not constitute financial advice. No indicator or trading system guarantees profitable results. Always employ proper risk management, position sizing, and stop-loss protocols. Past performance does not indicate future results. Users are responsible for their own trading decisions and outcomes.

Stochastic Pop and Drop Signals [Bitduke]It's a long/short signals for modified Stochastic Pop and Drop strategy.
About
It's the strategy of 2 indicators: Stochastic Oscillator to define the bias and Average Directional Index to confirm it.
Signals
Strategy flips long / short depending of indicator signals. There can be multiple signals of the same type, for example, 2 longs in a row, only the first of them matters, others you should handle in your websocket script or manually.
Testing
Tested on different sources for data, oscillator periods and different levels in relation to the crypto market.
So, it shows good results with two tight thresholds at 55 and 45 level.
The bar chart below the defining the bullish and bearish periods (green and red) and gives a signal to enter the trade (purple bars).
Backtesting
Backtested on XBTUSD , BTCPERP ( FTX ) pairs. You may notice it shows good results on 3h timeframe.
Relatively low drawdown
~ 10% (from 2019 to date) FTX
~ 22% (4 years from 2016) Bitmex
Bitmex 3h (2017 - 2020) :
i.imgur.com
FTX 3h (2019 - 2020):
i.imgur.com
Possible Improvements
- Regarding trading algorithm it would be good to check with strategy with ADX somehow. Maybe for the better entries
- As for Risk Management system, it can be improved by adding trailing stop to the strategy.
Link: school.stockcharts.com

Stochastic Pop and Drop by Jake Bernstein v1 [Bitduke]I found a simple strategy by Jake Bernstein, modified it a little and created a strategy with Risk Management System (SL+TP); After that I test it on the different cryptocurrency pairs.
About the Indicator
Basically it's the strategy of 2 indicators: Stochastic Oscillator to define the bias and Average Directional Index to confirm it.
One again, It uses Stochastic Oscillator to define the trading bias. In particular, the trading bias was deemed bullish when the weekly 14-period Stochastic Oscillator was above some default value (in him paper - 50) and rising and vice versa.
Once the trading bias is established, Steckler used the Average Directional Index (ADX) to define a slowdown in the trend. ADX measures the strength of the trend and a move below 20 signals a weak trend.
Modifications
I didn't implement Average Directional Index (ADX) and test just different sources for data, oscillator periods and different levels in relation to the crypto market.
So, it shows good results with two tight thresholds at 55 and 45 level.
The bar chart below the defining the bullish and bearish periods (green and red) and gives a signal to enter the trade (purple bars).
Backtesting
Backtested on XBTUSD , BTCPERP (FTX) pairs. You may notice it shows good results on 3h timeframe.
Relatively low drawdown
~ 10% (from 2019 to date) FTX
~ 22% (4 years from 2016) Bitmex
I backtested on the different altcoin pairs as well, but the results were just not good.
Relatively good results were shown by some index pairs from the FTX exchange ( FTX:SHITPERP ), but I think there is a few data for backtesting to be asure in them.
Bitmex 3h (2017 - 2020) :
i.imgur.com
FTX 3h (2019 - 2020):
i.imgur.com
Possible Improvements
- Regarding trading algorithm it would be good to check with strategy with ADX somehow. Maybe for the better entries
- As for Risk Management system, it can be improved by adding trailing stop to the strategy.
Link: school.stockcharts.com

TrendFlex Oscillator - Dr. John EhlersHot off the press, I present this NEW "TrendFlex Oscillator" employing PSv4.0, originally formulated by Dr. John Ehlers for TASC - February 2020 Traders Tips. John Ehlers might describe it's novel characteristics as being a reversal sensitive near zero-lag averaging indicator retaining the TREND component. Also, I would add that irregardless of the sampling interval, this indicator has a bound range between +/-2.0 on "1 second" candles all the way up to "1 month" candle durations. This indicator also has a companion indicator entitled "Reflex Oscillator". I have published it in tandem with this one in my scripts profile.
One notable difference between this and the original formulation is that I have added an independent control for the Super Smoother. This "tweak" is enabled by applying the override and adjusting it's period. There is a "Post Smooth" input() that "tweaks" the internal TrendFlex EMA too. Keep in mind that my intention of adding tweaks is solely for experimentation with the original formulation.
I also added adjustable levels for those of you that may wish to employ alertcondition()s to this indicator somehow. Providing a more utilitarian approach, I created this with an easy to use reusable function named trendflex(). As always, I have included advanced Pine programming techniques that conform to proper "Pine Ettiquette". Being this is one of John Ehlers' first two simultaneously released indicators for 2020, I felt a few more bells and whistles were appropriate as a proper contribution to the Tradingview community.
Features List Includes:
Dark Background - Easily disabled in indicator Settings->Style for "Light" charts or with Pine commenting
AND much, much more... You have the source!
The comments section below is solely just for commenting and other remarks, ideas, compliments, etc... regarding only this indicator, not others. When available time provides itself, I will consider your inquiries, thoughts, and concepts presented below in the comments section, should you have any questions or comments regarding this indicator. When my indicators achieve more prevalent use by TV members, I may implement more ideas when they present themselves as worthy additions. As always, "Like" it if you simply just like it with a proper thumbs up, and also return to my scripts list occasionally for additional postings. Have a profitable future everyone!
🔗Blockchain Fundamentals - Bitcoin's Stock to Flow Ratio🔗Blockchain Fundamentals - Bitcoin's Stock to Flow Ratio by Cryptorhythms
Intro
What is a stock to flow ratio and why is it important? The stock-to-flow ratio of a commodity is the amount of the asset that is held in reserves divided by the amount produced every year.
The higher the stock-to-flow ratio the reduced inflation occurs on the asset annually. Commodities with a higher stock-to-flow ratio are preferred for their scarcity.
How does it relate to Bitcoin?
Today, Bitcoin has a considerable lower stock-to-flow ratio than gold and this is where the opportunity presents itself. Bitcoin’s software has a core component cooked into the protocol in the form of an event called “the halvening”
‘The halving’ is an event that happens every 210,000 blocks or roughly every 4 years where the block reward given to the miners for securing the network gets halved. For example in 2009 the block reward was 50 BTC and today in 2019 it currently sits at 12.5 BTC with the ETA for next halving happening on Mon, 25 May 2020 which will take reward down to 6.25 BTC.
The idea that Bitcoin is the first ever truly verifiable, non-confiscatable fixed asset to exist is an extremely powerful concept. Without its strong and non-inflatable monetary policy Bitcoin would have a futile attempt of being able to disrupt gold and even accrue value in the first place.
Over the next several decades we will see Bitcoin’s stock-to-flow ratio increase significantly into never before seen water. No other asset will have anywhere near the scarcity of bitcoin.
With the incredible influx of talent coming into the industry to build out the infrastructure (custodial, ETF’s, futures) needed to allow legacy financial institutions to dip their toes in the soon smooth and regulated crypto asset waters. The next few years will be very interesting.
You might say "where will all this capital come from to propel bitcoin to new all time highs?"
1. Well asteroid mining is coming which could well eliminate golds scarcity. Your garden variety metallic asteroid could contain as much gold as half the gold humanity has ever mined!
2. Countries/economies with negative interest rate monetary policy and /or heavy quantitative easing. Their currency supply and debt just keep increasing...
3. Countries looking for ways around the USD dominated and US controlled financial systems (Iran, Russia, Venezuela, North Korea, etc)
4. There's tons more I just wanted to highlight a few.
Usage
You can compare Bitcoin with various other precious metals and commodities from the settings panel. I suggest a logarithmic scale for this indicator, other wise most assets are clumped at the bottom:
There's also plots for the forecasted (estimated) SFR ratios after the 2020 and 2024 Halvings.
👍 Enjoying this indicator or find it useful? Please give me a like and follow! I post crypto analysis, price action strategies and free indicators regularly.
💬 Questions? Comments? Want to get access to an entire suite of proven trading indicators? Come visit us on telegram and chat, or just soak up some knowledge. We make timely posts about the market, news, and strategy everyday. Our community isn't open only to subscribers - everyone is welcome to join.
For Trialers & Chat: t.me

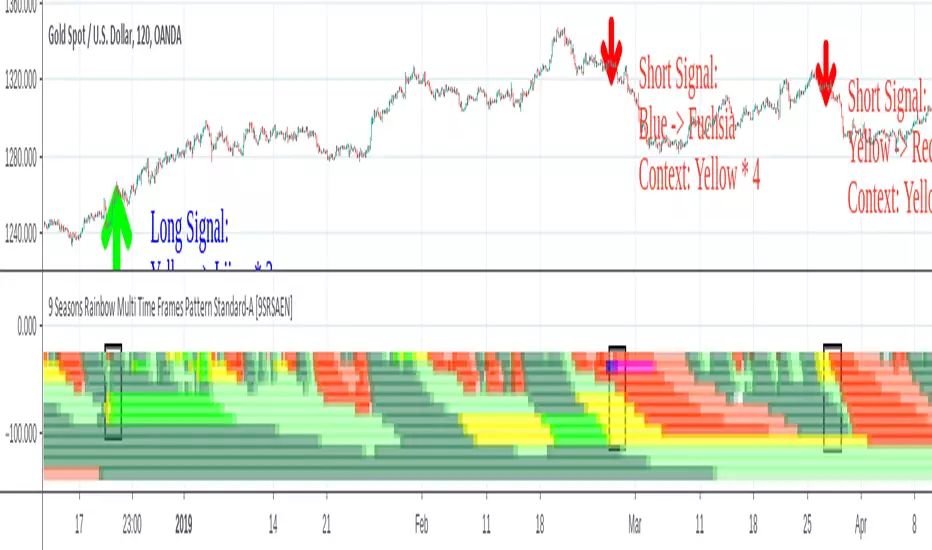
9 Seasons Rainbow Multi TimeFrames Pattern Standard-A [9SRSAEN]The indicator discovers profitable patterns by associating Price Season of multiple timeframes.
Full Name: 9 Seasons Rainbow - Multiple TimeFrames Associated Price Wave Pattern Indicator
Version: Invite-Only STANDARD-A
This is a sibling version OF “9 Seasons Rainbow Multi TimeFrames Pattern Standard ” with some functions for developing needs, without update notice function.
Language: English
Copyright: 2019
---------- How to use the indicator ----------
Go through the manual and related ideas underneath or follow the tutorials list. Look through the profitable patterns and related cases, wait for or set alert for specific profitable pattern.
---------- Definition: 9 Seasons ----------
A life cycle of Price Wave is divided into 9 Seasons. Each time frame, from 5 minute to 1 month, has 9 seasons, Independent of each other:
Bull (Green)
Bull Pullback (Light Green): a pullback or retracement
Resistance / Overbought (Yellow): a resistance area , may become a Top, or be broken through.
Crazy Bought (Lime): Price is going up in a high volatility , could be a valid breakout, or a Bull Trap.
Neutral (White): a wandering season without direction, evolves into Bull or Bear
Bear (Red)
Bear Bounce (Light Red): Price bounces
Support / Oversold (Blue): a support area , may become a Bottom, or be broken through.
Crazy Sold (Fuchsia): Price is going down in a high volatility , could be a valid breakdown, or a Bear Trap.
---------- Some important evolution between seasons ----------
Resistance / Overbought (Yellow) -> Crazy Bought (Lime):
Bull is breaking through a resistance.
Crazy Bought (Lime) -> Resistance / Overbought (Yellow):
This normally indicates a failed breakout, Price goes back to the resistance.
Crazy Bought (Lime) -> Bull Pullback (Light Green):
This normally indicates Price has risen to a new level
Support / Oversold (Blue) -> Crazy Sold (Fuchsia):
Bear is breaking through a support.
Crazy Sold (Fuchsia) -> Support / Oversold (Blue):
This normally indicates a failed breakdown, Price recovers to the support.
Crazy Sold (Fuchsia) -> Bear Bounce (Light Red):
This normally indicates price has dropped to a new level
---------- Rainbow Ribbons for Multiple TimeFrames ----------
Each ribbon of a rainbow represents a time frame.
The uppermost ribbon represents the shortest-term time frame - current time period of the chart, which is the time frame for trading.
The lowermost ribbon represent longest-term time frame, which work as environment, together with the other medium-term and long-term time frames.
The difference between two frames is 1.4142 fold (square root of 2), if level 1 is 15 minute, level 2 is 15 minute * (square root of 2) .
Examples of time frames in a rainbow:
For STANDARD in 15M: 15M - 21M - 30M - 42M - 60M(1H) - 85M - 120M(2H) - 170M
For PRO in 15M: 15M - 21M - 30M - 42M - 60M(1H) - 85M - 120M(2H) - 170M - 240M(4H) - 339M - 480M(8H) - 679M
---------- Trading Methods ----------
How to open a Long position?
When a profitable Long pattern appears, open small position first based on signal on shortest-term time frame; after retesting and confirming the support, open 2nd position; when it breaks through the resistance, pullbacks and confirms the breakout, open 3rd position.
How to exit a Long position?
Lift the Stop to a confirmed higher low, so that to take advantages of the bull run as possible.
How to open a Short position?
When a profitable Short pattern appears, open small position first based on signal on shortest-term time frame; after retesting and confirming the resistance, open 2nd position; when it breaks through the support, bounces and confirms the breakdown, add 3rd position.
How to exit a Short position?
Lower the Stop to a confirmed lower high, so that to take advantages of the bear run as possible.
---------- Versions Description ----------
The author reserves the right to change the features without advance notice.
PRO:
Invite-Only, with the following advanced features:
12 Ribbons Rainbow displays 9 Seasons of 12 time frames on a chart.
Advanced alert sets allows set alerts on short-term, medium-term, and long-term time frames.
Capability to input different trading instrument to compare with the current ticker.
Full time periods access allows apply it to broadest time periods, from 1 minute to 1 week (if history data is enough)
More new features in updates.
STANDARD:
Invite-Only, with the following advanced features:
8 Ribbons Rainbow displays 9 Seasons of 8 time frames on a chart.
Advanced alert sets allows set alerts on upper and lower frames.
Broad time periods access allows apply it to the most popular time periods, from 15 minute to 1 week (if history data is enough)
More new features in updates.
DEMO:
DEMO version is for trial purpose, having most of the features.
It is applicable to a list of trading instruments and specific time periods (1 hour to 1 day), which may change later without advance notice.
---------- Access to Indicators ----------
Please use DEMO version for Trial
Asking access to Invite-Only PRO and STANDARD versions:
9seasonsrainbowindicator.blogspot.com
Or contact the author.
---------- Install Invite Only: STANDARD & PRO Version----------
Ask access to STANDARD or PRO version
Open the chart -> Indicators (On the Top) -> Invite-Only Scripts (2nd button of the left bar)
Like/Favorite the indicator
Click to install on the chart
---------- About Loading Time ----------
It may take up to 2 minutes for your browser to load a new setting, depending on the your computer and network speed.
---------- List of the author's Indicators ----------
www.tradingview.com
---------- Disclaimer ----------
By using or requesting access to the indicator, you acknowledge that you have read and accepted that the indicator and any related content, including but not limited to: user manual, tutorials, ideas, videos, chats, emails, blog, are for the purpose of trading strategies studying and paper trading.
If a customer or user uses the indicator or related content mentioned above for live trading or investment, she/he should take all risks and be responsible for her/his own trading and investment activities.
---------- Updates ----------
The latest updates override the previous description.
To activate a update: Close the browser, Reopen the chart and apply the indicator.