Watermark | Bar Time | Average Daily RangeMulti Info Panel & Watermark
Multi Info Panel & Watermark is a utility indicator that displays several pieces of chart information in a single, customizable panel. It is designed to support intraday and swing analysis by making key data—such as symbol details, date, and average daily range—easy to see at a glance, as well as providing simple tools for notes and backtesting.
Features
Watermark / Custom Note
Optional text overlay that can be used as a watermark or personal note.
Can display a strategy name, reminder, or any other user-defined label on the chart.
Ticker Info
Shows information about the currently active symbol on the chart (for example, symbol name and other basic details depending on the inputs).
Helps keep track of which market or pair is being analyzed, especially when using multiple charts.
Current Date
Displays the current date directly on the chart.
Useful for screenshots, journaling, and documenting analysis.
Average Daily Range (ADR)
Calculates the average daily range of the active symbol over a user-defined number of recent days.
Helps visualize how much price typically moves in a day, which can support position sizing, target setting, or volatility awareness within your own trading approach.
Open Bar Time Marker
Marks the open time of a selected bar (for example, a session open or a specific reference bar).
Primarily intended as a visual aid for manual backtesting and reviewing historical price action.
Usage
Use the watermark and ticker info to keep your charts labeled and organized.
Refer to the ADR readout to understand typical daily volatility of the instrument you are studying.
Use the date and open bar time marker when creating screenshots, trade journals, or when replaying historical sessions for review.
This script does not generate trading signals and does not guarantee any performance or results. It is provided solely as an informational and visualization tool. Always combine it with your own analysis, risk management, and decision-making. Nothing in this indicator or description should be considered financial advice.
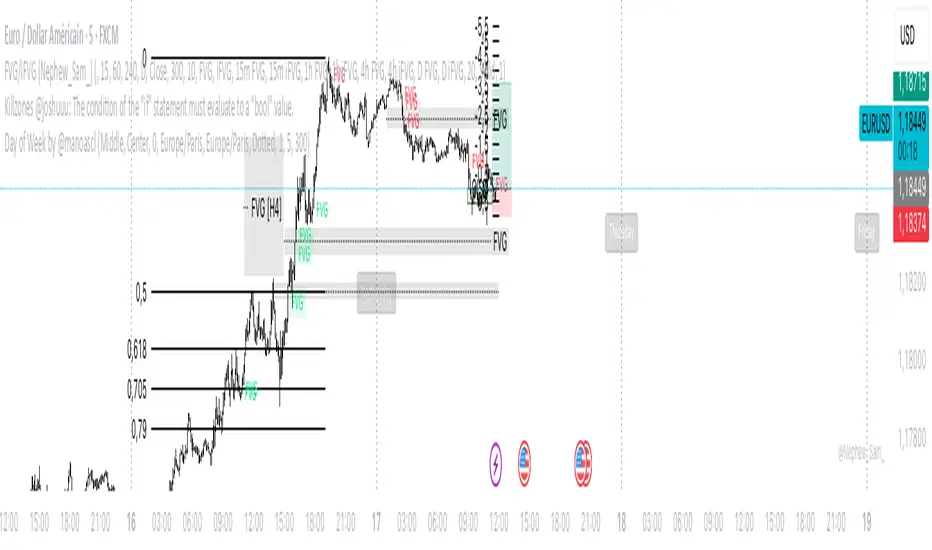
DATE


Day of Week by @manoascl Day of Week by @manoascl - version 1.8
One-line summary
This indicator draws vertical lines and labels at 00:00 of your chosen timezone for selected weekdays, helping you see daily structure, spot recurring weekly patterns, and prepare for upcoming trading days.
What it does
Draws vertical lines at 00:00 (calendar midnight) of the selected timezone for chosen weekdays (Mon–Sun).
Optionally adds a weekday label at the start of the day (top/middle/bottom alignment) with a user-defined offset in minutes.
Maintains stable label Y-positions via a configurable lookback window.
Projects future day markers (up to 30) in the same style, optionally filtering to your selected weekdays.
Fully customizable visuals: line color/width/style (solid/dashed/dotted), label background and text colors, label anchoring.
How it works (concepts & calculations)
Day boundary (midnight): Computes dayStartTz = timestamp(timezone, year, month, day, 0, 0, 0) so the boundary is true calendar midnight for the selected TZ.
Day change detection: Uses ta.change(dayStartTz) != 0 to detect the first bar of a new day (non-repainting).
Weekday naming: Determines the weekday using a midday shift (+12h) to avoid edge effects near midnight.
Drawing: When the weekday passes your filter, draws a vertical line (high→low) and an optional label positioned at the start of the day.
Future projection (DST-safe): Rebuilds future markers with timestamp(timezone, Y, M, D + k, 0, 0, 0) so daylight-saving transitions don’t drift.
Stability: Top/middle/bottom label Y-levels are derived from ta.highest/ta.lowest over a user lookback, preventing jitter.
How to use it
Add the indicator to your chart.
In Timezone, pick your region (or choose Custom and type an IANA TZ like Pacific/Tahiti).
Select the weekdays to display (e.g., only trading days, highlight Mondays, etc.).
Choose label position (top/middle/bottom), anchor (left/center/right), and set a minute offset if you want labels slightly inside the day.
Enable future projection to see upcoming day starts for planning around key weekdays (FOMC Wednesdays, NFP Fridays).
Tweak line style/width and colors to match your chart theme.
Practical applications for traders
Intraday: Instantly see where each local-time day begins; segment your session analysis cleanly.
Swing: Emphasize recurring weekdays (e.g., Monday opens, Friday profit-taking).
Event-driven: Pre-mark news-heavy weekdays and preview them with future projection.
Pattern studies: Compare behavior by weekday (range expansion, reversals, gaps) with consistent local-time boundaries.
Limitations
Visual aid only; no trading signals are generated.
Timezone must be chosen explicitly; if you pick a TZ different from your chart’s display, lines will follow the selected TZ by design.
Market holidays and custom sessions are not detected; lines still mark calendar midnight even if the market is closed.
On very small timeframes and long histories, many objects can impact performance—reduce lookback or future count if needed.
This work is licensed under a Attribution-NonCommercial-ShareAlike 4.0 International (CC BY-NC-SA 4.0) creativecommons.org
© @manoascl
Earnings Date and CountdownOverview:
The Earnings Date & Countdown (EDC) Indicator displays the next earnings date for a stock and a countdown of days remaining until the earnings announcement. This helps traders stay informed about upcoming earnings events and adjust their strategies accordingly.
Features:
- Displays the next earnings date in a customizable format.
- Accurate countdown of days remaining until the earnings event (optional).
- Automatically adjusts for time zones and ensures the correct number of full calendar days.
- Customizable display position for easy visibility on the chart.
Settings:
- Show day of the week: option to toggle the day of the week.
- Date Format: choose between dd mmm, mmm dd, dd/mm or mm/dd.
- Show year: option to toggle the year display.
- Show (countdown): option to toggle the countdown display.
- Indicator position: adjusts the location of the display on the chart.
Why use this indicator?
Earnings reports often cause significant price movements.
This indicator helps traders plan ahead by keeping earnings dates visible and tracking the countdown with precision directly on the chart.

Percent % Change Since Specific Date / TimeFUNCTIONS
- User specified Date/Time of importance
- Calculate the percent change since user input date/time to current price
- Plot a line at user input date/time
USAGE
You want to see how much price has changed since a certain important date/time.
Example important date: Trump win, FED rate change, Earnings, etc.

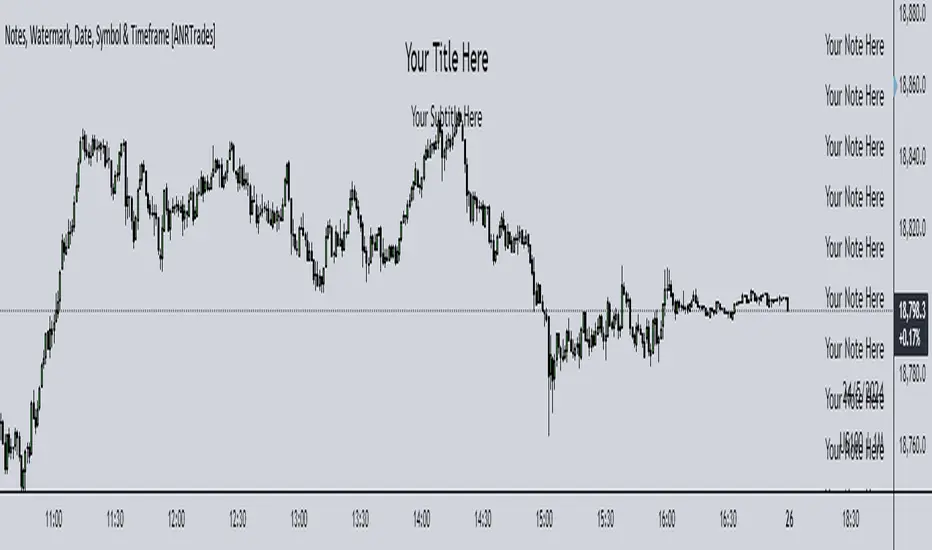
Watermark, Date, Symbol & Timeframe [ANR Trades]" Watermark, Date, Symbol & Timeframe " is a simple yet powerful TradingView indicator designed to provide essential information directly on your trading charts.
Key Features:
- Add a watermark with a title and subtitle to your charts. Customize the position, colour, and size to suit your preferences.
- View the current date, symbol, and timeframe directly on your chart.
This indicator is essential for traders who frequently save or share their chart images publicly who would want to watermark their chart as well as make it easier to know when it was, what symbol and what timeframe it was on.
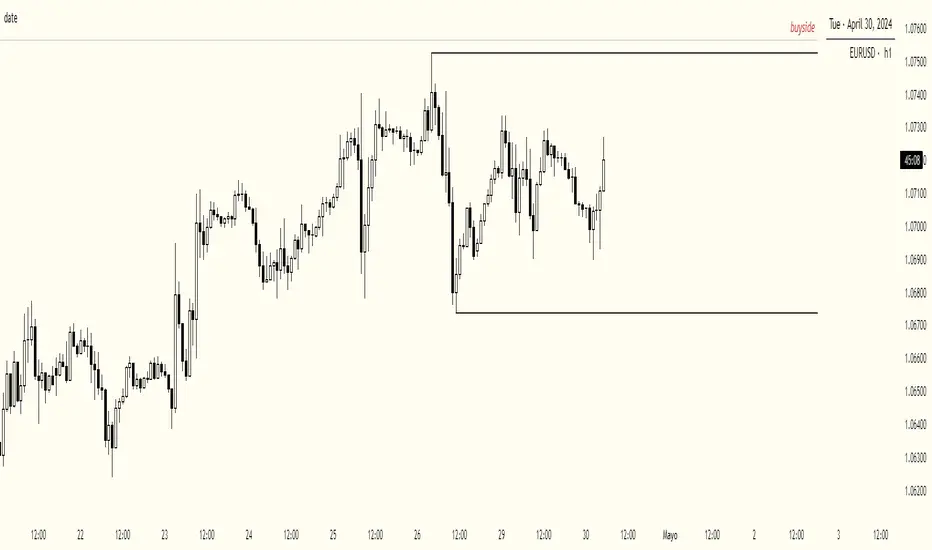
date & symbolHey y'all
If you are like me and you keep a record of your performance, adding date and symbol information will surely help you.
You can choose English or Spanish, and also choose between full or abbreviated date. If you want to see the day and if you want to see the symbol.
You can customize position, text size, text color, background.
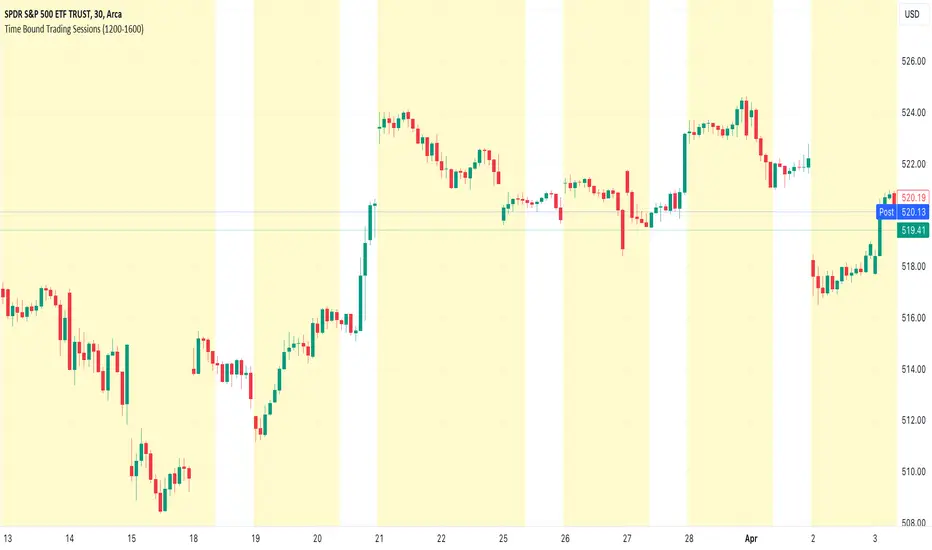
Time Bound Trading SessionsTime Bound Trading Sessions allows to add time bound conditions to your trading sessions given a date range , a time range and/or days of the week .
This indicator can be very handy if you want to control your trading sessions along those three time boundaries, applying them together and/or separately.
Feel free to reuse this code in your own strategy, and leverage the inSession condition as needed.
Features
+ It allows for date range start and/or end to be set.
+ It allows for session time range to be set.
+ It allows for days of the week to be set.
+ It applies chart background color if we are not within the given time bound session parameters.
+ It includes turn on/off functionality.
Settings
Date Range
+ {Start} checkbox: turns on/off start date
+ {Start} date/time
+ {End} checkbox: turns on/off end date
+ {End} date/time
Time Range
+ {Session} checkbox: turns on/off session time range
+ {Session} time range
Days
+ {M} checkbox: turns on/off Mondays
+ {T} checkbox: turns on/off Tuesdays
+ {W} checkbox: turns on/off Wednesdays
+ {T} checkbox: turns on/off Thursdays
+ {F} checkbox: turns on/off Fridays
+ {S} checkbox: turns on/off Saturdays
+ {S} checkbox: turns on/off Sundays
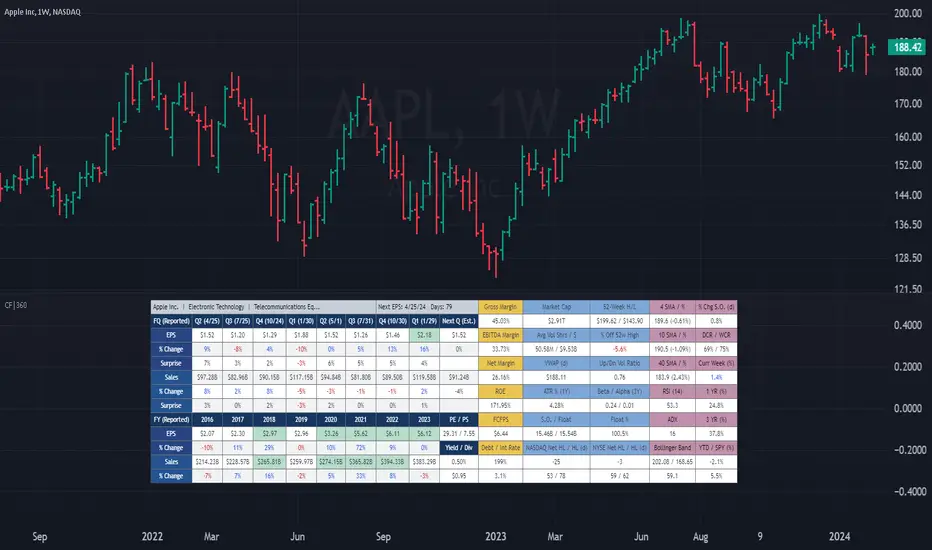
(CF|360) Caruso Financial DashboardThe Caruso Financial 360 Dashboard (CF|360) revolutionizes your TradingView charts by seamlessly integrating comprehensive Fundamental, Statistical, Technical, Performance, and Event information into an intuitively organized dashboard. This empowers users to make informed investment decisions effortlessly, eliminating the need to switch between pages or applications.
The dashboard is strategically divided into five distinct sections, each color-coded for user-friendly navigation. A quick glance at the dark blue "Fundamentals" table reveals two years of quarterly EPS and Sales data, YoY % change, and Surprise %, complete with report dates. Users can explore eight years of annual data and choose between Non-GAAP EPS, Diluted EPS, and Basic EPS for versatile analysis. Opting for Non-GAAP EPS also unveils next quarter estimates. The Fundamentals section further encompasses P/E and P/S data, alongside TTM dividend and dividend yield information.
In the yellow "Extended Fundamentals" section, users gain insights into Gross, EBITDA, and Net margins for easy profitability comparisons within the same industry group. Return on Equity data and Free Cashflow per share provide perspectives on profitability, efficiency, and financial flexibility.
The light blue "Statistics" section furnishes essential statistical measures for a rapid grasp of a company's trading characteristics. Metrics such as Market Cap, Average Volume per day (Shares and $ value), VWAP, Up/Down volume ratio, ATR%, Alpha, Beta, Shares Outstanding & Float, 52-week High/Low, and % distance from the 52-week high are presented. Additionally, market breadth is depicted through Nasdaq and NYSE 52-week high/low data.
The purple "Technical & Performance" section seamlessly integrates both Technical Analysis data and Performance statistics, enabling users to assess the stock's technical context and performance against the market over different periods. Technical indicators, including three customizable moving average types, RSI, ADX, Bollinger Band, Keltner Band, and daily and weekly closing ranges, are featured.
The grey top "Events" section offers a quick overview of the next earnings release date, countdown, and associated color changes as the date approaches. Company name, sector, and industry details are also presented.
To enhance information visibility, record EPS and Sales data are highlighted, emphasizing new records, along with highlights for new 52-week highs and lows.
The CF|360 offers customization options , including three display styles for Desktops, Desktop Slim, and Mobile devices.
Users can also tailor the lengths of technical indicators to suit their preferences. International market enthusiasts will appreciate that the CF|360 provides financial and market data for various regions, including the US, EU, Canada, and beyond.
88 Metrics Included:
Fundamentals Section (Dark Blue Group)
EPS (Adjusted Non-GAAP, Diluted, Basic)
- Quarterly, YoY % Chg, Surprise, Report Date, Next Quarter Estimate (Adjusted EPS only)
- Annual, YoY % Chg
Sales
- Quarterly, YoY % Chg, Surprise, Report Date, Next Quarter Estimate
- Annual, YoY % Chg
P/E ratio
P/S ratio
Dividend TTM
Dividend TTM Yield
Fundamentals Extended (Yellow Group)
Gross Margin
EBITDA Margin
Net Margin
Return on Equity (ROE)
Free Cashflow per Share (FCFPS)
Debt to Equity (Debt)
Effective Interest Rate (Int Rate)
Statistics (Light Blue Group)
Market Cap
Average Daily Volume (Shares)
Average Daily Volume (Dollar Value)
VWAP (Daily)
Average True Range Percent
Shares Outstanding
Shares in Float
Percentage of Share in Float
52-Week High
52-Week Low
% off of 52-Week High
Up / Down Volume Ratio
Beta
Alpha
Nasdaq Net 52-Week High/Lows
Nasdaq 52-Week Highs
Nasdaq 52-Week Lows
NYSE Net 52-Week High/Lows
NYSE 52-Week Highs
NYSE 52-Week Lows
Technical & Performance (Purple Group)
Moving Average Value (3 different averages)
Distance from Moving Average (3 different averages)
Relative Strength Index (RSI)
Average Directional Index (ADX)
Bollinger Band Value (Upper/Lower)
%b
Keltner Band Value (Upper/Lower)
%k
Percentage Changes Since Today’s Open
Daily Closing Range (DCR)
Weekly Closing Range (WCR)
Current Week % Change
1 Month % Change
3 Month % Change
6 Month % Change
1 Year % Change
3 Year % Change
YTD % Change
S&P 500 YTD % Change
Name, Group, & Events (Grey Section)
Company Name
Sector
Industry
Next Earnings Date
Days Until Next Earnings Date
Event Highlights
Record EPS (Quarterly/Annual)
Record Sales (Quarterly/Annual)
52-Week High
52-Week Low
Layout Types
Desktop
Get the full experience with the Desktop view.
Desktop Slim
Save screen real estate with a slim version of the dashboard.
Mobile
Take the most vital metrics with you on your mobile device. For the best experience, view in landscape mode.
Get start of previous day on any timeframeUseful on pine scripts which need to identify the start of the previous trading day i.e. from the perspective of today's date - not the previous day on each bar calculation.
Works on any timeframe - which is the whole point as on a daily chart you can simply do time .

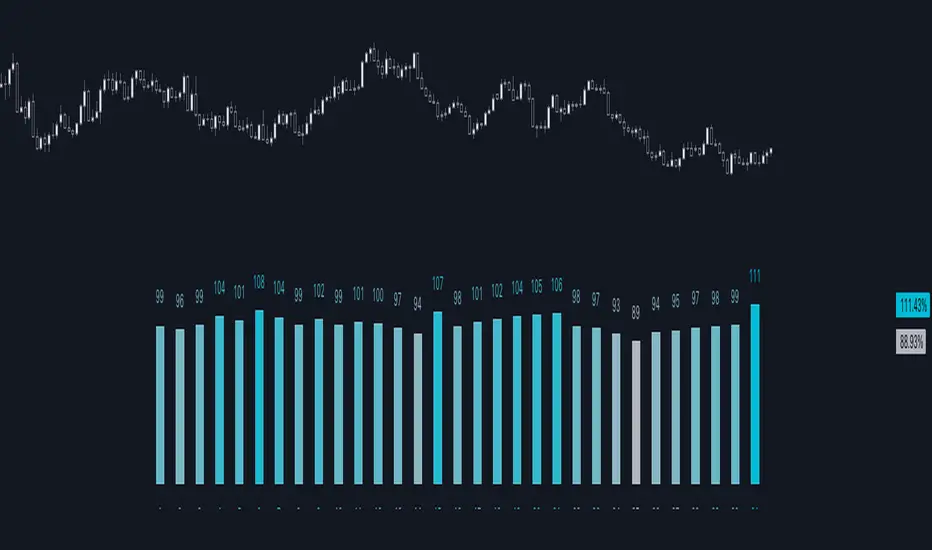
Day of Month - Volatility Report█ OVERVIEW
The indicator analyses the volatility and reports the statistics by the days of the month.
█ CONCEPTS
The markets move every day. But how does a market move during a month?
Here are some ideas to explore:
Does the volatility kick in with the start of a new month?
Do the markets slow down at the end of the month?
Which period of the month is the most volatile?
How does this relate to your best and worst trades?
When should you take a break?
DAX
EURGBP
Binance Coin
█ FEATURES
Comparison modes
Compare how each day moves relative to the monthly volatility or the average daily volatility.
Configurable outputs
Output the report statistics as mean or median.
Range filter
Select the period to report from.
█ HOW TO USE
Plot the indicator and visit the 1D, 24H, or 1440 minutes timeframe.
█ NOTES
Gaps
The indicator includes the volatility from gaps.
Trading session
The indicator analyses each day from the daily chart, defined by the exchange trading session (see Symbol Info).
Extended trading session
The indicator can include the extended hours when activated on the chart, using the 24H or 1440 minutes timeframe.
Overnight session
The indicator supports overnight sessions (open and close on different calendar days). For example, EURUSD will report Monday’s volatility from Sunday open at 17:00 to Monday close at 17:00.
This is a PREMIUM indicator. In complement, you might find useful my free Time of Day - Volatility Report .
[TTI] Eric Krull's YTD Market Indexes––––HISTORY & CREDITS 🏦
The Eric Krull's Index and Sector Performance Indicator is a powerful tool designed to provide users with a comprehensive view of the market's health and leading sectors. This innovative indicator analyzes various indexes and sectors, including the Nasdaq Composite, Renaissance IPO ETF, NYSE Composite, DJIA, and SP500, as well as 11 custom (user input) ETFs representing major sectors. By offering a detailed look at these indexes and sectors, users can better understand market trends and make informed trading decisions. Credit for the indicator goes to Eric Krull from the Lifecycle Trade team who has showcased the idea for it.
––––WHAT IT DOES 💡
The Eric Krull's Index and Sector Performance Indicator allows traders to:
👉 Monitor the performance of various market indexes, such as the Nasdaq Composite, Renaissance IPO ETF, NYSE Composite, DJIA, and SP500 and compare them to one another
👉Track the performance of 11 user input tickers or ETFs representing major sectors, providing insights into market trends and sector strength (could also compare stocks or other instruments like bonds, crypto or FOREX)
👉Assess overall market health by analyzing the Year-to-Date (YTD) performance of the selected indexes and input tickers.
👉Calculate where in the year to date range is the ticker/sector currently since the beginning of the year.
––––HOW TO USE IT 🔧
Using the Eric Krull's Index and Sector Performance Indicator is simple:
👉Add the indicator to your TradingView chart by searching for " Eric Krull's YTD Market Indexes" in the indicators list.
👉Customize the indicator by entering your desired symbols for the 11 custom ETFs, representing the major sectors you wish to analyze.
👉Adjust the table position on your chart by selecting from the available options: Top Left, Top Center, Top Right, Middle Left, Middle Center, Middle Right, Bottom Left, Bottom Center, or Bottom Right.
👉Review the table to analyze the YTD performance, percentage change, and range of each index and sector, which will help you identify leading sectors and gauge overall market health. Compare the sectors against one another to see where money are flowing in and also compare the overall performance in the index.
By utilizing the Eric Krull's Index and Sector Performance Indicator, you can make informed trading decisions based on the current market trends and sector performance. Stay ahead of the market by understanding which sectors are leading and use this knowledge to adapt your trading strategy accordingly.

Selected Dates Filter by @zeusbottradingWe are presenting you feature for strategies in Pine Script.
This function/pine script is about NOT opening trades on selected days. Real usage is for bank holidays or volatile days (PPI, CPI, Interest Rates etc.) in United States and United Kingdom from 2020 to 2030 (10 years of dates of bank holidays in mentioned countries above). Strategy is simple - SMA crossover of two lengts 14 and 28 with close source.
In pine script you can see we picked US and GB bank holidays. If you add this into your strategy, your bot will not open trades on those days. You must make it a rule or a condition. We use it as a rule in opening long/short trades.
You can also add some of your prefered dates, here is just example of our idea. If you want to add your preffered days you can find them on any site like forexfactory, myfxbook and so on. But don’t forget to add function “time_tradingday ! = YourChoosedDate” as it is writen lower in the pine script.
Sometimes the date is substituted for a different day, because the day of the holiday is on Saturday or Sunday.
Made with ❤️ for this community.
If you have any questions or suggestions, let us know.
The script is for informational and educational purposes only. Use of the script does not constitutes professional and/or financial advice. You alone the sole responsibility of evaluating the script output and risks associated with the use of the script. In exchange for using the script, you agree not to hold zeusbottrading TradingView user liable for any possible claim for damages arising from any decision you make based on use of the script.

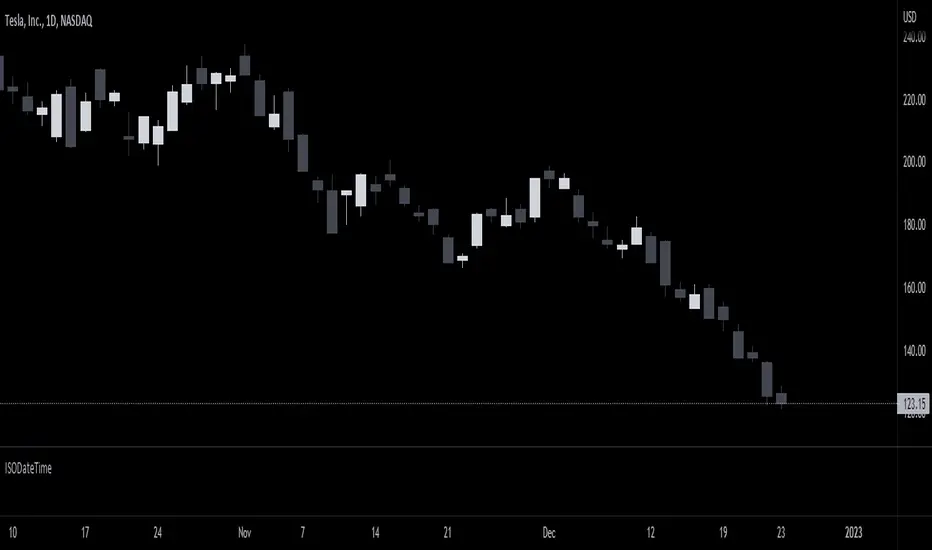
ISODateTimeLibrary "ISODateTime"
getDateParts(dateStr)
Get year, month, day from date string.
Parameters:
dateStr : : ISO 8601 format, i.e. "2022-05-04T14:00:00.001000-04:00" or "2022-05-04T14:00:00Z"
Returns: array of int
getTimeParts(dateStr)
Get hour, minute, seconds from date string.
Parameters:
dateStr : : ISO 8601 format, i.e. "2022-05-04T14:00:00.001000-04:00" or "2022-05-04T14:00:00Z"
Returns: array of int
getUTCTimezone(dateStr)
Get UTC timezone.
Parameters:
dateStr : : ISO 8601 format, i.e. "2022-05-04T14:00:00.001000-04:00" or "2022-05-04T14:00:00Z"
Returns: string UTC timezone
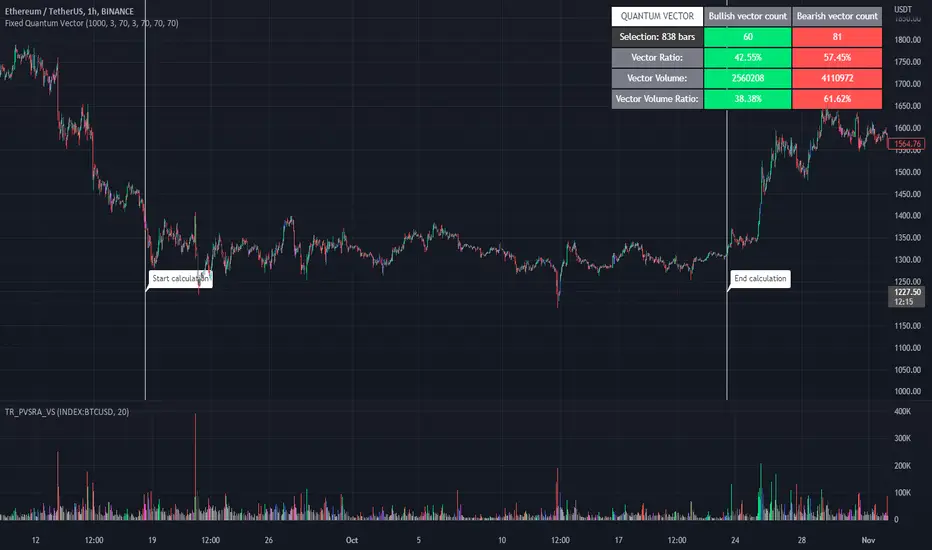
Fixed Quantum VectorSelect a zone to analyse the vectors.
This screener show the ratio of the bullish and bearish candle vector and on volume.
Slide the white bar to choose your sample size or you can enter the date.
Click label to hide start calculation and end calculation.
- Happy trading
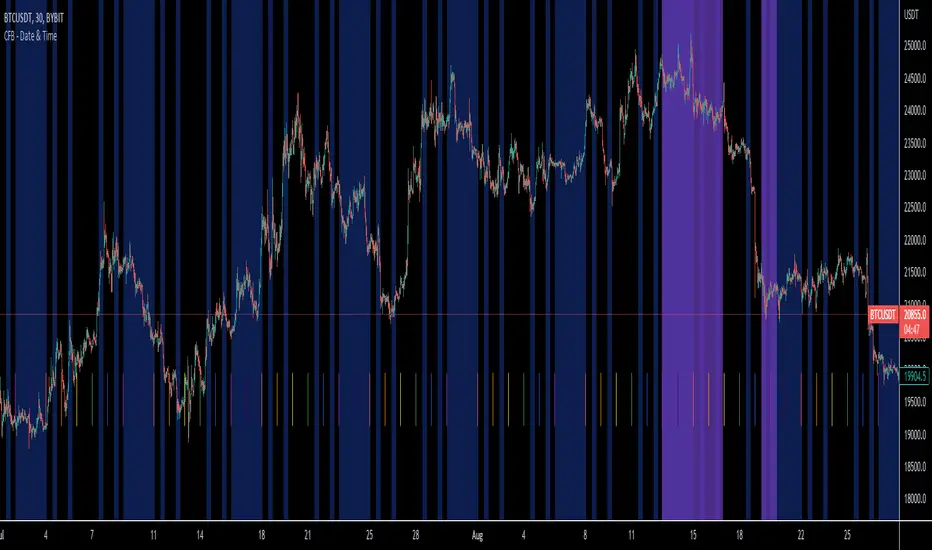
CFB Utility - Date & TimeCrypto Fusion Bot's new and improved Date and Time Indicator! Avoid trades like never before with new features and time zone compatibility.
New Features Include:
Every Time Zone that little peanut can imagine!
Time declaration down to the 3 minute!
C.F.B. themed colors
Day Start indication
User friendly layout
DateNow█ OVERVIEW
Library "DateNow"
TODO: Provide today's date based on UNIX time
█ INSPIRATIONS
Use pinescript v4 functions such as year(), month() and dayofmonth().
Use pinescript v5 function such as switch.
Export as string variables.
Not using any match function such as math.floor.
█ CREDITS
RicardoSantos
█ KNOWN ISSUES
Date for Day display incorrectly by shortage 1 value especially Year equal to or before 1984
Timezone issue. Example : I using GMT+8 for my timezone, try using other GMT will not work. Al least, GMT+2 to GMT+13 is working. GMT-0 to GMT+1 is not working, although already attempt using UTC-10 to UTC-1.
dateNow()
: DateNow
Parameters:
: : _timezone
Returns: : YYYY, YY, M, MM, MMM, DD

DATE and ATR20 for practice using kojiro_indicatorsThis is an indicator to display ATR20, EMA100 of ATR20 and date at a glance for trade practices using kojiro_indicaotrs.
This will allow you to easily perform your practices.
Please change the period of EMA and the display interval and size of the indicator as needed.
Please enter small, normal, large, huge, or auto for the size.
The following is in Japanese.
小次郎講師のインジケーターでプラクティスする際に、
ATR、日付を見やすくするためのインジケーターです。
サイズや間隔を変更可能です。サイズはnormal、normal、large、huge、autoを入力してください。

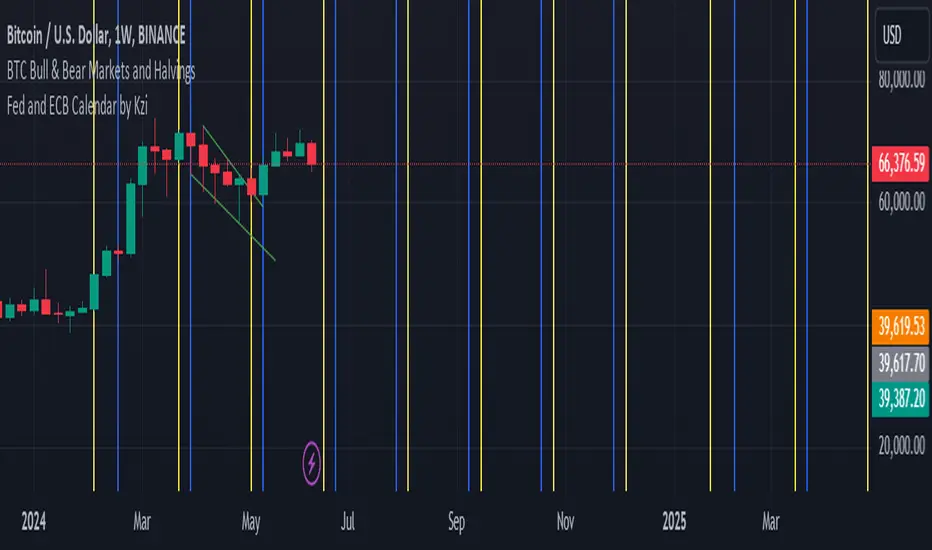
Fed and ECB Calendar by KziHello traders,
Here is a script that i've done for testing the timestamp and the input.time fonction.
You can see verticals lines blue and yellow.
The blue are the ECB meeting date (7 dates)
The yellow are the FED meeting date. (10 Dates)
// In the parameter you can enter the next rolling month date for ECB and FED
// I don't figure out how to add label / Txt on the lines
// And be carreful i don't put the real hours of the meeting.
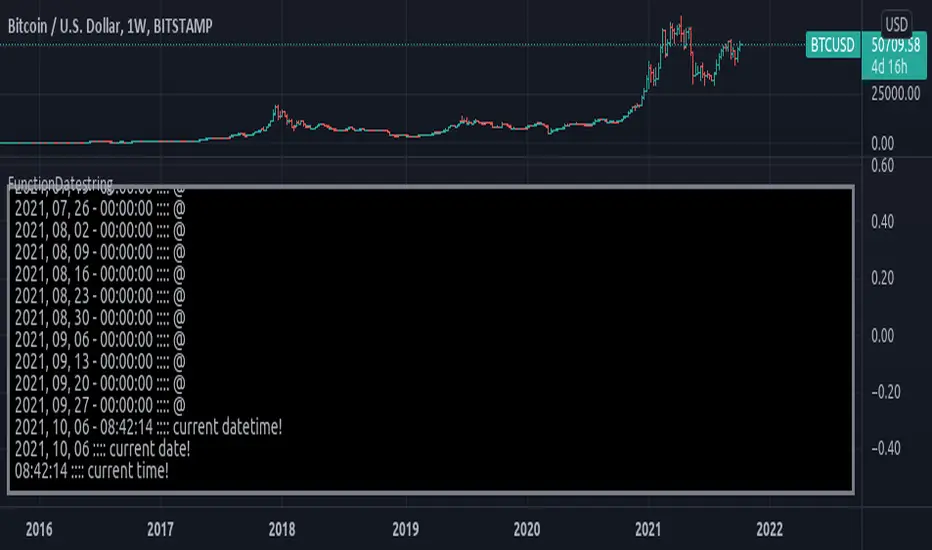
FunctionDatestringLibrary "FunctionDatestring"
Methods to stringify date/time, altho there is already builtin support for it.
datetime(unixtime) a stringified date stamp at specified unix time.
Parameters:
unixtime : int unix timestamp.
Returns: string
date_(unixtime) a stringified date stamp at specified unix time.
Parameters:
unixtime : int unix timestamp.
Returns: string
time_(unixtime) a stringified date stamp at specified unix time.
Parameters:
unixtime : int unix timestamp.
Returns: string
VWAP StdDev Bands - Multi-type VWAP: Period, Date, EarningsThis VWAP indicator differs from the rest in that it is customizable for 3 distinct VWAP types, among other features that may be useful.
VWAP types:
Period Based VWAP
Date Anchored VWAP
Earnings Based VWAP
Additional features common to all VWAP types:
Standard Deviation Bands
Coloring based on Price vs Deviation Bands
Coloring of VWAP based on VWAP Slope
Each of the VWAP types are described below:
Period VWAP
Simple period VWAP which allows preset, as well as custom periods.
Resets at the start of each period.
Also allows setting a custom session time for reset at specific time of day.
Date VWAP
Date anchored VWAP which does not reset.
VWAP will start from the selected date.
Pictured: AAPL Date VWAP from 2018-08-27
Earnings VWAP
VWAP which resets on every earnings report. The symbol must be stock with available earnings data.
Multiple types can be used in conjunction with one another only by adding multiple of the indicator to your chart.
Feel free to leave any comments, questions, or bug reports. All are welcome.
Enjoy!

Custom Date Buy/Sell StrategyThis strategy allows you to back test longing or shorting during a period of time between two dates.
Make sure you are in the daily time frame while viewing the performance and trade history to ensure you have the most historical data as possible from Trading View.
Finally, due to the way Trading View enters trades at the end of a candle, you must subtract one day from your starting and your end dates.
