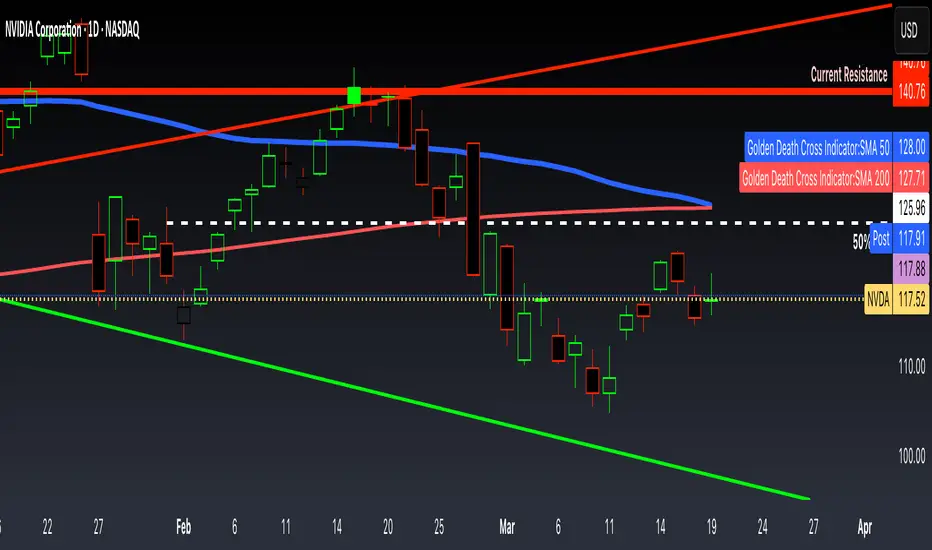
Golden Death Cross IndicatorThis indicator uses moving average to detect both a Golden Cross and Death Cross on any timeframe but is recommended for use on the daily and 24 hour timeframes only.
We have also provided instructions on how to create alerts for these indicators below.
Happy Trading!
Moving Averages: We’ll use Simple Moving Averages (SMA). The 50-day SMA looks at the average price over the last 50 periods, and the 200-day SMA does the same for 200 periods.
Crossovers: We’ll check when the 50-day SMA crosses above (Golden Cross) or below the 200-day SMA (Death Cross).
Set Up Alerts
Now, let’s make sure you get notified when a cross happens:
Open the Alerts Menu
On the chart, click the bell icon (top right of the screen) to create an alert.
Configure the Golden Cross Alert
In the “Condition” dropdown, select “Cross Alerts” (the name of your script).
Below that, select “Golden Cross.”
Set “Once Per Bar Close” in the next dropdown (this ensures it only triggers after the period ends, avoiding false signals mid-bar).
Choose how you want to be notified (e.g., popup, email, or phone app—set this under “Notifications”).
Name the alert (e.g., “Golden Cross Alert”) and click “Create.”
Configure the Death Cross Alert
Click the bell icon again to create a second alert.
Condition: “Cross Alerts” > “Death Cross.”
Set “Once Per Bar Close” again.
Choose your notification method.
Name it (e.g., “Death Cross Alert”) and click “Create.”
Deathcross
TradZoo - EMA Crossover IndicatorDescription:
This EMA Crossover Trading Strategy is designed to provide precise Buy and Sell signals with confirmation, defined targets, and stop-loss levels, ensuring strong risk management. Additionally, a 30-candle gap rule is implemented to avoid frequent signals and enhance trade accuracy.
📌 Strategy Logic
✅ Exponential Moving Averages (EMAs):
Uses EMA 50 & EMA 200 for trend direction.
Buy signals occur when price action confirms EMA crossovers.
✅ Entry Confirmation:
Buy Signal: Occurs when either the current or previous candle touches the 200 EMA, and the next candle closes above the previous candle’s close.
Sell Signal: Occurs when either the current or previous candle touches the 200 EMA, and the next candle closes below the previous candle’s close.
✅ 30-Candle Gap Rule:
Prevents frequent entries by ensuring at least 30 candles pass before the next trade.
Improves signal quality and prevents excessive trading.
🎯 Target & Stop-Loss Calculation
✅ Buy Position:
Target: 2X the difference between the last candle’s close and the lowest low of the last 2 candles.
Stop Loss: The lowest low of the last 2 candles.
✅ Sell Position:
Target: 2X the difference between the last candle’s close and the highest high of the last 2 candles.
Stop Loss: The highest high of the last 2 candles.
📊 Visual Features
✅ Buy & Sell Signals:
Green Upward Arrow → Buy Signal
Red Downward Arrow → Sell Signal
✅ Target Levels:
Green Dotted Line: Buy Target
Red Dotted Line: Sell Target
✅ Stop Loss Levels:
Dark Red Solid Line: Stop Loss for Buy/Sell
💡 How to Use
🔹 Ideal for trend-following traders using EMAs.
🔹 Works best in volatile & trending markets (avoid sideways ranges).
🔹 Can be combined with RSI, MACD, or price action levels for added confluence.
🔹 Recommended timeframes: 1M, 5M, 15m, 1H, 4H, Daily (for best results).
🚀 Try this strategy and enhance your trading decisions with structured risk management!

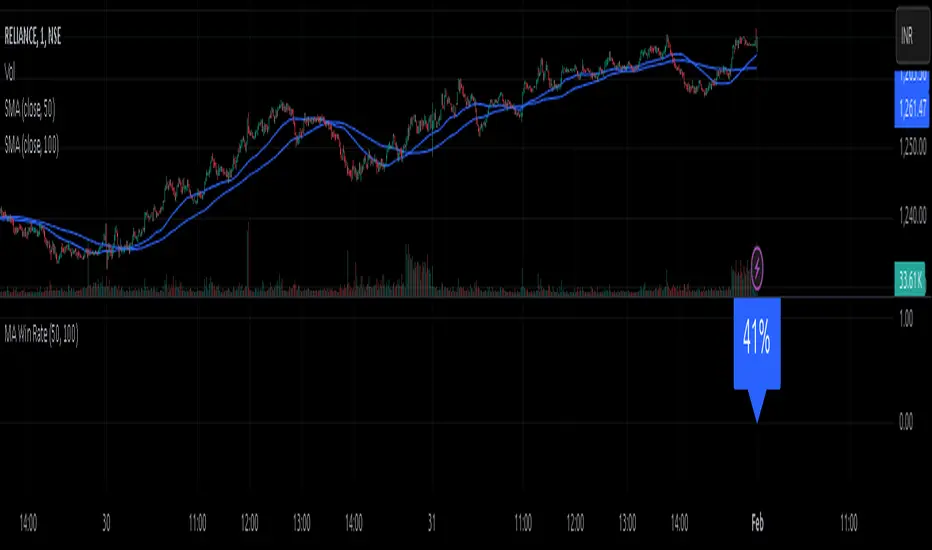
MA Win RateMoving Average Cross Win Rate
This simple yet useful script calculates the percentage of times a moving average crossover successfully predicts price movement.
Win Conditions:
1] A Golden Cross (fast MA crossing above slow MA) where the price moves up afterward.
2] A Death Cross (fast MA crossing below slow MA) where the price moves down afterward.
In this script, I have used a Simple Moving Average (SMA) for illustration.
You can modify the code to apply any type of moving average and test its accuracy.
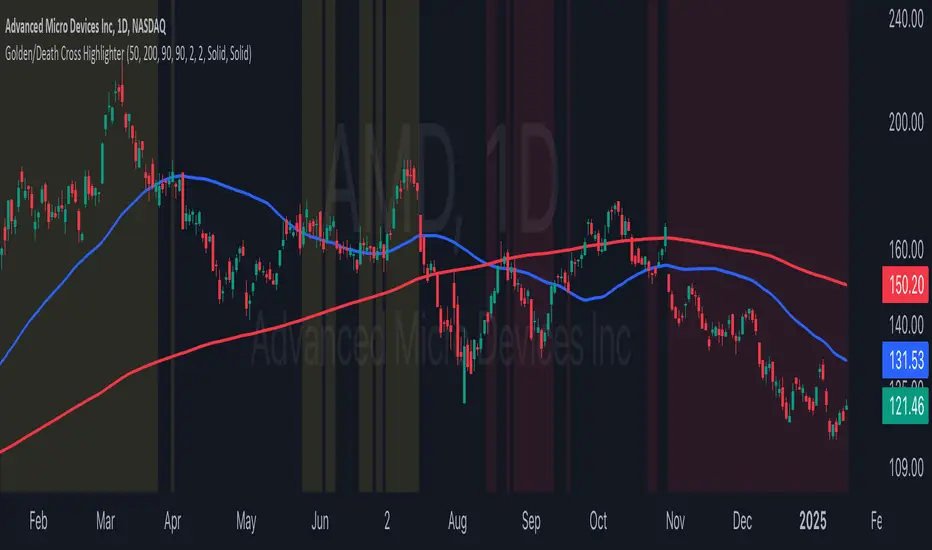
Golden/Death Cross HighlighterThis indicator helps you easily identify and visualize Golden Cross and Death Cross patterns combined with price action confirmation. It highlights chart backgrounds when specific conditions are met, making it easy to spot potential trend changes.
🔑 Key Features:
Highlights Golden Cross conditions (50 SMA crosses above 200 SMA) when price closes above both MAs
Highlights Death Cross conditions (50 SMA crosses below 200 SMA) when price closes below both MAs
Customizable MA lengths (default: 50 and 200)
Adjustable highlight opacity
Built-in alerts for cross events
Clear visualization of both moving averages
📈 Color Guide:
Yellow Background: Golden Cross active + price above both MAs
Red Background: Death Cross active + price below both MAs
⚙️ Settings:
Fast MA Length: Length of faster moving average (default 50)
Slow MA Length: Length of slower moving average (default 200)
Golden Cross Highlight Opacity: Adjust visibility of bullish highlights
Death Cross Highlight Opacity: Adjust visibility of bearish highlights
💡 Usage Tips:
Use in combination with other indicators for confirmation
Set up alerts for potential trend changes
Adjust opacity to match your chart style
Works best on higher timeframes (4H, Daily, Weekly)
Golden & Death Cross with Re-Activation [By Oberlunar]🎄 Merry Christmas to All Traders! 🎄
Let me introduce you to a practical and customizable classic tool: the Golden & Death Cross with Re-Activation. This script is designed to help you navigate the markets with precision and adaptability.
Why Is This Script Important?
1. Customizable Moving Averages
You can choose from SMA, EMA, WMA, HMA, or RMA for both moving averages. This flexibility allows you to tailor the strategy to fit different markets and trading styles.
2. Smart Signal Handling
The script generates Golden Cross (LONG) and Death Cross (SHORT) signals while deactivating them automatically when the moving averages start to converge, avoiding unnecessary noise.
3. Reactivation Based on Distance Threshold
With the treshold parameter, signals are reactivated only when the moving averages move apart sufficiently, ensuring that the signals remain meaningful and not just random market noise.
What Are These Moving Averages?
SMA (Simple Moving Average),
EMA (Exponential Moving Average),
WMA (Weighted Moving Average),
HMA (Hull Moving Average),
RMA (Relative Moving Average)
Community Input
We invite you to test this script on various markets (forex, stocks, crypto) and share your insights:
Which moving average combination works best for EUR/USD?
How about BTC/USD?
Does the treshold make a noticeable difference?
Let us know in the comments!
Example Settings
MA 1 Type: HMA, Length: 21
MA 2 Type: HMA, Length: 200
Reactivation Threshold: 0.5
Experiment with it, and let us know your findings.
Wishing you a calm holiday season and a profitable new year ahead! 🎁
🎄 Merry Christmas and Happy Trading! 🎄

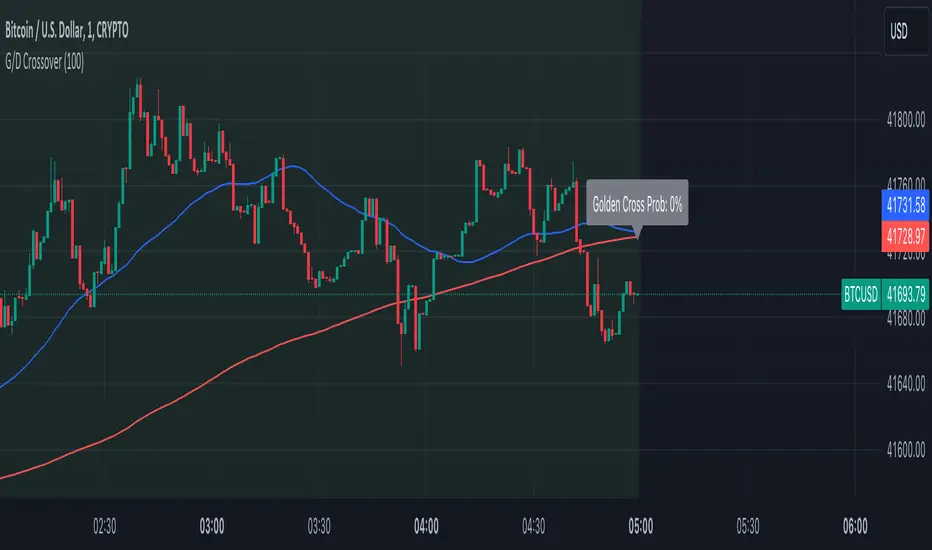
Golden Cross and Death Cross with ProbabilityThe Advanced Golden and Death Crossover Indicator offers traders a powerful tool for identifying potential buy and sell signals through the classic technical analysis method of moving average crossovers. This script enhances decision-making by dynamically changing the chart background color in response to Golden (bullish) and Death (bearish) crossovers, providing a visual representation of the market's momentum.
Features:
Golden and Death Crossover Detection: Utilizes a 50-period SMA and a 200-period SMA to identify potential buy (golden cross) and sell (death cross) points.
Continuous Background Coloring: Changes the chart's background color to green for golden crosses and red for death crosses, offering an intuitive grasp of market trends.
Customizable Lookback Period: Allows users to adjust the lookback period for calculating the success rate of each crossover, making the indicator adaptable to various trading strategies.
Success Rate Calculation: Provides an additional layer of analysis by calculating the historical success rate of crossovers within the specified lookback period.
Instructions:
Adding the Indicator: Search for "Advanced Golden and Death Crossover Indicator" in the TradingView Indicators & Strategies library and add it to your chart.
Customization: Access the indicator settings to adjust the lookback period according to your trading preferences.
Interpretation: Use the continuous background color as a guide to market conditions, with green indicating bullish momentum and red indicating bearish momentum. The success rate of past crossovers can help assess the reliability of the signals.
How the Script Works:
The Advanced Golden and Death Crossover Indicator operates by continuously monitoring two key moving averages (MAs) on your chart: a short-term (50-period) SMA and a long-term (200-period) SMA. Here's a step-by-step breakdown of its functionality:
Crossover Detection:
Golden Cross: When the short-term MA crosses above the long-term MA, indicating potential bullish momentum, the script identifies this as a Golden Cross signal.
Death Cross: Conversely, when the short-term MA crosses below the long-term MA, suggesting potential bearish momentum, the script flags this as a Death Cross signal.
Background Coloring:
Upon detecting a Golden Cross, the script changes the chart background to green, visually representing a bullish market condition.
Upon detecting a Death Cross, the chart background turns red, indicating bearish market conditions.
This color change remains in effect until the next crossover event, providing a continuous visual cue of the market's trend direction.
Success Rate Calculation:
The script calculates the historical success rate of these crossovers within a user-defined lookback period. This metric helps assess the reliability of the signals based on past performance.
Customization:
Users have the flexibility to adjust the lookback period for the success rate calculation, allowing for customization according to individual trading strategies and risk preferences.
Application in Trading Analysis:
Traders can use this indicator as part of their technical analysis toolkit to make informed decisions about entry and exit points. The visual cues from the continuous background coloring, combined with the success rate of past signals, provide a comprehensive overview of market trends and crossover reliability. It’s important for traders to combine this indicator with other analysis tools and consider broader market conditions to optimize their trading strategy.
Disclaimer:
This script is provided for educational and informational purposes only and should not be construed as investment advice. Trading involves risk, and you should conduct your own research or consult a financial advisor before making investment decisions. The author or distributor of this script bears no responsibility for any trading losses incurred by users.
Color Changing MACDJapanese below / 日本語説明は下記
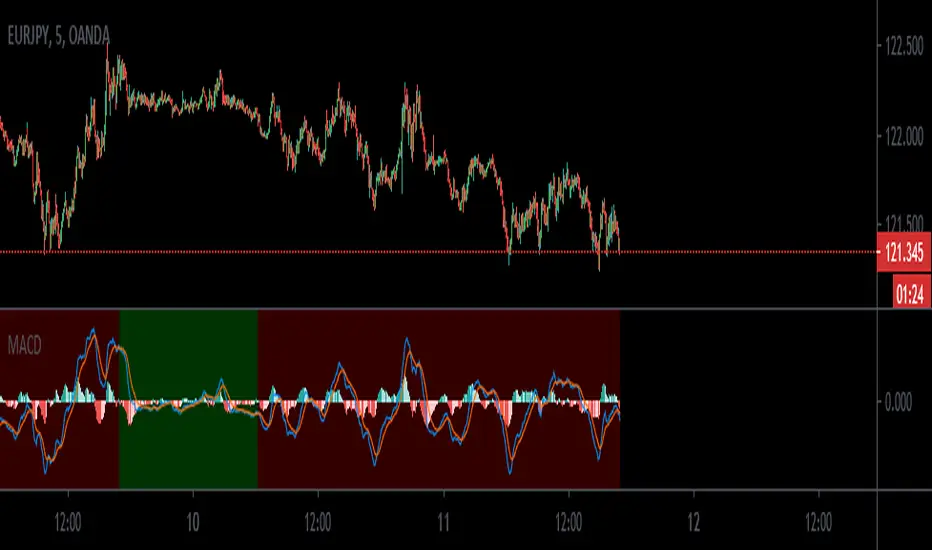
This indicator shows MACD with its colors changing based on trend strength.
The purpose of this indicator is to visually understand phases of trends, which are beginning, advancing and ending, measuring the range between MACD line and signal line.
Since MACD is originated from moving average, the range between MACD line and signal line gradually expands as trends progress while the range gets narrowed as trends come closer to the end. The indicator visualizes this characteristics.
The colors change as follows:
Green: In bullish trend, the range between MACD and signal gets expanded from previous candle, which indicates up trends continue
Purple: The range between MACD and signal gets narrowed from previous candle, which indicates trends gradually come to end.
Red: In bearish trend, the range between MACD and signal gets expanded from previous candle, which indicates down trends continue
See the chart below.
Features
Coloring
MACD line and signal line's colors change according to the logic above.
You can also fill the gap between MACD line and signal line with the same color changing logic as lines.
Signals
Golden cross and death cross signals can be displayed.
Alert
Alerts can be set when golden and death crosses occur.
---------------------
トレンドの強弱で色が変わるMACDのインジケーターです。トレンドが初期、進展期、終了期と移り変わる様子を視覚的に判断できることを目的に開発しています。
トレンドの強弱はMACDラインとシグナルラインの幅で判断します。
MACDは移動平均線を元にしたインジケーターであるため、トレンドが進展するにつれMACDラインとシグナルラインの幅は徐々に広がります。一方で、トレンドが終盤に差し掛かかるにつれ上記の幅は狭まります。インジケーターはこのMACDの特徴を色で可視化します。
色は以下の通り変化します。
緑:上昇トレンドにおいて、MACDラインとシグナルラインの幅が前のローソク足のそれよりも拡大している場合
=>トレンドの勢いが強まっていることを示唆
紫:MACDラインとシグナルラインの幅が前のローソク足のそれよりも縮小している場合
=>トレンドの勢いが弱まっていることを示唆
赤:下降トレンドにおいて、MACDラインとシグナルラインの幅が前のローソク足のそれよりも拡大している場合
=>トレンドの勢いが強まっていることを示唆
サンプルチャート
機能
色変更
上記のロジックでMACDとシグナルラインの色を変更します。また両ラインの間をラインと同じロジックで塗りつぶすことも可能です。
シグナル
ゴールデンクロスとデッドクロスでシグナルを表示
アラート
ゴールデンクロスとデッドクロスでアラートを設定可能

EMA ON MA SETSOORY FOR MY EINGLISH
ITS NOT MY NATIVE AND IM NOT GOING TO GOOGLE TRANSLATE THIS
this is a beuaitful indicator that plot EMA that gat is calc from another ma and length for your choise so you will get an = 'ema on ma '
it can plot you more beautiful results and more smoothing results
i added golden/death cross for all ma
enjoy !
היי חברים זה בעצם אינדיקטור של ממוצע נע על ממוצע נע לנוחיכותכם
הפלט הראשי הוא EMA
הוא לוקח את החישוב שלו ממוצע אחר והאורך שתגדירו
נותן תוצאה יותר חלקה של ממוצעים נעים
הוספתי חתיוכים בין ההמוצעים
תהנו.

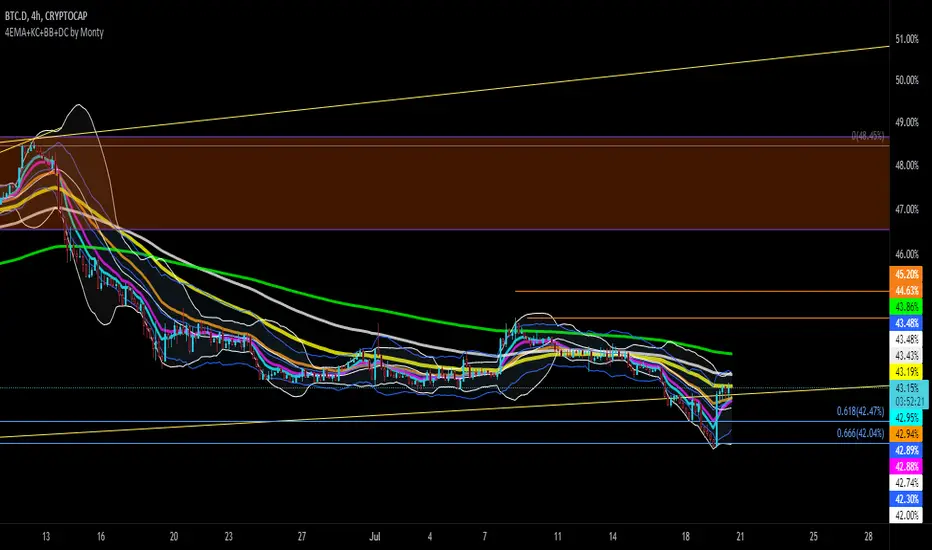
4EMA+KC+BB+DC by MontyI combined these scripts for my friend.
This script contains some imported work from @PatekCharts and I added the KC channels.
It's not that difficult.
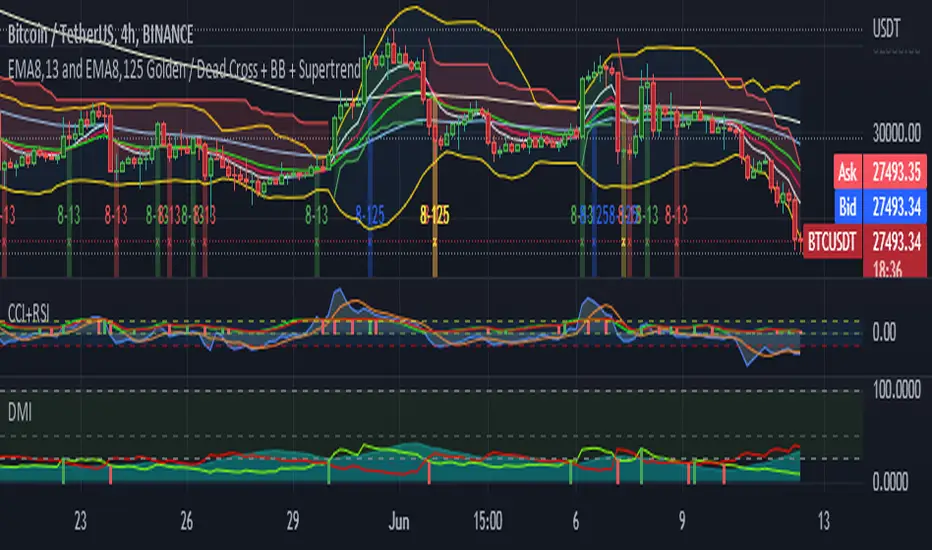
5EMA(8,13,21,55,125) w/ EMA8-13 + EMA8-125 GC/DC Signal-by TerryThis Script are Combined 5 EMAs Indicator with Golden / Death Cross EMA 8 -13 and EMA 8 - 125 within Green or Red Column Line as Default Signal. This Indicator also combined with Ballinger Band and Super Trend Channel.
If you have like this Indicator, please add to your favorite Indicator, and If You Don't, Don't be like a man without woman :) ... God Bless You All
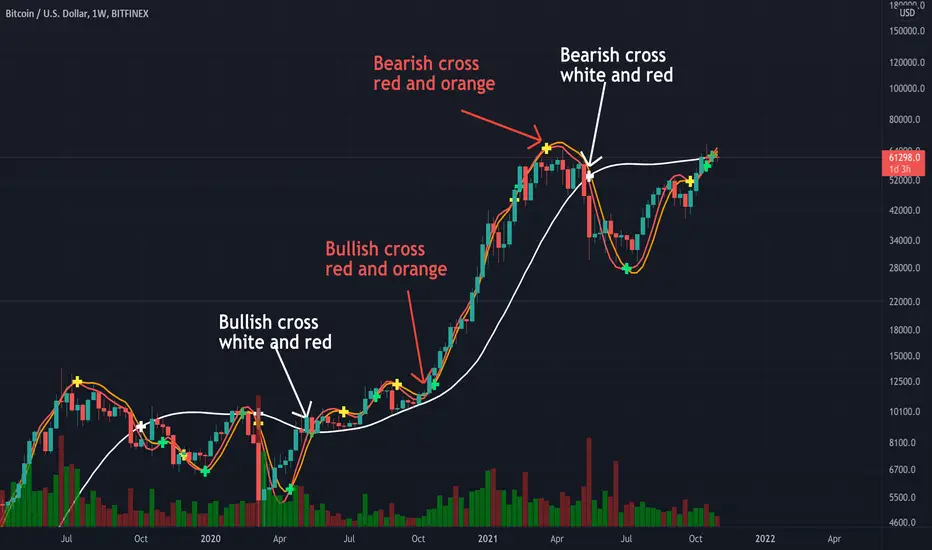
Triple Modified Hull Moving Average Cross By <Zakaria>Triple Modified Hull Moving Average Cross By
What is this?
this is a modified formula for Hull moving average, it is more accurate and predicts the golden and death cross earlier.
How to use?
Work better in high time frames (1D,1W)
the white line vs the red and the orange lines :
1 - when the white line crosses the red and the orange lines from the bottom the price will go down . Death cross!
2 - when the white line crosses the red and the orange lines from the top the price will go up . Golden Cross!
the red line vs the orange line :
1- when the orange line crosses the red line from the bottom the price will go down . Death cross!
2 - when the orange line crosses the red line from the top the price will go up . Golden Cross!
p.s: the lag between these two lines will be very small. use it in the 1W time frame to predict where exactly the bull market will end.
You can input your personalized values if you want!
SMA PredictionThis indicator predicts future moving average (SMA) values assuming the prices remains at configured level (-50% to +50%).
It can be used to predict golden/death crosses as well - when two of these indicators are on - one configured for length 50 and one for length 200.
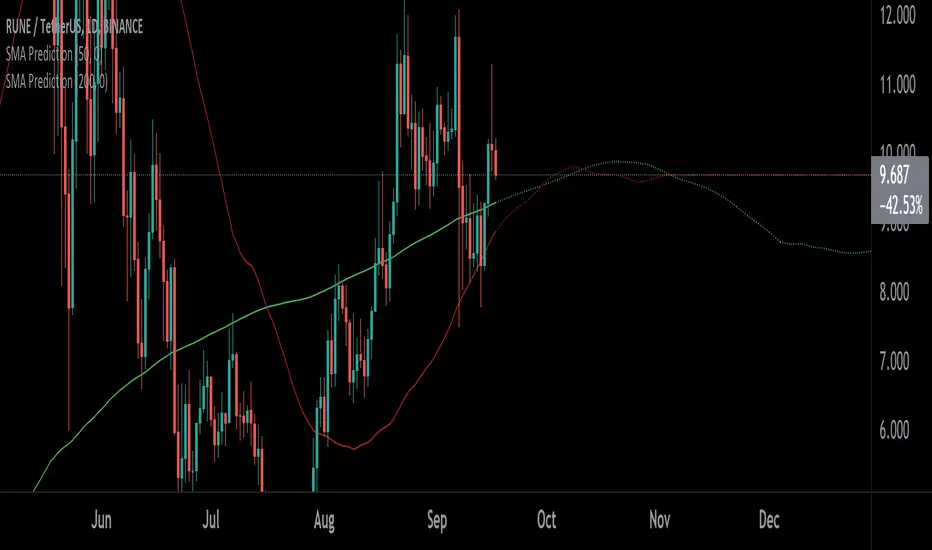
Golden/Death Cross PredictionScript which calculates/predicts future golden/death cross times assuming the prices remains at configured level (-50% to +50% relative to current price)

Easy Entry/Exit Trend Colors (With Alerts)This is an updated version of user Algokid's script called 'AK MACD BB INDICATOR V 1.00'. You can find that original script here:
I added many alerts along with the Bullish and Bearish alerts when the MACD crosses over the Upperband or crosses down on the Lowerband.
I personally use this indicator with Crypto charts (Bitcoin on a 15min, 1hour, and 4 hour timeframe) as one of many confirmations that it's a good time to enter a trade. This script was made to be easy to follow with the colors of GREEN triangles being a good uptrend or entry confirmation, and RED being a confirmation to sell/short or exit your trade.
It's important to use this indicator in combination with other indicators that can give you more confirmations to enter or exit a trade, and make sure you are on normal candles and not HA or any other candles as you can get wildly inaccurate results.
This script also has the Death & Golden crosses, which is the slow and fast moving averages crossing over each other. I don't use this as an additional confirmation, it's just nice to know where the cross happens.

Crypto EMA+MA+MACS by hobbeLeThis is an indicator that includes several EMAs and MAs (Used in Cryptotrading).
In addition, the Golden and Death Cross are also displayed.
Used MAs
MA 7 - Orange Line
MA 21 - Yellow Line
MA 25 - Grey Line
MA 99 - Blue Line
MA 200 - Green Line
Used EMAs
EMA 200 - Grey Dotted Line
EMA 222 - Pink Dotted Line
Golden Cross
Crossover MA25 + MA200
Death Cross
Crossunder MA25 + MA200
What is a Moving Average (MA) ?
A moving average (MA) is a widely used indicator in technical analysis that helps smooth out price action by filtering out the “noise” from random short-term price fluctuations.
Moving average is a trend-following, or lagging, indicator because it is based on past prices. The most common applications of moving averages are:
to identify the trend direction
to determine support and resistance levels
The two basic and commonly used moving averages are the simple moving average ( SMA ), which is the arithmetic average of a security over a defined number of time periods, and the exponential moving average ( EMA ), which gives greater weight to more recent prices.
What is a Golden Cross?
The golden cross is a candlestick pattern that is a bullish signal in which a relatively short-term moving average crosses above a long-term moving average. The golden cross is a bullish breakout pattern formed from a crossover involving a security's short-term moving average (such as the 15-day moving average) breaking above its long-term moving average (such as the 50-day moving average) or resistance level. As long-term indicators carry more weight, the golden cross indicates a bull market on the horizon and is reinforced by high trading volumes.
What Is a Death Cross?
The death cross is a technical chart pattern indicating the potential for a major selloff. The death cross appears on a chart when a stock’s short-term moving average crosses below its long-term moving average.
Source; Investopedia

Easy Loot Golden CrossGolden/Death Cross Moving Average Indicator
30, 100 & 200 period Simple Moving Average (SMA).
30 = Yellow
100 = Green
200 = Black
Black crosses mark the 'golden crosses' as well as the 'death crosses'. These black crosses appear when the 30 crosses the 100 & when the 100 crosses the 200. These black crosses don't tell you when to buy/sell, but simply indicate interest in the market.
This code is open-source so feel free to add this indicator to your chart and play around with the different moving average timeframes & color schemes.
Golden Cross
The golden cross occurs when a short-term moving average crosses over a major long-term moving average to the upside and is interpreted by analysts and traders as signaling a definitive upward turn in a market. Basically, the short-term average trends up faster than the long-term average, until they cross.
There are three stages to a golden cross:
A downtrend that eventually ends as selling is depleted
A second stage where the shorter moving average crosses up through the longer moving average
Finally, the continuing uptrend, hopefully leading to higher prices
Death Cross
Conversely, a similar downside moving average crossover constitutes the death cross and is understood to signal a decisive downturn in a market. The death cross occurs when the short term average trends down and crosses the long-term average, basically going in the opposite direction of the golden cross.
The death cross preceded the economic downturns in 1929, 1938, 1974, and 2008.

Golden & Death CrossThis indicator allows you to see Golden Cross and Death Cross.
Each Sma line can be hidden.
It is for educational purposes only.
Enjoy it.
Best Regards,
Bilgin , Kaptanin Seyir Defteri

MACD_trendtrader v2 (picte)This is an upgraded version of my MACD_trendtrader indicator.
UPGRADES:
- Histogram slope changes colors according to the direction of the slope.
- Panel that displays volatility of the asset. The volatility is measured from 0 to 100. Zero being the lowest and 100 the highest volatility. I also included different text colors for a certain volatility value (white= very low volatility, blue = low volatility, purple= high volatility, green= very high volatility)
It works well on all time-frames but i found it particularly useful on the lower time-frames for identifying pullbacks in a trending market.
It has been tested in the Forex and Traditional market.

MACD_trendtraderThis is my modified macd indicator. It uses moving averages to determine the trend of the market. It is best used on lower time frames such as 5min and 15min. I found it useful especially with Forex pairs and also traditional markets.
This indicator will help you get in at a pullback in a trending market.
RED background tells you the trend is down. A possible entry happens when you get a sell signal from the macd oscillator above the 0 line.
GREEN background tells you the trend is up. A possible entry happens when you get a buy signal from the macd oscillator below the 0 line.
a couple of examples:
Leave your feedback in the comments. Enjoy:)
Big Picture 50/200Crazy as this may sound, it took 126 iterations to get something so simple sone right.
Big Picture helps offload some longer-term SMA lines off your chart so you can clutter it up again with some other stuff. It works by comparing SMAs 50 and 200 in histogram form. If the histogram is over the zero-line, 50 is over 200, and vice versa.
The histogram is green when the slope rises, suggesting that 50 is rising relative to 200. When the histogram turns red, 50 is falling.
Some Heikin-Ashi inspired averaging helps smooth the line just a little to help give a better idea as to overall trend.

eha MA CrossIn the study of time series, and specifically technical analysis of the stock market, a moving-average cross occurs when, the traces of plotting of two moving averages each based on different degrees of smoothing cross each other. Although it does not predict future direction but at least shows trends.
This indicator uses two moving averages, a slower moving average and a faster-moving average. The faster moving average is a short term moving average. A short term moving average is faster because it only considers prices over a short period of time and is thus more reactive to daily price changes.
On the other hand, a long term moving average is deemed slower as it encapsulates prices over a longer period and is more passive. However, it tends to smooth out price noises which are often reflected in short term moving averages.
There are a bunch of parameters that you can set on this indicator based on your needs.
Moving Averages Algorithm
You can choose between three types provided of Algorithms
Simple Moving Average
Exponential Moving Average
Weighted Moving Average
I will update this study with more educational materials in the near future so be informed by following the study and let me know what you think about it.
Please hit the like button if this study is useful for you.

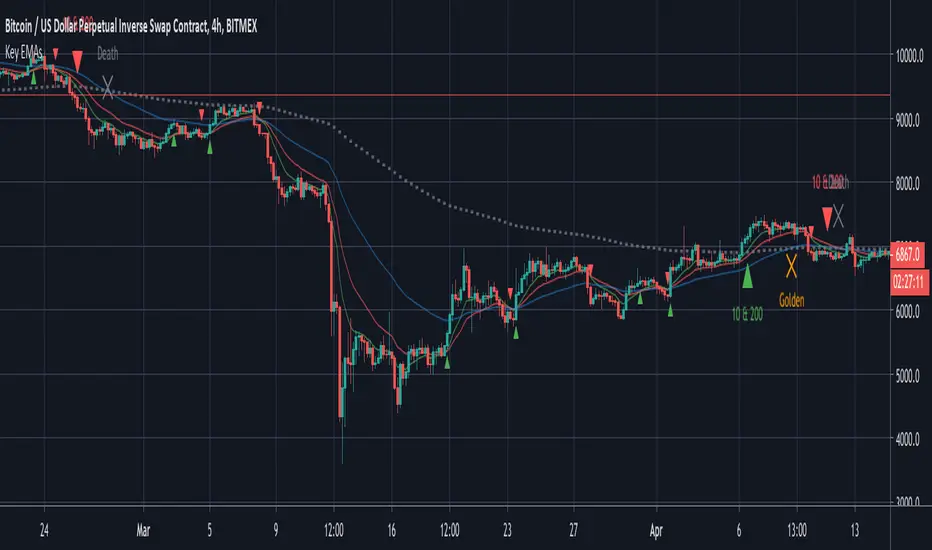
Key EMAsSimple trade helper script that plots:
- 10 & 20 EMA crosses for fast moves
- 10 & 200 EMA crosses for trends
- 50 & 200 EMA golden and death crosses
Alerts built in.
Rhaps SMAEMA Combo v1.1There's many versions of this sort of thing around the Tradingview library, but i guess we all like things to our own specifications.
So this is my take on the SMA and EMA version combined.
Bunch of SMA's & EMA's, with labels, and G&D Cross Labels and Alerts.
These values can of course be changed to any you may prefer.
Rhapsodyy's Combo SMAEMA's v1.1
SMA's with Painted Labels : 10/30/50/80/200
EMA's with Painted Labels : 21/50/89/200/377
50SMA / 200SMA Golden & Death Crosses on Current Timeframe & Alerts
Daily 50SMA / 200SMA Golden & Death Crosses overlayed onto Current Timeframe & Alerts
50EMA / 200EMA Golden & Death Crosses on Current Timeframe & Alerts
Daily 50EMA / 200EMA Golden & Death Crosses overlayed onto Current Timeframe & Alerts
