Delta Volume BubblesDelta Volume Bubbles
Overview
The Delta Volume Bubbles indicator is an advanced order flow visualization tool that displays buying and selling pressure through dynamic bubble representations on your chart. Unlike traditional volume indicators that only show total volume, this indicator calculates the net delta volume (difference between buying and selling volume) and presents it as color-coded bubbles of varying sizes.
How It Works
Core Calculation Method
The indicator uses a sophisticated approach to estimate delta volume from standard OHLCV data:
1. Price Action Analysis: Analyzes the relationship between open, high, low, and close prices to determine market aggression
2. Body Ratio Calculation: body_ratio = |close - open| / (high - low)
3. Aggressive Factor: Applies multipliers based on price action:
- Strong moves (body_ratio > 0.7): 1.5x multiplier
- Moderate moves (body_ratio > 0.4): 1.2x multiplier
- Weak moves: 1.0x multiplier
4. Delta Volume Estimation:
- Buy Volume: price_change > 0 ? volume × aggressive_factor : 0
- Sell Volume: price_change < 0 ? volume × aggressive_factor : 0
- Net Delta: buy_volume - sell_volume
5. Delta Strength Normalization: delta_strength = |net_delta| / sma(volume, 20)
Percentile-Based Filtering
The indicator uses percentile filtering instead of fixed thresholds, making it adaptive to market conditions:
- Bubble Filter: Only shows bubbles when volume exceeds the specified percentile (default: 60%)
- Label Filter: Only displays numbers when volume exceeds a higher percentile (default: 90%)
- Dynamic Adaptation: Automatically adjusts to changing market volatility
Visual Elements
Bubble Sizes
- Tiny: Delta strength < 0.3
- Small: Delta strength 0.3 - 0.7
- Normal: Delta strength 0.7 - 1.2
- Large: Delta strength 1.2 - 2.0
- Huge: Delta strength > 2.0
Color Coding
- Aggressive Buy (Bright Green): Strong buying pressure with high body ratio
- Aggressive Sell (Bright Red): Strong selling pressure with high body ratio
- Passive Buy (Light Green): Moderate buying pressure
- Passive Sell (Light Red): Moderate selling pressure
Intensity Mode
Alternative coloring based on delta strength rather than flow direction:
- Gray: Low intensity (< 0.5)
- Blue: Medium intensity (0.5 - 1.0)
- Orange: High intensity (1.0 - 2.0)
- Red: Extreme intensity (> 2.0)
Parameters
Order Flow Settings
- Show Bubbles: Toggle bubble display on/off
- Bubble Volume %ile: Percentile threshold for bubble display (0-100%)
- Intensity Mode: Switch between flow-based and intensity-based coloring
Bubble Labels
- Show Numbers in Bubbles: Toggle numerical labels on/off
- Label Volume %ile: Higher percentile threshold for label display (0-100%)
Numbers are displayed in K-notation (e.g., 25000 → 25K, 1500000 → 1.5M) for better readability.
Ideal Usage Scenarios
Best Market Conditions
- High volume sessions: More accurate delta calculations
- Trending markets: Clear directional flow identification
- Breakout scenarios: Spot aggressive buying/selling at key levels
- Support/resistance testing: Identify accumulation vs distribution
Trading Applications
1. Entry Timing: Look for aggressive flow in your trade direction
2. Exit Signals: Watch for opposing aggressive flow
3. Trend Confirmation: Consistent flow direction confirms trends
4. Volume Climax: Huge bubbles may indicate exhaustion points
Optimization Tips
Parameter Adjustment
- Lower percentiles (40-60%): More bubbles, good for active markets
- Higher percentiles (70-90%): Fewer bubbles, focus on significant events
- Label percentile: Set 20-30% higher than bubble percentile for clarity
Visual Optimization
- Intensity mode: Better for identifying unusual volume spikes
- Flow mode: Better for directional bias analysis
- Label toggle: Turn off in crowded markets, on for key levels
Limitations
- Estimation-based: Uses approximation algorithms, not true order flow data
- Volume dependency: Requires accurate volume data to function properly
- Timeframe sensitivity: Works best on intraday timeframes with active volume
- Market hours: Most effective during high-volume trading sessions
Technical Notes
The indicator implements advanced Pine Script features including:
- Dynamic percentile calculations using ta.percentile_linear_interpolation()
- Conditional plotting with multiple size categories
- Custom number formatting functions
- Efficient label management to prevent display limits
This tool is designed for traders who want to understand the underlying buying and selling pressure beyond simple volume analysis, providing insights into market sentiment and potential turning points.
Delta

DeltaStrike — Aggressive Candle Detector by Chaitu50cDeltaStrike — Aggressive Candle Detector
by Chaitu50c
DeltaStrike is a simple and effective tool designed to help traders identify the most aggressive candles on the chart in real time. It works purely on price action and internal candle dynamics, with no reliance on lagging indicators.
The indicator combines delta (directional strength), candle range, and volume to compute an overall aggressiveness score for each candle. When this score exceeds a dynamic threshold based on recent market behavior, the candle is marked as an aggressive move.
Aggressive bullish candles are plotted as green diamonds below the candle, while aggressive bearish candles are plotted as red diamonds above the candle. The goal is to help traders visually spot moments of strong directional pressure, where potential trends or reversals may emerge.
The detection logic adapts automatically to changing market volatility and volume, making it suitable for all instruments and timeframes, including index futures, equities, and forex.
An integrated dashboard on the chart displays live readings of the key components contributing to each candle’s aggressiveness score: delta ratio, range ratio, and volume ratio. This helps traders understand the internal structure of each aggressive move.
Features:
Dynamic aggressiveness detection based on delta, range, and volume
Adaptive threshold for consistent behavior across timeframes and instruments
Clean chart output with clear diamond markers only on selected candles
Live dashboard with internal metrics for advanced analysis
Simple, lightweight, and optimized for intraday and swing trading
Works with any instrument: index, equity, forex, commodity
DeltaStrike is intended as an objective visual aid to help traders focus on genuine moments of strong market intent, filtering out ordinary or passive price movement. It can be used standalone or in combination with your existing trading strategy.

Delta Volume Profile [BigBeluga]🔵Delta Volume Profile
A dynamic volume analysis tool that builds two separate horizontal profiles: one for bullish candles and one for bearish candles. This indicator helps traders identify the true balance of buying vs. selling volume across price levels, highlighting points of control (POCs), delta dominance, and hidden volume clusters with remarkable precision.
🔵 KEY FEATURES
Split Volume Profiles (Bull vs. Bear):
The indicator separates volume based on candle direction:
If close > open , the candle’s volume is added to the bullish profile (positive volume).
If close < open , it contributes to the bearish profile (negative volume).
ATR-Based Binning:
The price range over the selected lookback is split into bins using ATR(200) as the bin height.
Each bin accumulates both bull and bear volumes to form the dual-sided profile.
Bull and Bear Volume Bars:
Bullish volumes are shown as right-facing bars on the right side, colored with a bullish gradient.
Bearish volumes appear as left-facing bars on the left side, shaded with a bearish gradient.
Each bar includes a volume label (e.g., +12.45K or -9.33K) to show exact volume at that price level.
Points of Control (POC) Highlighting:
The bin with the highest bullish volume is marked with a border in POC+ color (default: blue).
The bin with the highest bearish volume is marked with a POC− color (default: orange).
Total Volume Density Map:
A neutral gray background box is plotted behind candles showing the total volume (bull + bear) per bin.
This reveals high-interest price zones regardless of direction.
Delta and Total Volume Summary:
A Delta label appears at the top, showing net % difference between bull and bear volume.
A Total label at the bottom shows total accumulated volume across all bins.
🔵 HOW IT WORKS
The indicator captures all candles within the lookback period .
It calculates the price range and splits it into bins using ATR for adaptive resolution.
For each candle:
If price intersects a bin and close > open , volume is added to the positive profile .
If close < open , volume is added to the negative profile .
The result is two side-by-side histograms at each price level—one for buyers, one for sellers.
The bin with the highest value on each side is visually emphasized using POC highlight colors.
At the end, the script calculates:
Delta: Total % difference between bull and bear volumes.
Total: Sum of all volumes in the lookback window.
🔵 USAGE
Volume Imbalance Zones: Identify price levels where buyers or sellers were clearly dominant.
Fade or Follow Volume Clusters: Use POC+ or POC− levels for reaction trades or breakouts.
Delta Strength Filtering: Strong delta values (> ±20%) suggest momentum or exhaustion setups.
Volume-Based Anchoring: Use profile levels to mark hidden support/resistance and execution zones.
🔵 CONCLUSION
Delta Volume Profile offers a unique advantage in market reading by separating buyer and seller activity into two visual layers. This allows traders to not only spot where volume was high, but also who was more aggressive. Whether you’re analyzing trend continuations, reversals, or absorption levels, this indicator gives you the transparency needed to trade with confidence.

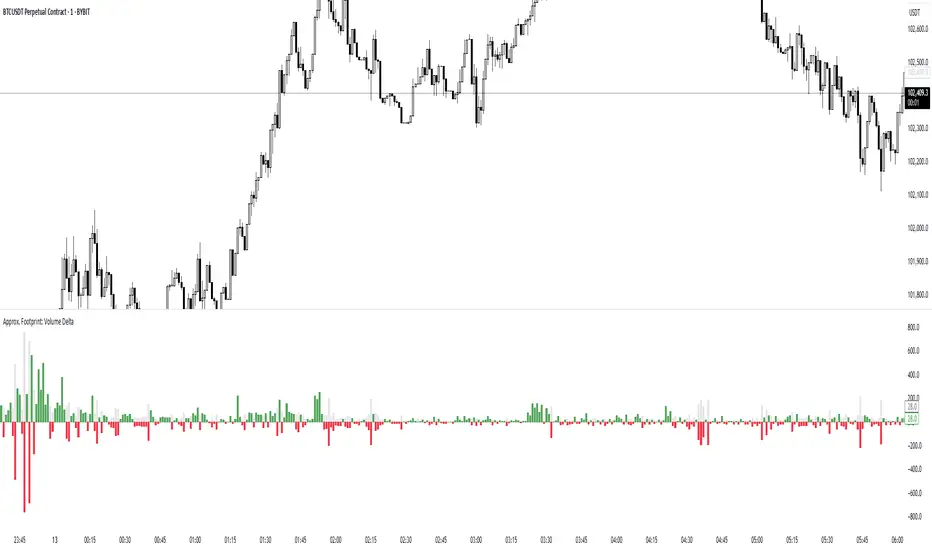
Approx. Footprint: Volume DeltaThis indicator brings you a simplified “footprint” view by charting the volume delta—the imbalance between bullish and bearish volume—alongside total bar volume.
Delta Bars: Green/red columns show where buyers (close > open) or sellers (close < open) dominated each bar.
Total Volume: Semi-transparent gray columns in the background give you overall context.
No Hidden Data: Works on any symbol/timeframe without tick-by-tick or bid/ask feeds.
Use it to quickly spot bars with strong buying or selling pressure, identify momentum shifts, and confirm breakouts or reversals—all within TradingView’s standard volume streams.
Zig Zag Trend Metrics“ Zig Zag Trend Metrics ” is a highly versatile indicator, built on the classic Zig Zag concept and thoughtfully designed for technical traders seeking a deeper, more structured view of market dynamics. This tool identifies significant swing highs and lows, classifies them, and annotates each with key metrics, offering a precise snapshot of each movement. It enhances visual analysis by drawing connecting lines that outline the flow of market structure, making trend progression and reversals instantly recognizable. Beyond visual mapping, it features a compact, real-time statistics table that calculates the average price and time deltas for both bullish and bearish swings, giving traders deep insights into trend momentum and rhythm. With extensive customization options, this indicator adapts seamlessly to vast trading styles or chart setups, empowering traders to spot patterns, evaluate trend strength, and make more confident, data-backed decisions.
❖ FEATURES
✦ Automatic Swing Detection
At its core, this indicator automatically identifies swing highs and lows based on a customizable lookback period (default: 10 bars).
✦ Labeling Swing Points
Each swing is visualized with a label that includes:
Swing Classification : “HH” (Higher High), “LH” (Lower High), “LL” (Lower Low), or “HL” (Higher Low).
Price Difference : Displayed in percentage or absolute value from the previous opposite swing.
Time Difference : The number of bars since the previous swing of the opposite type.
These labels offer traders clear, immediate insight into price movements and structural changes.
✦ Visual Lines
The indicator draws three types of lines:
Bullish Lines: Connect recent swing lows to new swing highs, indicating uptrends.
Bearish Lines: Connect recent swing highs to new swing lows, indicating downtrends.
Range Lines: Connect consecutive highs or lows to outline price channels.
Each line type can be color-coded and customized for visibility.
✦ Statistics Table
An on-screen metrics table provides a live summary of trends. Script uses Relative Averaging to smooth price and time changes. This prevents outliers from distorting the data and provides a more reliable sense of typical swing behavior.
Uptrend Metrics: Shows average price and time differences from recent bullish swings.
Downtrend Metrics: Shows the same for bearish swings.
🛠️ Customization Options
Ability to tailor the indicator to suit their strategy and aesthetic preferences:
Swing Period: Adjust sensitivity to short- or long-term swings.
Color Settings: Customize line and label colors.
Label Display: Choose between absolute or percentage price differences.
Table Settings: Modify size, location, or visibility.
This makes the indicator highly flexible and useful across various timeframes and assets.

Footprint IQ Pro [TradingIQ]Hello Traders!
Introducing "Footprint IQ Pro"!
Footprint IQ Pro is an all-in-one Footprint indicator with several unique features.
Features
Calculated delta at tick level
Calculated delta ratio at tick level
Calculated buy volume at tick level
Calculated sell volume at tick level
Imbalance detection
Stacked imbalance detection
Stacked imbalance alerts
Value area and POC detection
Highest +net delta levels detection
Lowest -net delta levels detection
CVD by tick levels
Customizable values area percentage
The image above thoroughly outlines what each metric in the delta boxes shows!
Metrics In Delta Boxes
"δ:", " δ%:", " ⧎: ", " ◭: ", " ⧩: "
δ Delta (Difference between buy and sell volume)
δ% Delta Ratio (Delta as a percentage of total volume)
⧎ Total Volume At Level (Total volume at the price area)
◭ Total Buy Volume At Level (Total buy volume at the price area)
⧩ Total Sell Volume At Level (total sell volume at the price area)
Each metric comes with a corresponding symbol.
That said, until you become comfortable with the symbol, you can also turn on the descriptive labels setting!
The image above exemplifies the feature.
The image above shows Footprint IQ's full power!
Additionally, traders with an upgraded TradingView plan can make use of the "1-Second" feature Footprint IQ offers!
The image above shows each footprint generated using 1-second volume data. 1-second data is highly granular compared to 1-minute data and, consequently, each footprint is exceptionally more accurate!
Imbalance Detection
Footprint IQ pro is capable of detecting user-defined delta imbalances.
The image above further explains how Footprint IQ detects imbalances!
The imbalance percentage is customizable in the settings, and is set to 70% by default.
Therefore,
When net delta is positive, and the positive net delta constitutes >=70% of the total volume, a buying imbalance will be detected (upwards triangle).
When net delta is negative, and the negative net delta constitutes >=70% of the total volume, a buying imbalance will be detected (downwards triangle).
Stacked Imbalance Detection
In addition to imbalance detection, Footprint IQ Pro can also detect stacked imbalances!
The image above shows Footprint IQ Pro detecting stacked imbalances!
Stacked imbalances occur when consecutive imbalances at sequential price areas occur. Stacked imbalances are generally interpreted as significant price moves that are supported by volume, rather than a significant result with disproportionate effort.
The criteria for stacked imbalance detection (how many imbalances must occur at sequential price areas) is customizable in the settings.
The default value is three. Therefore, when three imbalances occur at sequential price areas, golden triangles will begin to print to show a stacked imbalance.
Additionally, traders can set alerts for when stacked imbalances occur!
Highest +Delta and Highest -Delta Levels
In addition to being a fully-fledged Footprint indicator, Footprint IQ Pro goes one step further by detecting price areas where the greater +Delta and -Delta are!
The image above shows price behavior near highest +Delta price areas detected by Footprint IQ!
These +Delta levels are considered important as there has been strong interest from buyers at these price areas when they are traded at.
It's expected that these levels can function as support points that are supported by volume.
The image above shows a similar function for resistance points!
Blue lines = High +Delta Detected Price Areas
Red lines = High -Delta Detected Price Areas
Value Area Detection
Similar to traditional volume profile, Footprint IQ Pro displays the value area per bar.
Green lines next to each footprint show the value area for the bar. The value area % is customizable in the settings.
CVD Levels
Footprint IQ Pro is capable of storing historical volume delta information to provide CVD measurements at each price area!
The image above exemplifies this feature!
When this feature is enabled, you will see the CVD of each price area, rather than the net delta!
And that's it!
Thank you so much to TradingView for offering the greatest charting platform for everyone to create on!
If you have any feature requests you'd like to see for Footprint IQ, please feel free to share them with us!
Thank you!

Volume Zones Internal Visualizer [LuxAlgo]The Volume Zones Internal Visualizer is an alternate candle type intended to reveal lower timeframe volume activity while on a higher timeframe chart.
It displays the candle's range, the highest and lowest zones of accumulated volume throughout the candle, and the Lower Timeframe (LTF) candle close, which contained the most volume in the session (Candle Session).
🔶 USAGE
The indicator is intended to be used as its own independent candle type. It is not a replacement for traditional candlesticks; however, it is recommended that you hide the chart's display when using this indicator. Another option is to display this indicator in an additional pane alongside the normal chart, as displayed above.
The display consists of candle ranges represented by outlined boxes, within the ranges you will notice a transparent-colored zone, a solid-colored zone, and a line.
Each of these displays different points of volume-related information from an analysis of LTF data.
In addition to this analysis, the indicator also locates the LTF candle with the highest volume, and displays its close represented by the line. This line is considered as the "Peak Activity Level" (PAL), since throughout the (HTF) candle session, this candle's close is the outcome of the most volume transacted at the time.
We are further tracking these PALs by continuing to extend them into the future, looking towards them for potential further interaction. Once a PAL is crossed, we are removing it from display as it has been mitigated.
🔶 DETAILS
The indicator aggregates the volume data from each LTF candle and creates a volume profile from it; the number of rows in the profile is determined by the "Row Size" setting.
With this profile, it locates and displays the highest (solid area) and lowest (transparent area) volume zones from the profile created.
🔶 SETTINGS
Row Size: Sets the number of rows used for the calculation of the volume profile based on LTF data.
Intrabar Timeframe: Sets the Lower Timeframe to use for calculations.
Show Last Unmitigated PALs: Choose how many Unmitigated PALs to extend.
Style: Toggle on and off features, as well as adjust colors for each.

Enhanced Cumulative Volume Delta + MAThe Enhanced Cumulative Volume Delta (CVD) indicator is designed to help traders analyze the cumulative buying and selling pressure in the market by examining the delta between the up and down volume. By tracking this metric, traders can gain insights into the strength of a trend and potential reversals. This indicator uses advanced volume analysis combined with customizable moving averages to provide a more detailed view of market dynamics.
How to Use This Indicator:
Volume Delta Visualization:
The indicator plots the cumulative volume delta (CVD) using color-coded candles, where teal represents positive delta (buying pressure) and soft red represents negative delta (selling pressure).
Moving Averages:
Use the moving averages to smooth the CVD data and identify long-term trends. You can choose between SMA and EMA for each of the three available moving averages. The first and third moving averages are typically used for short-term and long-term trend analysis, respectively, while the second moving average can serve as a medium-term filter.
Arrow Markers:
The indicator will display arrows (green triangle up for crossing above, red triangle down for crossing below) when the CVD volume crosses the 3rd moving average. You can control the visibility of these arrows through the input parameters.
Volume Data:
The indicator provides error handling in case no volume data is available for the selected symbol, ensuring that you're not misled by incomplete data.
Practical Applications:
Trend Confirmation: Use the CVD and moving averages to confirm the overall trend direction and strength. Positive delta and a rising CVD can confirm an uptrend, while negative delta and a falling CVD indicate a downtrend.
Volume Breakouts: The arrows marking when the CVD crosses the 3rd moving average can help you spot potential volume breakouts or reversals, making them useful for entry or exit signals.
Volume Divergence: Pay attention to divergences between price and CVD, as these can often signal potential trend reversals or weakening momentum.

Thin Liquidity Zones [PhenLabs]Thin Liquidity Zones with Volume Delta
Our advanced volume analysis tool identifies and visualizes significant liquidity zones using real-time volume delta analysis. This indicator helps traders pinpoint and monitor critical price levels where substantial trading activity occurs, providing precise volume flow measurement through lower timeframe analysis.
The tool works by leveraging the fact that hedge funds, institutions, and other large market participants strategically fill their orders in areas of thin liquidity to minimize slippage and market impact. By detecting these zones, traders gain valuable insights into potential areas of accumulation, distribution, and liquidity traps, allowing for more informed trading decisions.
🔍 Key Features
Real-time volume delta calculation using lower timeframe data
Dynamic zone creation based on volume spikes
Automatic timeframe optimization
Size-filtered zones to avoid noise
Custom delta timeframe scanning
Flexible analysis period selection
📊 Visual Demonstration
💡 How It Works
The indicator continuously scans for high-volume areas where trading activity exceeds the specified threshold (default 6.0x average volume). When detected, it creates zones that display the net volume delta, showing whether buying or selling pressure dominated that price level.
Key zone characteristics:
Size filtering prevents noise from large price swings
Volume delta shows actual buying/selling pressure
Zones automatically expire based on lookback period
Real-time updates as new volume data arrives
⚙️ Settings
Time Settings
Analysis Timeframe: 15M to 1W options
Custom Period: User-defined bar count
Delta Timeframe: Automatic or manual selection
Volume Analysis
Volume Threshold: Minimum spike multiple
Volume MA Length: Averaging period
Maximum Zone Size: Size filter percentage
Display Options
Zone Color: Customizable with transparency
Delta Display: On/Off toggle
Text Position: Left/Center/Right alignment
📌 Tips for Best Results
Adjust volume threshold based on instrument volatility
Monitor zone clusters for potential support/resistance
Consider reducing max zone size in volatile markets
Use in conjunction with price action and other indicators
⚠️ Important Notes
Requires volume data from your data provider
Lower timeframe scanning may impact performance
Maximum 500 zones maintained for optimization
Zone creation is filtered by both volume and size
🔧 Volume Delta Calculation
The indicator uses TradingView’s advanced volume delta calculation, which:
Scans lower timeframe data for precision
Measures actual buying vs selling pressure
Updates in real-time with new data
Provides clear positive/negative flow indication
This tool is ideal for traders focusing on volume analysis and order flow. It helps identify key levels where significant trading activity has occurred and provides insight into the nature of that activity through volume delta analysis.
Note: Performance may vary based on your chart’s timeframe. Adjust settings according to your trading style and the instrument’s characteristics. Past performance is not indicative of future results, DYOR.

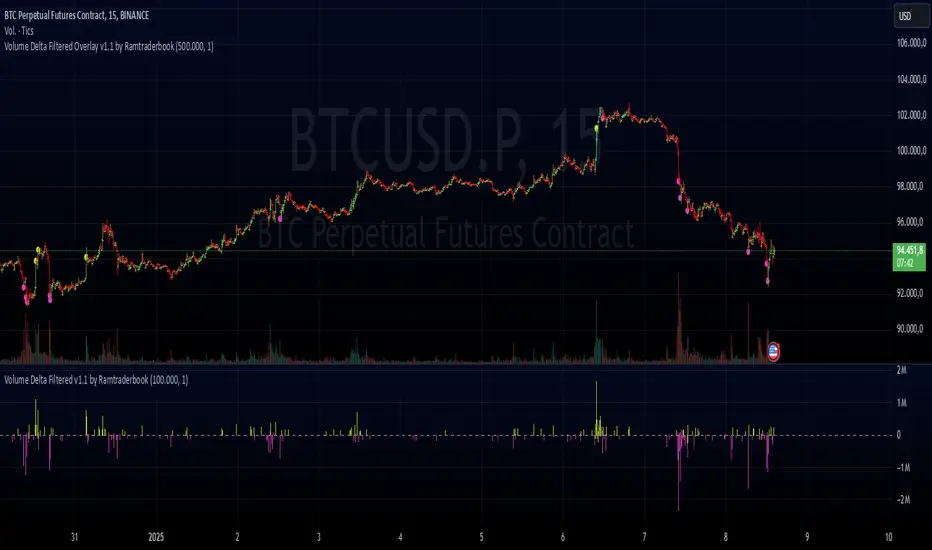
Volume Delta Filtered Overlay v1.1 by RamtraderbookVolume Delta Filtered Overlay v1.1 by Ramtraderbook
This indicator visually displays the volume delta directly on the price chart using colored circles. Its main goal is to highlight significant changes in the volume delta, categorizing them by direction and magnitude.
How It Works
1. Volume Delta Calculation
- Measures the difference between buying and selling volume on a lower time frame.
2. Threshold Filter
- Only displays data if the delta exceeds a minimum threshold set by the user.
3. Colors by Direction
- Bullish color: If the delta is positive (more buying).
- Bearish color: If the delta is negative (more selling).
4. Circle Placement
- Circles are placed above the candle for a positive delta and below the candle for a negative delta.
Customizable Inputs
- Delta Threshold: Defines the minimum delta value that will be plotted.
- Customizable Colors: Allows you to set different colors for positive and negative delta circles.
- **Lower Time Frame**: Scans data on a lower time frame for greater accuracy.
Important Note on Data
TradingView does not handle market depth data such as order book information. The volume delta calculation is an approximation based on the asset’s volume and price behavior. This means it does not precisely reflect the actual flow of buy or sell orders in the market, but rather an estimate derived from available data.
Conclusion
The **Volume Delta Filtered Overlay v1.1 by Ramtraderbook** is a visual tool that helps quickly identify significant buy or sell volume movements, making it ideal for strategies that rely on order flow analysis. However, it is recommended to combine it with other tools for a more comprehensive analysis.

Volume Delta Filtered v1.1 by RamtraderbookIndicator Explanation: Volume Delta_RTB (Filtered)
General Description
The Volume Delta_RTB (Filtered) indicator is designed to analyze the volume delta of a financial asset and highlight only significant changes based on a configured threshold. This indicator is useful for detecting moments when buying volume exceeds selling volume (or vice versa), providing a clear view of market pressure.
What is Volume Delta?
Volume delta measures the difference between buying and selling volume over a given time period. A positive delta indicates that buying prevails over selling, while a negative delta indicates the opposite.
Indicator Inputs
The indicator has several customizable parameters to suit the user’s needs:
1. Volume Delta Threshold
- Allows you to set a minimum volume delta value.
- Only indicator values that exceed this absolute delta threshold will be displayed.
- Default value: 100,000.
2. Use of a Lower Time Frame
- Option to analyze data from a lower time frame than the main chart.
Operating Logic
1. Selection of the Lower Time Frame
- The indicator scans data from a lower time frame to accurately calculate the volume delta.
- By default, it automatically selects an appropriate lower time frame, though it can be set manually.
2. Calculation of Volume Delta
- Using the `ta.requestVolumeDelta` function, the indicator calculates:
- Volume delta at the start of the period (`openVolume`).
- Maximum delta (`maxVolume`).
- Minimum delta (`minVolume`).
- Last recorded delta (`lastVolume`).
3. Filtering Values
- If the absolute value of `lastVolume` (the last volume delta) is below the configured threshold (`deltaThreshold`), the data will not be displayed on the chart.
- This allows the indicator to highlight only significant movements, avoiding unnecessary noise.
4. Visualization
- Volume delta is represented by candles to facilitate interpretation:
- Yellow candles for positive delta (buying prevails).
- Pink candles for negative delta (selling prevails).
- A horizontal line at `0` serves as a reference.
- Colors can be configured as needed.
5. Data Validation
- If the data provider does not provide volume information for the asset, the indicator will display an error message.
Indicator Advantages
- Efficient Filtering: Focus on the most relevant movements in terms of volume, ignoring small or insignificant values.
- Adaptable: Offers customization options for both the delta threshold and the time frame.
- Clear Visualization: Colored candles make it easier to spot dominant buying or selling trends.
NOTE:
- Estimated Delta Data: Since TradingView does not have access to market depth data or an exact breakdown of buying and selling volume, the delta calculations are approximations based on price and volume behavior.
- Data Provider Dependency: Some assets or instruments may not have volume information available, limiting the indicator’s use.
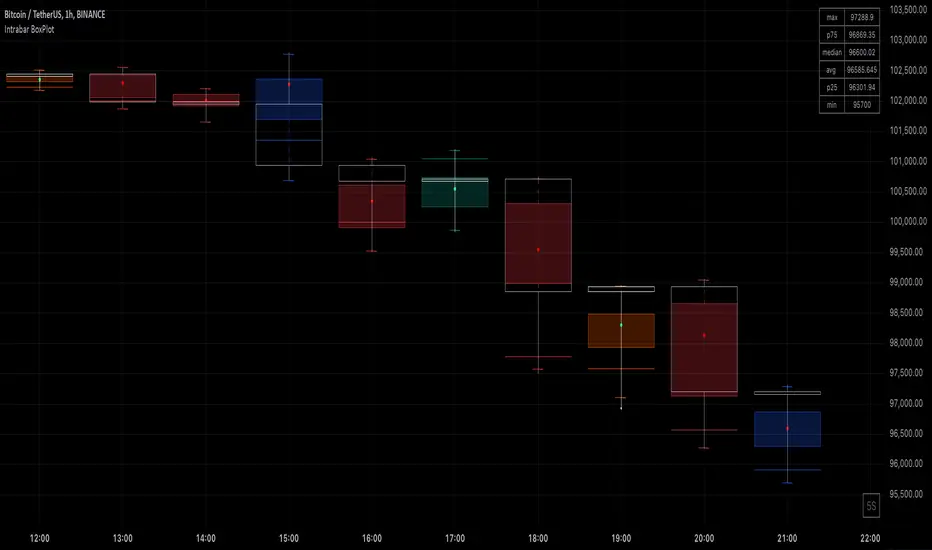
Intrabar BoxPlotThe Intrabar BoxPlot publication highlights an uncommon technique by displaying statistical intrabar Lower Timeframe (LTF) values on the chart.
🔶 USAGE
🔹 Middle 50% Boxes
By showing the middle 50% intrabar values through a box, we can more easily see where the intrabar activity is mainly situated.
The middle 50% intrabar values are referred to from here on as Interquartile range (IQR).
In this example, the successive IQRs form a channel where the price eventually breaks out.
Disproportionately distributed values can give insights which can be used to find potential support/resistance areas.
IQR gaps can give valuable information as well. Potentially, the price can return to these gaps.
Seeing the IQR areas against regular candles gives an alternative image of the underlying price movements.
🔹 Highest volume Price level
The script displays the price level with the highest volume situated, dependable on the user's source setting. Setting the source at 'close' will only display intrabar close values; the same goes for high, low, ...
As seen in the above example, the volume levels can aid in finding support/resistance.
🔹 Median
The location of the median off all intrabar values is displayed as a coloured dot: green when the close price is higher than the opening price and red if otherwise. The median can give valuable insights into price movements.
🔹 Outliers
Medium (white dots) and extreme (white X) outliers, in combination with the IQR box, can help identify potential areas of interest.
🔹 Volume Delta
When there is a discrepancy between the delta volume and direction of the candle, this will be displayed as follows:
Green candle: when the sum of the volume of red intrabars is higher than the sum of the volume of green intrabars, the candle will be coloured orange.
Red candle: when the sum of the volume of green intrabars is higher than the sum of the volume of red intrabars, the candle will be coloured blue.
🔹 Highlight Boxplot only
Probably the easiest way to display boxplot only is by changing the Bar's style to Bars .
🔶 DETAILS
All intrabar values (Lower TimeFrame - LTF) are sorted and evaluated. Values can be close , high , low , ... by selecting this in Settings ( source ).
The middle 50% of all values are displayed as a box; this contains the values between percentile 25 (p25) and percentile 75 (p75). The value of percentile rank 75 means 75% of all values are lower. The value of percentile rank 25 means 25% of all values are lower, or 75% is higher.
The difference between p75 and p25 is also known as Interquartile range (IQR)
IQR is used to check for outliers.
Wiki: Boxplot , Interquartile range
Extreme high: maximum value, higher than p75 + IQR*3
Max outlier high: maximum value, higher than p75 + IQR*1.5 but lower than p75 + IQR*3
Max: maximum value, lower than p75 + IQR*1.5
Min: minimum value, higher than p25 - IQR*1.5
Min outlier low: minimum value, lower than p25 - IQR*1.5 but higher than p25 - IQR*3
Extreme low: minimum value, lower than p25 - IQR*3
Max and min must not be interpreted with the current candle high/low.
🔹 Example: Length of chart-puppets
The following example can make it easier to digest. Forty "chart-puppets" are sorted by their length.
The p25 value is 97
The p50 value is 120
The p75 value is 149
75% of all "chart-puppets" are smaller than p75, and 25% is larger than p75.
50% of all "chart-puppets" are smaller than p50, and 50% is larger than p50 (= median).
25% of all "chart-puppets" are smaller than p25, and 75% is larger than p25.
IQR = 149 - 97 = 52
Extreme outlier limit max: p75 + IQR*3 = 149 + 52*3 = 305
Mild outlier limit max: p75 + IQR*1.5 = 149 + 52*1.5 = 227
Mild outlier limit min: p25 - IQR*1.5 = 97 - 52*1.5 = 19
Extreme outlier limit min: p25 - IQR*3 = 97 - 52*3 = -59
In this example there are no outliers to be found, all values are located between p25 - IQR*1.5 (19) and p75 + IQR*1.5. (227)
🔹 Source settings
Note that results are dependable on the chosen source (settings). When, for example, close is chosen as the source, only intrabar close prices are included. This means a low or high can stretch further then the min or max.
Here we can see different results with different source settings
🔹 LTF settings
When 'Auto' is enabled (Settings, LTF), the LTF will be the nearest possible x times smaller TF than the current TF. When 'Premium' is disabled, the minimum TF will always be 1 minute to ensure TradingView plans lower than Premium don't get an error.
Examples with current Daily TF (when Premium is enabled):
500 : 3 minute LTF
1500 (default): 1 minute LTF
5000: 30 seconds LTF (1 minute if Premium is disabled)
🔶 SETTINGS
Source: Set source at close, high, low,...
🔹 LTF
LTF: LTF setting
Auto + multiple: Adjusts the initial set LTF
Premium: Enable when your TradingView plan is Premium or higher
🔹 Intrabar Delta : Colors, dependable on different circumstances.
Up: Price goes up, with more bullish than bearish intrabar volume.
Up-: Price goes up, with more bearish than bullish intrabar volume.
Down: Price goes down, with more bearish than bullish intrabar volume.
Down+: Price goes down, with more bullish than bearish intrabar volume.
🔹 Table
Show table: Show details at the top right corner
Show TF: Show LTF at the bottom right corner
Text color/table size
See DETAILS for more information
Volume Delta Candles HTF [TradingFinder] LTF Volume Candles 🔵 Introduction
In financial markets, understanding the concepts of supply and demand and their impact on price movements is of paramount importance. Supply and demand, as fundamental pillars of economics, reflect the interaction between buyers and sellers.
When buyers' strength surpasses that of sellers, demand increases, and prices tend to rise. Conversely, when sellers dominate buyers, supply overtakes demand, causing prices to drop. These interactions play a crucial role in determining market trends, price reversal points, and trading decisions.
Volume Delta Candles offer traders a practical way to visualize trading activity within each candlestick. By integrating data from lower timeframes or live market feeds, these candles eliminate the need for standalone volume indicators.
They present the proportions of buying and selling volume as intuitive colored bars, making it easier to interpret market dynamics at a glance. Additionally, they encapsulate critical metrics like peak delta, lowest delta, and net delta, allowing traders to grasp the market's internal order flow with greater precision.
In financial markets, grasping the interplay between supply and demand and its influence on price movements is crucial for successful trading. These fundamental economic forces reflect the ongoing balance between buyers and sellers in the market.
When buyers exert greater strength than sellers, demand dominates, driving prices upward. Conversely, when sellers take control, supply surpasses demand, and prices decline. Understanding these dynamics is essential for identifying market trends, pinpointing reversal points, and making informed trading decisions.
Volume Delta Candles provide an innovative method for evaluating trading activity within individual candlesticks, offering a simplified view without relying on separate volume indicators. By leveraging lower timeframe or real-time data, this tool visualizes the distribution of buying and selling volumes within a candle through color-coded bars.
This visual representation enables traders to quickly assess market sentiment and understand the forces driving price action. Buyer and seller strength is a critical concept that focuses on the ratio of buying to selling volumes. This ratio not only provides insights into the market's current state but also serves as a leading indicator for detecting potential shifts in trends.
Traders often rely on volume analysis to identify significant supply and demand zones, guiding their entry and exit strategies. Delta Candles translate these complex metrics, such as Maximum Delta, Minimum Delta, and Final Delta, into an easy-to-read visual format using Japanese candlestick structures, making them an invaluable resource for analyzing order flows and market momentum.
By merging the principles of supply and demand with comprehensive volume analysis, tools like the indicator introduced here offer unparalleled clarity into market behavior. This indicator calculates the relative strength of supply and demand for each candlestick by analyzing the ratio of buyers to sellers.
🔵 How to Use
The presented indicator is a powerful tool for analyzing supply and demand strength in financial markets. It helps traders identify the strengths and weaknesses of buyers and sellers and utilize this information for better decision-making.
🟣 Analyzing the Highest Volume Trades on Candles
A unique feature of this indicator is the visualization of price levels with the highest trade volume for each candlestick. These levels are marked as black lines on the candles, indicating prices where most trades occurred. This information is invaluable for identifying key supply and demand zones, which often act as support or resistance levels.
🟣 Trend Confirmation
The indicator enables traders to confirm bullish or bearish trends by observing changes in buyer and seller strength. When buyer strength increases and demand surpasses supply, the likelihood of a bullish trend continuation grows. Conversely, decreasing buyer strength and increasing seller strength may signal a potential bearish trend reversal.
🟣 Adjusting Timeframes and Calculation Methods
Users can customize the indicator's candlestick timeframe to align with their trading strategy. Additionally, they can switch between moving average and current candle modes to achieve more precise market analysis.
This indicator, with its accurate and visual data display, is a practical and reliable tool for market analysts and traders. Using it can help traders make better decisions and identify optimal entry and exit points.
🔵 Settings
Lower Time Frame Volume : This setting determines which timeframe the indicator should use to identify the price levels with the highest trade volume. These levels, displayed as black lines on the candlesticks, indicate prices where the most trades occurred.
It is recommended that users align this timeframe with their primary chart’s timeframe.
As a general rule :
If the main chart’s timeframe is low (e.g., 1-minute or 5-minute), it is better to keep this setting at a similarly low timeframe.
As the main chart’s timeframe increases (e.g., daily or weekly), it is advisable to set this parameter to a higher timeframe for more aligned data analysis.
Cumulative Mode :
Current Candle : Strength is calculated only for the current candlestick.
EMA (Exponential Moving Average) : The strength is calculated using an exponential moving average, suitable for identifying longer-term trends.
Calculation Period : The default period for the exponential moving average (EMA) is set to 21. Users can modify this value for more precise analysis based on their specific requirements.
Ultra Data : This option enables users to view more detailed data from various market sources, such as Forex, Crypto, or Stocks. When activated, the indicator aggregates and displays volume data from multiple sources.
🟣 Table Settings
Show Info Table : This option determines whether the information table is displayed on the chart. When enabled, the table appears in a corner of the chart and provides details about the strength of buyers and sellers.
Table Size : Users can adjust the size of the text within the table to improve readability.
Table Position : This setting defines the table’s placement on the chart.
🔵 Conclusion
The indicator introduced in this article is designed as an advanced tool for analyzing supply and demand dynamics in financial markets. By leveraging buyer and seller strength ratios and visually highlighting price levels with the highest trade volume, it aids traders in identifying key market zones.
Key features, such as adjustable analysis timeframes, customizable calculation methods, and precise volume data display, allow users to tailor their analyses to market conditions.
This indicator is invaluable for analyzing support and resistance levels derived from trade volumes, enabling traders to make more accurate decisions about entering or exiting trades.
By utilizing real market data and displaying the highest trade volume lines directly on the chart, it provides a precise perspective on market behavior. These features make it suitable for both novice and professional traders aiming to enhance their analysis and trading strategies.
With this indicator, traders can gain a better understanding of supply and demand dynamics and operate more intelligently in financial markets. By combining volume data with visual analysis, this tool provides a solid foundation for effective decision-making and improved trading performance. Choosing this indicator is a significant step toward refining analysis and achieving success in complex financial markets.

Delta Candle ColorsThe Delta Divergences indicator provides a visual representation of volume delta, which measures the difference between buying pressure and selling pressure within a candle. This is achieved by using intrabar (lower timeframe) volume and price fluctuations to estimate the delta between buying and selling pressure within each bar.
By color-coding candles based on this volume delta, traders can gain insight into the strength behind price movements and spot potential divergences. When a candle closes positively (higher than the previous close) but the volume delta is negative (more selling than buying), or when a candle closes negatively with a positive delta (more buying than selling), it indicates a divergence. These divergences can signal potential trend exhaustion or possible reversals.
The indicator includes custom alerts that notify the trader when these divergences occur:
Positive close with negative delta: Signals that the price is rising, but selling pressure is higher.
Negative close with positive delta: Signals that the price is falling, but buying pressure is higher.
In addition to color-coding candles based on delta, the indicator provides an option to display delta labels directly on the chart for each candle.
Finally, the option to only show divergences can be turned on. When enabled, non-divergent candles are colored normally, while only candles with delta divergences are highlighted, allowing traders to focus on the most relevant market information.

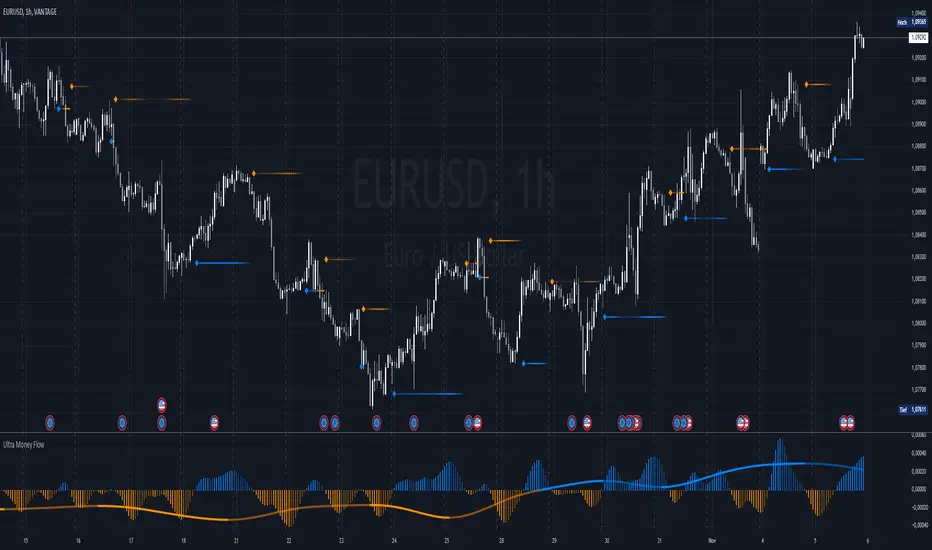
Ultra Money FlowIntroduction
The Ultra Money Flow script is a technical indicator for analyzing stock trends. It highlights buying and selling power, helping you identify bullish (rising) or bearish (falling) market trends.
Detailed Description
The Ultra Money Flow script calculates and visually displays two main components: Fast and Slow money flow. These components represent short-term and long-term trends, respectively.
Here's how it works:
.........
Inputs
You can adjust the speed of analysis (Fast Length and Slow Length) and the type of smoothing applied (e.g., Simple Moving Average, Exponential Moving Average).
Choose colors for visualizing the trends, with blue for bullish (positive) and orange for bearish (negative) movements.
.....
Money Flow Calculation
The script analyzes price changes (delta) over specified periods.
It separates upward price movements (buying power) from downward ones (selling power).
It then calculates the difference between these powers for both Fast and Slow components.
The types of smoothing methods range from traditional ones like the Simple Moving Average (SMA) to advanced ones like the Double Expotential Moving Average (DEMA) or the Triple Exponential Moving Average (TEMA) or the Recursive Moving Average (RMA) or the Weigthend Moving Average (WMA) or the Volume Weigthend Moving Average (VWMA) or Hull Moving Average (HMA).
Very Special ones are the Triple Weigthend Moving Average (TWMA) wich created RedKTrader .
I created the Multi Weigthend Moving Average (MWMA) wich is a simple signal line to the TWMA.
.....
Divergence
This indicator can show divergence by comparing the direction of price movements with the indicator value.
If the price and the indicator move in opposite directions, you can use these signals to help decide when to buy or sell.
.....
Auto Scaling
The script adjusts its calculations based on the time frame you are viewing, whether it's minutes, hours, or days, ensuring accurate representation across different time scales.
.....
Plotting
The script plots the Fast component as a histogram and the Slow component as a line, using the chosen colors to indicate bullish or bearish trends.
The thickness and transparency of these plots give additional clues about the strength of the trend.
.........
By using this indicator, traders can easily spot shifts in buying and selling power, allowing for better-informed decisions in the market.
Special Thanks
I use the TWMA-Function created from RedKTrader to smooth the values.
Special thanks to him for creating and sharing this function!
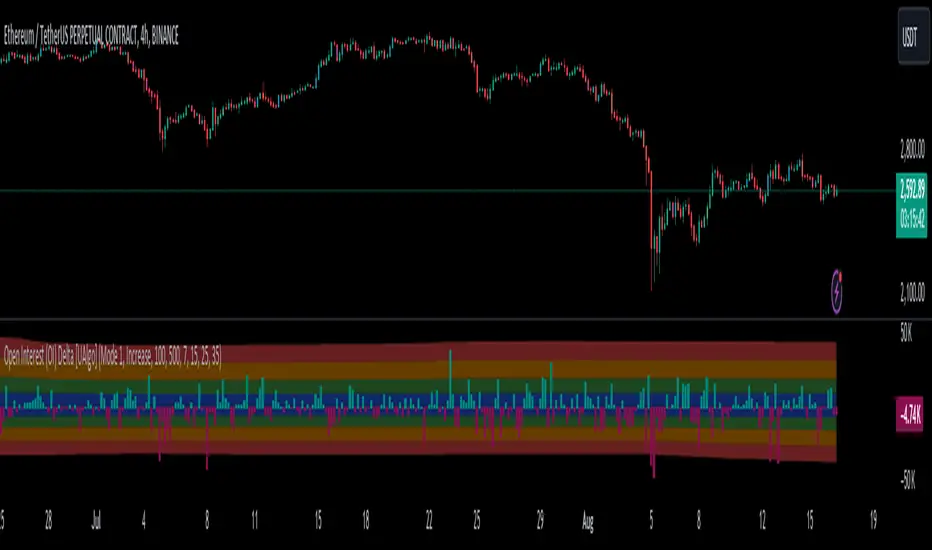
Open Interest (OI) Delta [UAlgo]The Open Interest (OI) Delta indicator is a tool designed to provide insights into the dynamics of Open Interest changes within the futures market. Open Interest (OI) refers to the total number of outstanding derivative contracts, such as options or futures, that have not been settled. The OI Delta measures the change in Open Interest over a specified period, allowing traders to assess whether new money is entering the market or existing positions are being closed.
This indicator offers two distinct display modes to visualize OI Delta, along with customizable levels that help in categorizing the magnitude of OI changes. Additionally, it provides the option to color-code the bars on the price chart based on the intensity and direction of OI Delta, making it easier for traders to interpret market sentiment and potential future price movements.
🔶 Key Features
Two Display Modes: Choose between two different modes for visualizing OI Delta, depending on your analysis preferences:
Mode 1: Displays the OI Delta directly as positive or negative values.
Mode 2: Separates positive and negative OI Delta values, displaying them as absolute values for easier comparison.
Customizable Levels: Set up to four levels of OI Delta magnitude, each with customizable thresholds and colors. These levels help categorize the OI changes into Normal, Medium, Large, and Extreme ranges, allowing for a more nuanced interpretation of market activity.
MA Length and Standard Deviation Period: Adjust the moving average length and standard deviation period for OI Delta, which smooths out the data and helps in identifying significant deviations from the norm.
Color-Coded Bar Chart: Optionally color the price bars on your chart based on the OI Delta levels, helping to visually correlate price action with changes in Open Interest.
Heatmap Display: Toggle the display of OI Delta levels on the chart, with the option to fill the areas between these levels for a more visually intuitive understanding of the data.
🔶 Interpreting Indicator
Positive vs. Negative OI Delta:
A positive OI Delta indicates that the Open Interest is increasing, suggesting that new contracts are being created, which could imply fresh capital entering the market.
A negative OI Delta suggests that Open Interest is decreasing, indicating that contracts are being closed out or settled, which might reflect profit-taking or a reduction in market interest.
Magnitude Levels:
Level 1 (Normal OI Δ): Represents typical, less significant changes in OI. If the OI Delta stays within this range, it may indicate routine market activity without any substantial shift in sentiment.
Level 2 (Medium OI Δ): Reflects a more significant change in OI, suggesting increased market interest and possibly the beginning of a new trend or phase of market participation.
Level 3 (Large OI Δ): Indicates a strong change in OI, often associated with a decisive move in the market. This could signify strong conviction among market participants, either bullish or bearish.
Level 4 (Extreme OI Δ): The highest level of OI change, often preceding major market moves. Extreme OI Δ can be a signal of potential market reversals or the final phase of a strong trend.
Color-Coded Bars:
When enabled, the color of the price bars will reflect the magnitude and direction of the OI Delta. This visual aid helps in quickly assessing the correlation between price movements and changes in market sentiment as indicated by OI.
This indicator is particularly useful for futures traders looking to gauge the strength and direction of market sentiment by analyzing changes in Open Interest. By combining this with price action, traders can gain a deeper understanding of market dynamics and make more informed trading decisions
🔶 Disclaimer
Use with Caution: This indicator is provided for educational and informational purposes only and should not be considered as financial advice. Users should exercise caution and perform their own analysis before making trading decisions based on the indicator's signals.
Not Financial Advice: The information provided by this indicator does not constitute financial advice, and the creator (UAlgo) shall not be held responsible for any trading losses incurred as a result of using this indicator.
Backtesting Recommended: Traders are encouraged to backtest the indicator thoroughly on historical data before using it in live trading to assess its performance and suitability for their trading strategies.
Risk Management: Trading involves inherent risks, and users should implement proper risk management strategies, including but not limited to stop-loss orders and position sizing, to mitigate potential losses.
No Guarantees: The accuracy and reliability of the indicator's signals cannot be guaranteed, as they are based on historical price data and past performance may not be indicative of future results.
Volume Positive & Negative Levels [ChartPrime]Volume Positive & Negative Levels
Overview:
The Volume Positive & Negative Levels indicator by ChartPrime is designed to provide traders with a clear visualization of volume activity across different price levels. By plotting volume levels as histograms, this tool helps identify significant areas of buying (positive volume) and selling (negative volume) pressure, enhancing the ability to spot potential support and resistance zones.
Key Features:
⯁ Lookback Period:
- The `lookbackPeriod` parameter, set to 500 bars, determines the range over which the volume analysis is conducted, ensuring a comprehensive view of the market’s volume activity. The maximum lookback period is 500 bars or the bars currently visible on the chart, whichever is smaller.
⯁ Dynamic Volume Calculation:
- Volume is calculated dynamically based on the price action, with positive volume indicating buying pressure (close > open) and negative volume indicating selling pressure (close < open).
⯁ Color Coding for Clarity:
- Positive Volume: Represented with a distinct color (`#ad9a2c`), making it easy to identify areas of buying interest.
- Negative Volume: Highlighted with another color (`#ad2cad`), simplifying the detection of selling pressure.
Volume Threshold and Bins:
- The indicator allows users to set a volume threshold (`volume_level`) to highlight significant volume levels, with the default set at 70.
- The number of bins (`numBins`) defines the granularity of the volume profile, with a higher number providing more detail.
⯁ Volume Profile Visualization:
- The volume profile is plotted as a histogram, with the height of each bar proportional to the volume at that price level. This visualization helps in quickly assessing the strength of volume at various price points.
⯁ Interactive Labels and Threshold Indicators:
- Labels: The indicator uses labels to mark significant volume levels, providing quick reference points for traders.
- Threshold Lines: Lines are drawn at specified volume thresholds, with colors and widths dynamically adjusted based on the volume levels.
⯁ User Inputs:
- Volume Threshold (`volume_level`): Sets the minimum volume required to highlight significant levels.
- Number of Bins (`numBins`): Determines the resolution of the volume profile.
- Line Width (`line_withd`): Specifies the width of the lines used in the visualization.
The Volume Positive & Negative Levels indicator is a powerful tool for traders looking to gain deeper insights into market dynamics. By providing a clear visual representation of volume activity across different price levels, it helps traders identify key support and resistance zones, spot trends, and make more informed trading decisions. Whether you are a day trader or a swing trader, this indicator enhances your ability to analyze volume data effectively, improving your overall trading strategy.

Depth of Market (DOM) [LuxAlgo]The Depth Of Market (DOM) tool allows traders to look under the hood of any market, taking price and volume analysis to the next level. The following features are included: DOM, Time & Sales, Volume Profile, Depth of Market, Imbalances, Buying Pressure, and up to 24 key intraday levels (it really packs a punch).
As a disclaimer, this tool does not use tick data, it is a DOM reconstruction from the provided real-time time series data (price and volume). So the volume you see is from filled orders only, this tool does not show unfilled limit orders.
Traders can enable or disable any of the features at will to avoid being overwhelmed with too much information and to make the tool perform faster.
The features that have the biggest impact on performance are Historical Data Collection, Key Levels (POC & VWAP), Time & Sales, Profile, and Imbalances. Disable these features to improve the indicator computational performance.
🔶 DOM
This is the simplest form of the tool, a simple DOM or ladder that displays the following columns:
PRICE: Price level
BID: Total number of market sell orders filled or limit buy orders filled.
SELL: Sell market orders
BUY: Buy market orders
ASK: Total number of market buy orders filled or limit sell orders filled.
The DOM only collects historical data from the last 24 hours and real-time data.
Traders can select a reset period for the DOM with two options:
DAILY: Resets at the beginning of each trading day
SESSIONS: Resets twice, as DAILY and 15.5 hours later, to coincide with the start of the RTH session for US tickers.
The DOM has two main modes, it can display price levels as ticks or points. The default is automatic based on the current daily volatility, but traders can manually force one mode or the other if they wish.
For convenience, traders have the option to set the number of lines (price levels), and the size of the text and to display only real-time data.
By default, the top price is set to 0 so that the DOM automatically adjusts the price levels to be displayed, but traders can set the top price manually so that the tool displays only the desired price levels in a fixed manner.
🔹 Volume Profile
As additional features to the basic DOM, traders have access to the volume profile histogram and the total volume per price level.
This helps traders identify at a glance key price areas where volume is accumulating (high volume nodes) or areas where volume is lacking (low volume nodes) - these areas are important to some traders who base their decision-making process on them.
🔹 Imbalances
Other added features are imbalances and buying pressure:
Interlevel Imbalance: volume delta between two different price levels
Intralevel Imbalance: delta between buy and sell volume at the same price level
Buying Pressure Percent: percentage of buy volume compared to total volume
Imbalances can help traders identify areas of interest in the price for possible support or resistance.
🔹 Depth
Depth allows traders to see at a glance how much supply is above the current price level or how much demand is below the current price level.
Above the current price level shows the cumulative ask volume (filled sell limit orders) and below the current price level shows the cumulative bid volume (filled buy limit orders).
🔶 KEY LEVELS
The tool includes up to 24 different key intraday levels of particular relevance:
Previous Week Levels
PWH: Previous week high
PWL: Previous week low
PWM: Previous week middle
PWS: Previous week settlement (close)
Previous Day Levels
PDH: Previous day high
PDL: Previous day low
PDM: Previous day middle
PDS: Previous day settlement (close)
Current Day Levels
OPEN: Open of day (or session)
HOD: High of day (or session)
LOD: Low of day (or session)
MOD: Middle of day (or session)
Opening Range
ORH: Open range high
ORL: Open range low
Initial Balance
IBH: Initial balance high
IBL: Initial balance low
VWAP
+3SD: Volume weighted average price plus 3 standard deviations
+2SD: Volume weighted average price plus 2 standard deviations
+1SD: Volume weighted average price plus 1 standard deviation
VWAP: Volume weighted average price
-1SD: Volume weighted average price minus 1 standard deviation
-2SD: Volume weighted average price minus 2 standard deviations
-3SD: Volume weighted average price minus 3 standard deviations
POC: Point of control
Different traders look at different levels, the key levels shown here are objective and specific areas of interest that traders can act on, providing us with potential areas of support or resistance in the price.
🔶 TIME & SALES
The tool also features a full-time and sales panel with time, price, and size columns, a size filter, and the ability to set the timezone to display time in the trader's local time.
The information shown here is what feeds the DOM and it can be useful in several ways, for example in detecting absorption. If a large number of orders are coming into the market but the price is barely moving, this indicates that there is enough liquidity at these levels to absorb all these orders, so if these orders stop coming into the market, the price may turn around.
🔶 SETTINGS
Period: Select the anchoring period to start data collection, DAILY will anchor at the start of the trading day, and SESSIONS will start as DAILY and 15.5 hours later (RTH for US tickers).
Mode: Select between AUTO and MANUAL modes for displaying TICKS or POINTS, in AUTO mode the tool will automatically select TICKS for tickers with a daily average volatility below 5000 ticks and POINTS for the rest of the tickers.
Rows: Select the number of price levels to display
Text Size: Select the text size
🔹 DOM
DOM: Enable/Disable DOM display
Realtime only: Enable/Disable real-time data only, historical data will be collected if disabled
Top Price: Specify the price to be displayed on the top row, set to 0 to enable dynamic DOM
Max updates: Specify how many times the values on the SELL and BUY columns are accumulated until reset.
Profile/Depth size: Maximum size of the histograms on the PROFILE and DEPTH columns.
Profile: Enable/Disable Profile column. High impact on performance.
Volume: Enable/Disable Volume column. Total volume traded at price level.
Interlevel Imbalance: Enable/Disable Interlevel Imbalance column. Total volume delta between the current price level and the price level above. High impact on performance.
Depth: Enable/Disable Depth, showing the cumulative supply above the current price and the cumulative demand below. Impact on performance.
Intralevel Imbalance: Enable/Disable Intralevel Imbalance column. Delta between total buy volume and total sell volume. High impact on performance.
Buying Pressure Percent: Enable/Disable Buy Percent column. Percentage of total buy volume compared to total volume.
Imbalance Threshold %: Threshold for highlighting imbalances. Set to 90 to highlight the top 10% of interlevel imbalances and the top and bottom 10% of intra-level imbalances.
Crypto volume precision: Specify the number of decimals to display on the volume of crypto assets
🔹 Key Levels
Key Levels: Enable/Disable KEY column. Very high performance impact.
Previous Week: Enable/Disable High, Low, Middle, and Close of the previous trading week.
Previous Day: Enable/Disable High, Low, Middle, and Settlement of the previous trading day.
Current Day/Session: Enable/Disable Open, High, Low and Middle of the current period.
Open Range: Enable/Disable High and Low of the first candle of the period.
Initial Balance: Enable/Disable High and Low of the first hour of the period.
VWAP: Enable/Disable Volume-weighted average price of the period with 1, 2, and 3 standard deviations.
POC: Enable/Disable Point of Control (price level with the highest volume traded) of the period.
🔹 Time & Sales
Time & Sales: Enable/Disable time and sales panel.
Timezone offset (hours): Enter your time zone\'s offset (+ or −), including a decimal fraction if needed.
Order Size: Set order size filter. Orders smaller than the value are not displayed.
🔶 THANKS
Hi, I'm makit0 coder of this tool and proud member of the LuxAlgo Opensource team, it's an honor to be part of the LuxAlgo family doing something I love as it's writing opensource code and sharing it with the world. I'd like to thank all of you who use, comment on, and vote for all of our open-source tools, and all of you who give us your support.
And of course thanks to the PineCoders family for all the work in front of and behind the scenes that makes the PineScript community what it is, simply the best.
Peace, Love & PineScript!

Net Buying/Selling Flows Toolkit [AlgoAlpha]🌟📊 Introducing the Net Buying/Selling Flows Toolkit by AlgoAlpha 📈🚀
🔍 Explore the intricate dynamics of market movements with the Net Buying/Selling Flows Toolkit designed for precision and effectiveness in visualizing money inflows and outflows and their impact on asset prices.
🔀 Multiple Display Modes : Choose from "Flow Comparison", "Net Flow", or "Sum of Flows" to view the data in the most relevant way for your analysis.
📏 Adjustable Unit Display : Easily manage the magnitude of the values displayed with options like "1 Billion", "1 Million", "1 Thousand", or "None".
🔧 Lookback Period Customization : Tailor the sum calculation window with a configurable lookback period, applicable in "Sum of Flows" mode.
📊 Deviation Thresholds : Set up lower and upper deviation thresholds to identify significant changes in flow data.
🔄 Reversal Signals and Deviation Bands : Enable signals for potential reversals and visualize deviation bands for comparative analysis.
🎨 Color-coded Visualization : Distinct colors for upward and downward movements make it easy to distinguish between buying and selling pressures.
🚀 Quick Guide to Using the Net Buying/Selling Flows Toolkit :
🔍 Add the Indicator : Add the indicator to you favorites. Customize the settings to fit your trading requirements.
👁️🗨️ Data Analysis : Compare the trend of Buying and Selling to help indicate whether bulls or bears are in control of the market. Utilize the different display modes to present the data in different form to suite your analysis style.
🔔 Set Alerts : Activate alerts for reversal conditions to keep abreast of significant market movements without having to monitor the charts constantly.
🌐 How It Works :
The toolkit processes volume data on a lower timeframe to distinguish between buying and selling pressures based on intra-bar price closing higher or lower than it opened. It aggregates these transactions and finds the net selling and buying that took place during that bar, offering a clearer view of market fundamentals. The indicator then plots this data visually with multiple modes including comparisons between buying/selling and the net flow of the asset. Deviation thresholds help in identifying significant changes, allowing traders to spot potential buying or selling opportunities based on the money flow dynamics. The "Sum of Flows" mode is unique from other trend following indicators as it does not determine trend based on price action, but rather based on the net buying/selling. Therefore in some cases the "Sum of Flows" mode can be a leading indicator showing bullish/bearish net flows even before the prices move significantly.
Embark on a more informed trading journey with this dynamic and insightful tool, tailor-made for those who demand precision and clarity in their trading strategies. 🌟📉📈

Volume Delta [hapharmonic]Volume Delta: Volume Delta is an indicator that simplifies how you analyze trading volumes and the percentage of buy-sell activities effortlessly.
As a trader or market analyst, understanding underlying volume and trade flows is critical. The Volume Delta indicator provides thorough insight into both the total volume and the percentage of buying versus selling within the current candlestick. This information is pivotal for those looking to gauge market momentum and sentiment more effectively.
Additionally, the Volume Delta indicator can plot the candlestick colors based on the percentage of the dominant buying or selling volume. The area between the open and close prices of the candlestick is considered 100% and fills with colors corresponding to the predominant volume at that percentage.
Volume Delta also integrates the concept of Net volume. This component is crucial as it reveals the real market sentiment by calculating the difference between the volume of trades executed at an uptick and those at a downtick.
🟠 Overview
This indicator now displays in two layouts. Recently, Tradingview introduced the "force_overlay=true" function in Pine Script , allowing plots to be moved to the main chart. Thus, all displays are from the same indicator.
🟠 USAGE
From the data displayed in 'plot.style_columns' , the peak area represents the entire volume, accounting for 100%. Within this area, there are two color levels indicating volume. If one type of volume, whether buying or selling, exceeds the other, the larger volume will be positioned behind and the smaller in front. This arrangement prevents the scenario where a higher buying volume obscures the smaller selling volume. Therefore, the two colors can be switched between the front and the back as needed.
As you can see, the 12 and 26-day Exponential Moving Averages (EMAs) are used, with the Volume Confirmation Length set at 6. Therefore, the crossing of the EMAs proceeds normally, but it is highlighted with three triangular arrows to indicate a high likelihood of a valid crossover. However, if the volume is insufficient, these markers won't be displayed, although the EMA crossover will still occur as usual. This can be useful for using volume to verify the significance of the EMA crossover.
🟠 Setting
If you enable the label, please be aware that the chart size will shrink, causing the candlestick display to become unclear. Therefore, you might need to select "Logarithmic" at the bottom right of your screen, or for mobile applications, press and hold on the price scale and choose "Logarithmic" to adjust the scale appropriately.
Enjoy!

Volume Delta Candles [LuxAlgo]Volume Delta Candles provides insights about Intrabar trading activity in an easy-to-interpret manner. Lower timeframe or real-time data is used for displaying Volume Delta percentage against the total volume as a coloured bar part.
The script also highlights the intrabar price with the maximum trading activity, as well as complementary information.
🔶 USAGE
The tool focuses on intrabar volume to provide more information about the trading activity associated with a candle, without having to use an external volume indicator.
Each indicator components is further explained below:
🔹 Volume Delta
The volume delta is obtained by the difference between buy volume and sell volume, where buy volume is the volume associated with a bullish intrabar candle, and sell volume with a bearish intrabar candle.
Positive volume delta is displayed with a green candle area, while negative delta is displayed with a red candle area.
🔹 Bar Coloring
The script displays VD as a percentage of the whole, or from the candle half, depending on the setting ' Display '.
Bars can be coloured as follows:
Full (100%) when Display is set at ' Full Bar '
Half (50% or 100% of half a bar) when Display is set at ' Half Bar '
A negative VD (more bearish than bullish volume) will fill the bar from the top (or centre) of the bar towards the bottom, and a positive VD will fill a bar from the bottom (or centre) of the bar towards the top.
A negative VD on a green candle will show a red-coloured VD against a green-bordered candle. On the other hand, a positive VD on a red candle will show a green-coloured VD against a red-bordered candle.
Colours for VD sentiment opposite to the candle sentiment can be set differently if desired.
🔹 Highest Volume Price Level
The script displays a white (black on light mode) line highlighting the intrabar price level with the highest volume.
When ' Show Previous Max Volume Price ' is checked, a white (black on light mode) dot is displayed 1 bar to the right.
🔶 DETAILS
🔹 Tick/LTF data
The above example used Lower TimeFrame (LTF) data.
The following example uses real-time tick data ( Settings -> Data From )
Both options, LTF or tick data, will show a vertical dotted line where the data starts.
🔹 LTF settings
When ' Data from ' LTF is chosen and ' Auto ' enabled, the LTF will be the nearest possible x times smaller TF than the current TF. When 'Premium' is disabled, the minimum TF will always be 1 minute to ensure TradingView plans lower than Premium don't get an error.
Examples with current Daily TF (when Premium is enabled):
500 : 3 minute LTF
1500 (default): 1 minute LTF
5000: 30 seconds LTF (1 minute if Premium is disabled)
🔹 Notes
Different LTFs give different data, which means different results; this doesn't mean it isn't correct; they are just different data sets.
(LTF is displayed at the top right corner)
To ensure maximum visibility of values, we recommend using Bars from the Bar's style menu.
🔶 SETTINGS
Data from: Lower TimeFrame or real-time Tick data
Resolution: LTF setting
Auto + multiple: Adjusts the initial set resolution
Premium: Enable when your TradingView plan is Premium or higher
🔹 Intrabar Data
Colours
Display: Full/Half bar
Show previous max volume price: White/black dot, showing previous highest volume price level
🔹 Table
Show TF: Show LTF at the top right corner
Colour + table text size
🔹 Details
Show details: label with 'Volume', 'Delta' (VD) and '%'
See USAGE for more information

Periodic Activity Tracker [LuxAlgo]The Periodic Activity Tracker tool periodically tracks the cumulative buy and sell volume in a user-defined period and draws the corresponding matching bars and volume delta for each period.
Users can select a predefined aggregation period from the following options: Hourly, Daily, Weekly, and Monthly.
🔶 USAGE
This tool provides a simple and clear way of analyzing volumes for each aggregated period and is made up of the following elements:
Buy and sell volumes by period as red and green lines with color gradient area
Delta (difference) between buy & sell volume for each period
Buy & sell volume bars for each period
Separator between lines and bars, and period tags below each pair of bars for ease of reading
On the chart above we can see all the elements displayed, the volume level on the lines perfectly matches the volume level on the bars for each period.
In this case, the tool has the default settings so the anchor period is set to Daily and we can see how the period tag (each day of the week) is displayed below each pair of bars.
Users can disable the delta display and adjust the bar size.
🔹 Reading The Tool
In trading, assessing the strength of the bulls (buyers) and bears (sellers) is key to understanding the current trading environment. Which side, if any, has the upper hand? To answer this question, some traders look at volume in relation to price.
This tool provides you with a view of buy volume versus sell volume, allowing you to compare both sides of the market.
As with any volume tool, the key is to understand when the forces of the two groups are balanced or unbalanced.
As we can observe on the chart:
NOV '23: Buy volume greater than sell volume, both moving up close together, flat delta. We can see that the price is in range.
DEC '23: Buy volume bigger than Sell volume, both moving up but with a bigger difference, bigger delta than last month but still flat. We can see the price in the range above last month's range.
JAN '24: Buy and sell volume tied together, no delta whatsoever. We can see the price in range but testing above and below last month's range.
FEB '24: Buy volume explodes higher and sell volume cannot keep up, big growing delta. Price explodes higher above last month's range.
Traders need to understand that there is always an equal number of buyers and sellers in a liquid market, the quality here is how aggressive or passive they are. Who is 'attacking' and who is 'defending', who is using market orders to move prices, and who is using limit orders waiting to be filled?
This tool gives you the following information:
Lines: if the top line is green, the buyers are attacking, if it is red, the sellers are attacking.
Delta: represents the difference in their strength, if it is above 0 the buyers are stronger, if it is below 0 the sellers are stronger.
Bars: help you to see the difference in strength between buyers and sellers for each period at a glance.
🔹 Anchor Period
By default, the tool is set to Hourly. However, users can select from a number of predefined time periods.
Depending on the user's selection, the bars are displayed as follows:
Hourly : hours of the current day
Daily : days of the current week
Weekly : weeks of the current month
Monthly : months of the current year
On the chart above we can see the four periods displayed, starting at the top left and moving clockwise we have hourly, daily, weekly, and monthly.
🔶 DETAILS
🔹 Chart TimeFrame
The chart timeframe has a direct impact on the visualization of the tool, and the user should select a chart timeframe that is compatible with the Anchor period in the tool's settings panel.
For the chart timeframe to be compatible it must be less than the Anchor period parameter. If the user selects an incompatible chart timeframe, a warning message will be displayed.
As a rule of thumb, the smaller the chart timeframe, the more data the tool will collect, returning indications for longer-term price variations.
These are the recommended chart timeframes for each period:
Hourly : 5m charts or lower
Daily : 1H charts or lower
Weekly : 4H charts or lower
Monthly : 1D charts or lower
🔹 Warnings
This chart shows both types of warnings the user may receive
At the top, we can see the warning that is given when the 'Bar Width' parameter exceeds the allowed value.
At the bottom is the incompatible chart timeframe warning, which prompts the user to select a smaller chart timeframe or a larger "Anchor Period" parameter.
🔶 SETTINGS
🔹 Data Gathering
Anchor period: Time period representing each bar: hours of the day, days of the week, weeks of the month, and months of the year. The timeframe of the chart must be less than this parameter, otherwise a warning will be displayed.
🔹 Style
Bars width: Size of each bar, there is a maximum limit so a warning will be displayed if it is reached.
Volume color
Delta: Enable/Disable Delta Area Display

Delta ZigZag [LuxAlgo]The Delta ZigZag indicator is focused on volume analysis during the development of ZigZag lines. Volume data can be retrieved from a Lower timeframe (LTF) or real-time Tick data.
Our Delta ZigZag publication can be helpful in detecting indications of a trend reversal or potential weakening/strengthening of the trend.
This indicator by its very nature backpaints, meaning that the displayed components are offset in the past.
🔶 USAGE
The ZigZag line is formed by connecting Swings , which can be set by adjusting the Left and Right settings.
Left is the number of bars for evaluation at the left of the evaluated point.
Right is the number of bars for evaluation at the right of the evaluated point.
A valid Swing is a value higher or lower than the bars at the left/right .
A higher Left or Right set number will generally create broader ZigZag ( ZZ ) lines, while the drawing of the ZZ line will be delayed (especially when Right is set higher). On the other hand, when Right is set at 0, ZZ line are drawn quickly. However, this results in a hyperactive switching of the ZZ direction.
To ensure maximum visibility of values, we recommend using " Bars " from the " Bar's style " menu.
🔹 Volume examination
The script provides two options for Volume examination :
Examination per ZigZag line
Examination per bar
Bullish Volume is volume associated with a green bar ( close > open )
Bearish Volume is volume associated with a red bar ( close < open )
Neutral Volume (volume on a " close == open" bar) is not included in this publication.
🔹 Examination per ZigZag line
As long as the price moves in the same direction, the present ZZ line will continue. When the direction of the price changes, the bull/bear volume of the previous ZZ line is evaluated and drawn on the chart.
The ZZ line is divided into two parts: a bullish green line and a bearish red line.
The intercept of these two lines will depend on the ratio of bullish/bearish volume
This ratio is displayed at the intercept as % bullish volume (Settings -> Show % Bullish Volume)
* Note that we cannot draw between 2 bars. Therefore, if a ZZ line is only 1 bar long, the intercept will be at one of those 2 bars and not in between. The percentage can be helpful in interpreting bull/bear volume.
In the example above (2 most right labels), you can see that an overlap of 2 labels is prevented, ensuring the ability to evaluate the bullish % volume of the ZZ line .
The percentage will be colored green when more than 50%, red otherwise. The color will fade when the direction is contradictory; for example, 40% when the ZZ line goes up or 70% when the ZZ line falls.
More details can be visualized by enabling " Show " and choosing 1 of 3 options:
Average Volume Delta/bar
Average Volume/bar
Normalised Volume Delta
For both 'averages', the sum of " Volume "/" Volume Delta " of every bar on the ZZ line is divided by the number of bars (per ZZ line ).
The " Normalised Volume Delta " is calculated by dividing the sum of " Delta Volume " by the sum of " Volume " (neutral volume not included), which is displayed as a percentage.
All three options will display a label at the last point of the ZZ line and be coloured similarly: green when the ratio bullish/bearish volume of the ZZ line is bullish and red otherwise. Here, the colour also fades when it is bullish, but the ZZ line falls or when it is bearish with a rising ZZ line .
A tooltip at each label hints at the chosen option.
You can pick one of the options or combine them together.
🔹 Examination per bar
Besides information about what's happening during the ZZ line , information per bar can be visualized by enabling " Show Details " in Settings .
Split Volume per bar : show the sum of bullish (upV) and bearish (dnV) volume per bar
Volume (bar) : Total Volume per bar (bullish + bearish volume, neutral volume not included)
Δ Volume (bar) : Show Delta Volume (bullish - bearish volume)
🔹 Using Lower Timeframe Data
The ZigZag lines using LTF data are colored brighter. Also note the vertical line where the LTF data starts and the gap between ZZ lines with LTF data and without.
When " LTF " is chosen for the " Data from: " option in Settings , data is retrieved from Lower Timeframe bars (default 1 minute). When the LTF setting is higher than the current chart timeframe, the LTF period will automatically be adjusted to the current timeframe to prevent errors.
As there is a 100K limit to the number of LTF intrabars that can be analyzed by a script, this implies the higher the difference between LTF and current TF; the fewer ZZ lines will be seen.
🔹 Using real-time tick data
The principles are mostly the same as those of LTF data. However, in contrast with LTF data, where you already have LTF ZZ lines when loading the script, real-time tick data-based ZZ lines will only start after loading the chart.
Changing the settings of a ticker will reset everything. However, returning to the same settings/ticker would show the cached data again.
Here, you can see that changing settings reset everything, but returning after 2 minutes to the initial settings shows the cached data. Don't expect it to be cached for hours or days, though.
🔶 DETAILS
The timeframe used for LTF data should always be the same or lower than the current TF; otherwise, an error occurs. This snippet prevents the error and adjusts the LTF to the current TF when LTF is too high:
res = input.timeframe('1')
res := timeframe.from_seconds( math.min( timeframe.in_seconds(timeframe.period), timeframe.in_seconds(res) ) )
🔶 SETTINGS
Data from: LTF (Lower TimeFrame) or Ticks (Real-time ticks)
Res: Lower TimeFrame (only applicable when choosing LTF )
Option: choose " high/low " or " close " for Swing detection
🔹 ZigZag
Left: Lookback period for Swings
Right: Confirmation period after potential Swing
🔹 ZigZag Delta
Show % Bullish Volume : % bullish volume against total volume during the ZZ line
Show:
Average Volume Delta/bar
Average Volume/bar
Normalised Volume Delta
See USAGE for more information
🔹 Bar Data
Split Volume per bar: shows the sum of bullish ( upV ) and bearish ( dnV ) volume per bar
Volume (bar): Total Volume per bar (bullish + bearish volume, neutral volume not included)
Δ Volume (bar): Show Volume Delta (bullish - bearish volume)
