Detrended Price Oscillator StrategyTHIS IS THE STRATEGY VERSION
What is DPO?
A detrended price oscillator is an oscillator that strips out price trends in an effort to estimate the length of price cycles from peak to peak or trough to trough. Unlike other oscillators, such as the stochastic or moving average convergence divergence (MACD), the DPO is not a momentum indicator. It highlights peaks and troughs in price, which are used to estimate buy and sell points in line with the historical cycle.
(From Investopedia )
Indicator features:
Responds faster than the original code.
Added alternative smoothing algorithms. Defaults to Ehler's Optimum Elliptic filter instead of the orginal SMA
IPOCS - can start printing out data at day 1 instead of waiting for 14 or 20 bars
Dynamic colors
Auto timeframe detection to adjust period/length
How to use:
Buy above zero
Sell below zero
Who is it for?
Long term investors - this is the perfect indicator for those who buy and hold
Detrended Price Oscillator (DPO)

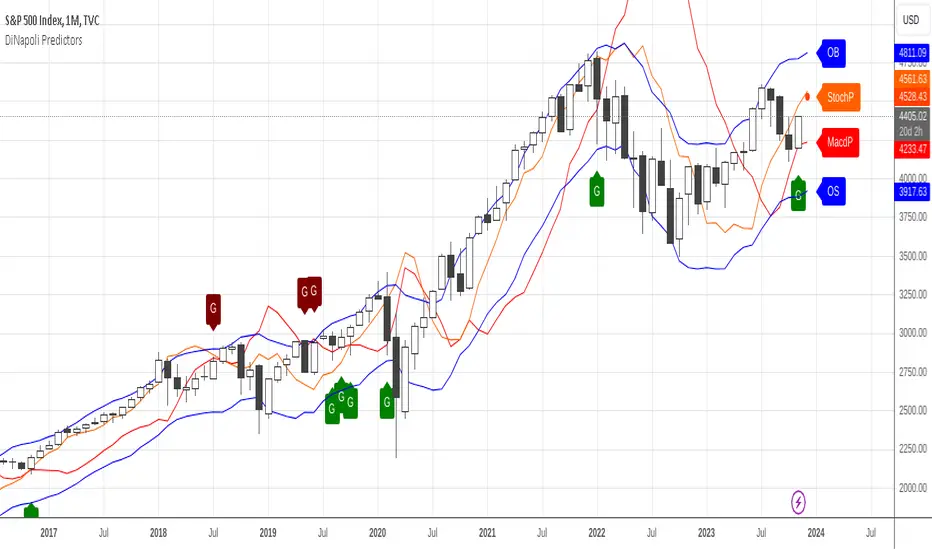
DiNapoli Bundle PredictorsThis Premium Indicator allows to plot the following DiNapoli Predictors Tools into the price chart:
Momentum Predictors based on:
MACD Predictor
Stochastic Predictor
OB/OS Predictors based on:
Oscillator Predictor
Stochastic Predictor
If you would like to subscribe , please send me a private message.
M waves Mk3 'Magical M's v1
V2
V3
So I forgot this existed so here is the Opened sourced code (pm me for older sorce code there are 600+ Saves)(pm me for other scrips course code too lazy to republish everything)
Changes: Simplified and annotated code/upgraded to v4 format
as always adjust before using
i use this indicator combined with the other frequency one to help me identify time and direction of next move.
Pair with rsi
Pair with detrended tsi (have unpublished script might share later)
‘Redraw’ safe
Slightly detrented(adjustable) to avoid traps
quick how to use:
Meant as and adjustable indicator to “tune" to personal risk/reward preference
Green means buy red means sell
arrow indicators for long term sell and buy
Highly customizable (candles too)
Check out my profile for previous versions they are less customizable but also easier to get started with
similar to rsi you want to buy/sell when the indicator turns green/red and lines are as pinched as posible (the lines that are being filled).
keep an eye on the other line that moves around ;) if its not matching the other 2 moving averages and the main color indicator chances are its a trap(works both ways)
use the candles to help you keep your eye on the indicator when scalping (look at the original post for some color ideas)

Zero-Lag Smoothed CycleOld indicator ! But its a simple trick to have a zero-lag smoothing effect, i think i did it because the smoothing was kinda asymmetrical with the detrended line. So even if the result appear quite good take into account that the detrended line isn't always correlated with the price.

Ehlers Triple Delay-Line DetrenderThis indicator was originally developed by John F. Ehlers (Stocks & Commodities , V.18:7 (July, 2000): "Optimal Detrending").
Mr. Ehlers applied the ideas of the radar systems for the financial time series detrending.
Mr. Ehlers constructed the Triple Delay-Line Canceller first, then smoothed it with the Modified Optimum Elliptic Filter with minimal lag. The smoothed detrended signal is smoothed again with the Modified Optimum Elliptic Filter to obtain signal line.
As result, the crossings of the two indicator lines catch every major cyclic move and the detrender itself can be used as the first step in more sophisticated analyses.

DiNapoli Bundle Oscillators 3-in-1DiNapoli Oscillators 3-in-1 is a Bundle that includes the 3 oscillators used by DiNapoli in just 1 single indicator :
DiNapoli MACD (Dema)
DiNapoli Preferred Stochastic
DiNapoli Detrended Oscillator (DOSC)
This Bundle version includes the following features :
Ability to select which Oscillator to plot: MACD, Stochastic or Detrended
Show/Hide the Oscillation Lines
Show Crosses with Signal Line
Add a label to each oscillator for ease of identification
Adapt OB/OS Factor Ratio to each Market
Show OB/OS Levels
Show Preceding OB/OS Cloud
Show Divergences (experimental)
For convenience it also includes Custom Alerts . Now it is possible to get alerts on:
Oscillator Cross
Bullish Oscillator Cross
Bearish Oscillator Cross
OverBought Condition
Entering OverBought Condition
Exiting OverBought Condition
OverSold Condition
Entering OverSold Condition
Exiting OverSold Condition
Possible Regular Divergence
Possible Regular Bullish Divergence
Possible Regular Bearish Divergence
This indicator is meant to be used by professional traders.
If you would like to subscribe , please send me a private message.

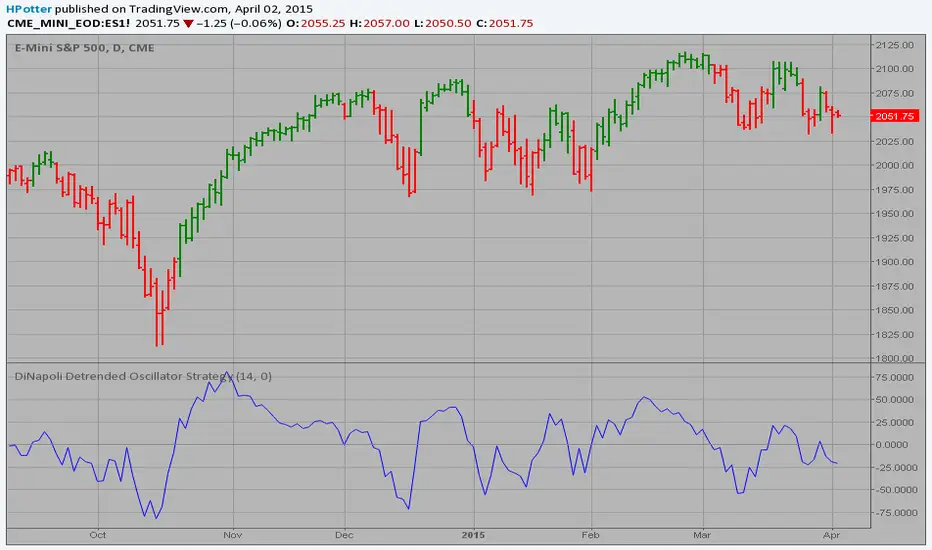
DiNapoli Detrended Oscillator (DOSC)DiNapoli Detrended Oscillator (DOSC) is a custom indicator used for identifying OverBought (OB) and OverSold (OS) condition in markets.
This version of the indicator includes the following features :
Show/Hide the Oscillation Lines
Set Custom Oscillation Periods
Adapt OB/OS Factor Ratio to each Market
Show OB/OS Levels
Show Preceding OB/OS Cloud
Highlight OB/OS Condition in the Line
Show the Zero Line
Show Divergences (experimental)
For convenience it also includes Custom Alerts . Now it is possible to get alerts on:
OverBought Condition
Entering OverBought Condition
Exiting OverBought Condition
OverSold Condition
Entering OverSold Condition
Exiting OverSold Condition
Oscillator Cross
Bullish DOSC Strength
Bearish DOSC Strength
Possible Regular Divergence
Possible Regular Bullish Divergence
Possible Regular Bearish Divergence
This indicator is meant to be used by professional traders.
If you would like to subscribe , please send me a private message.

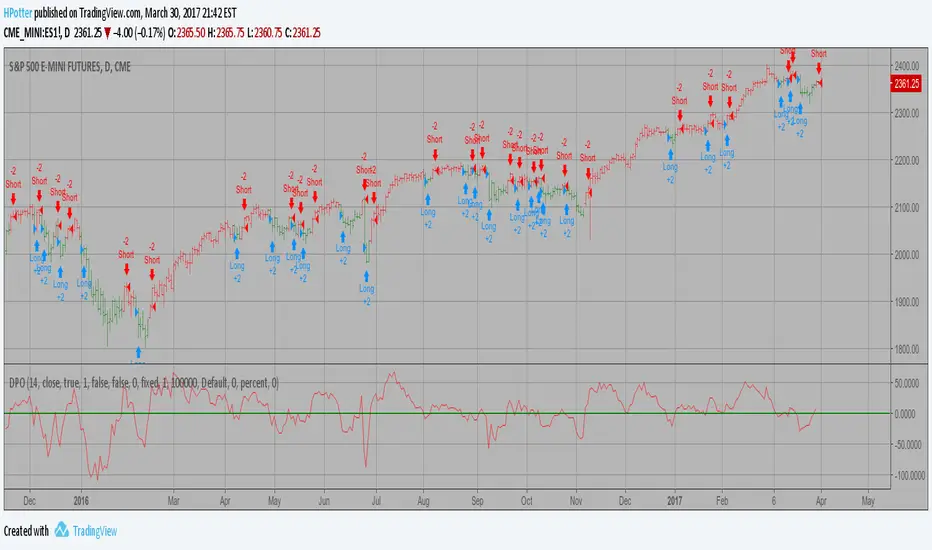
Detrended Price Oscillator Strategy Backtest The Detrend Price Osc indicator is similar to a moving average,
in that it filters out trends in prices to more easily identify
cycles. The indicator is an attempt to define cycles in a trend
by drawing a moving average as a horizontal straight line and
placing prices along the line according to their relation to a
moving average. It provides a means of identifying underlying
cycles not apparent when the moving average is viewed within a
price chart. Cycles of a longer duration than the Length (number
of bars used to calculate the Detrend Price Osc) are effectively
filtered or removed by the oscillator.
You can change long to short in the Input Settings
Please, use it only for learning or paper trading. Do not for real trading.
D_DSP (Detrended Synthetic Price) Strategy Detrended Synthetic Price is a function that is in phase with the
dominant cycle of real price data. This DSP is computed by subtracting
a half-cycle exponential moving average (EMA) from the quarter cycle
exponential moving average.
See "MESA and Trading Market Cycles" by John Ehlers pages 64 - 70.


D_DSP (Detrended Synthetic Price ) Detrended Synthetic Price is a function that is in phase with the
dominant cycle of real price data. This DSP is computed by subtracting
a half-cycle exponential moving average (EMA) from the quarter cycle
exponential moving average.
See "MESA and Trading Market Cycles" by John Ehlers pages 64 - 70.

Detrended Price OscillatorHi
Let me introduce my Detrended Price Oscillator script.
The Detrend Price Osc indicator is similar to a moving average,
in that it filters out trends in prices to more easily identify
cycles. The indicator is an attempt to define cycles in a trend
by drawing a moving average as a horizontal straight line and
placing prices along the line according to their relation to a
moving average. It provides a means of identifying underlying
cycles not apparent when the moving average is viewed within a
price chart. Cycles of a longer duration than the Length (number
of bars used to calculate the Detrend Price Osc) are effectively
filtered or removed by the oscillator.
