Deviation
MA Deviation for JPN225/xJPN [mado]Environment recognition for xJPN.
work on xJPN chart.
MA Deviation of fast/slow group(default: fast 9/21/55 slow 75/100/200)
use average of each group's dev.
current pair dev line: fast/aqua slow/green
JPN225 (NIKKEI on FXCM ) dev line: fast/yellow slow/red

Commodity Channel IndexI was checking the formula of built-in " cci " function and decided to publish a more customizable version of the Commodity Channel Index, so you can play with levels and a bunch of different sources.
If someone doesn't know what is this:
This indicator was originally developed by Donald R. Lambert ( "Commodities" magazine, 1980) to identify cyclical or seasonal price patterns in commodities. Now it is applied not only to commodities but to market indices, stocks and Forex.
Good luck!


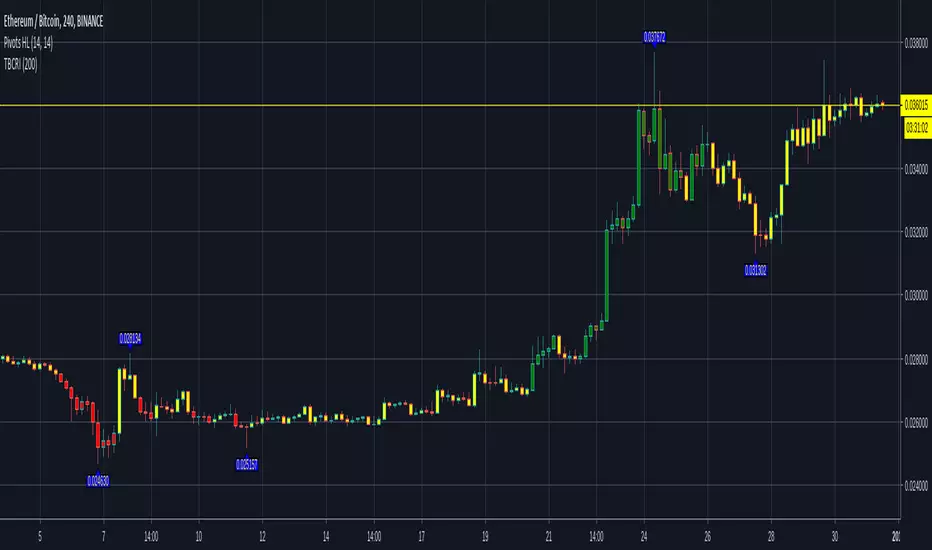
TBCRI - Trend Bar Color Reversal IndicatorAn idea I had today morning so I had to write. It seems to detect trends well. It has three phases like a semaphor, painting the chart bars of green, yellow or red.
=== Bar Color Meaning ===
Green: uptrend
Yellow: don't care
Red: downtrend
I think it can be useful!
Thanks!
[RESEARCH] Mean Absolute DeviationHello traders and developers!
I was wondering how built-in "dev" function in Pine is calculated so I made a little research.
I examined 7 samples:
0) "dev" function itself
1) "dev" according to its description: series - sma(series)
2) Mean Absolute Deviation
3) ratio of the absolute difference from 1) divided by period
4) ratio of the difference from 1) divided by period
5) Median Absolute Deviation
6) tricky for-loop to calculate Mean Absolute Deviation
The results of the null and sixth samples are identical.
So, TV built-in "dev" function represents Mean Absolute Deviation and it's description is incorrect.
Where it is used? For example: Commodity Channel Index. You can check its original formula and if you used simple standard deviation instead of MAD in your CCIs - well guys, you were wrong.
Good luck!

Phase Change IndexPhase Change Index script.
This indicator was developed and described by M. H. Pee (Stocks & Commodities V.22:5 (28-37): Phase Change Index).
Other indicators of M. H. Pee:
Hampel FilterHampel Filter script.
This indicator was originally developed by Frank Rudolf Hampel (Journal of the American Statistical Association, 69, 382–393, 1974: The influence curve and its role in robust estimation).
The Hampel filter is a simple but effective filter to find outliers and to remove them from data. It performs better than a median filter.

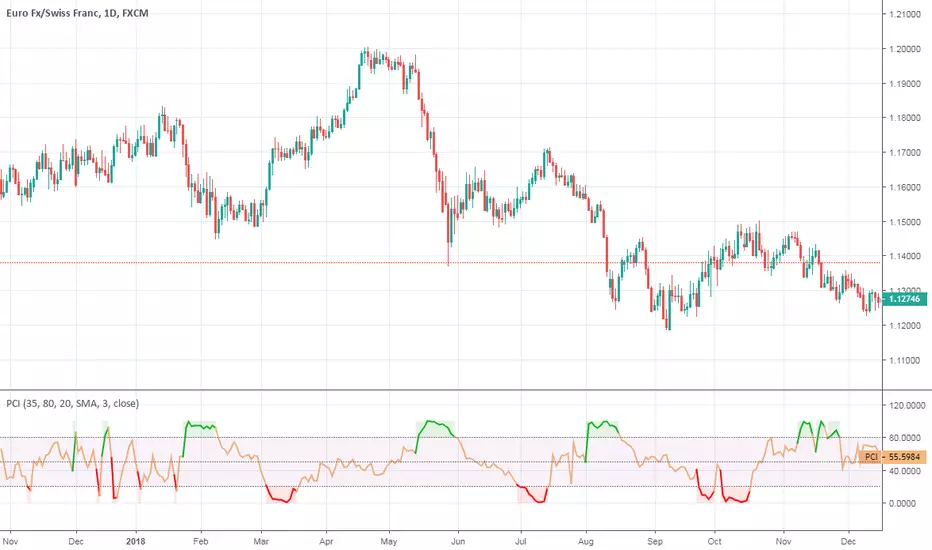
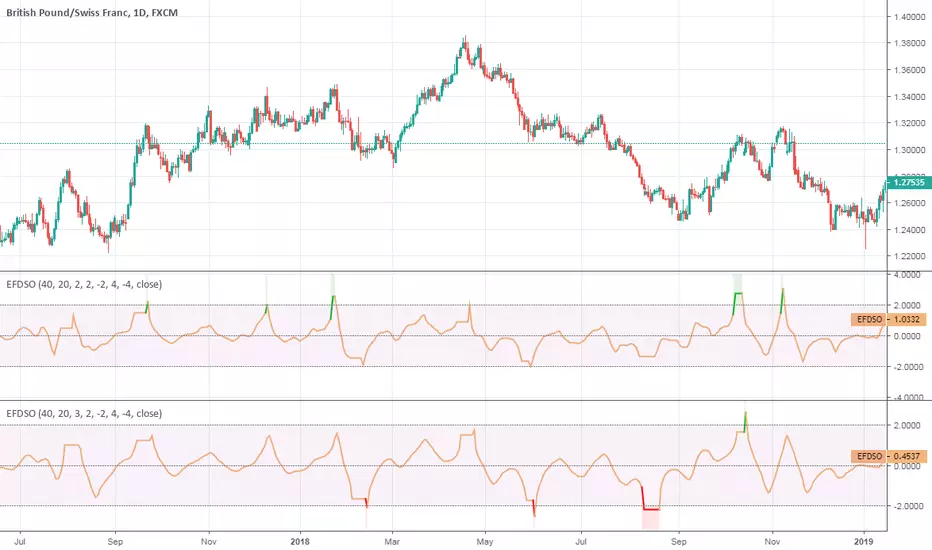
Ehlers Fisherized Deviation-Scaled OscillatorEhlers Fisherized Deviation-Scaled Oscillator script.
This indicator was originally developed by John F. Ehlers (Stocks & Commodities V. 36:11: Probability - Probably A Good Thing To Know).
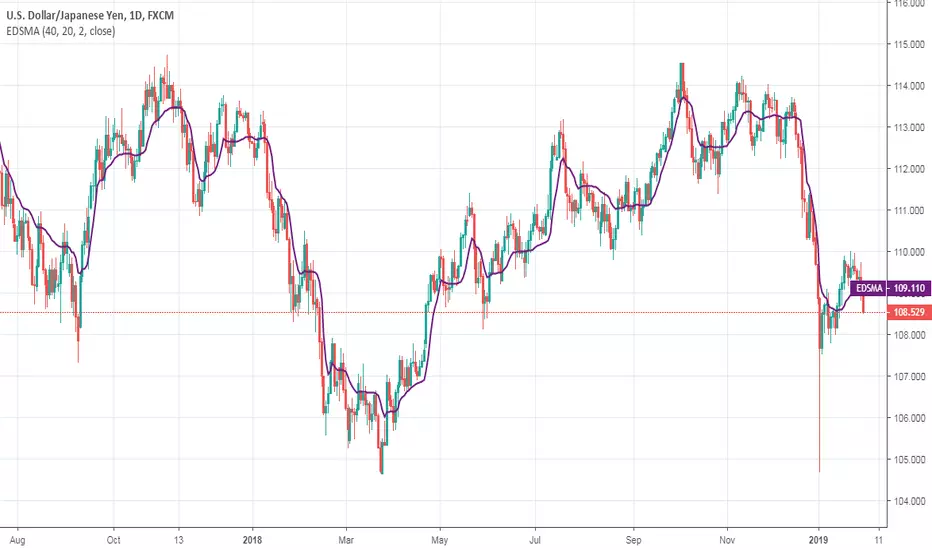
Ehlers Deviation-Scaled Moving Average (DSMA)Ehlers Deviation-Scaled Moving Average indicator script.
This indicator was originally developed by John F. Ehlers (Stocks & Commodities V. 36:8: The Deviation-Scaled Moving Average).

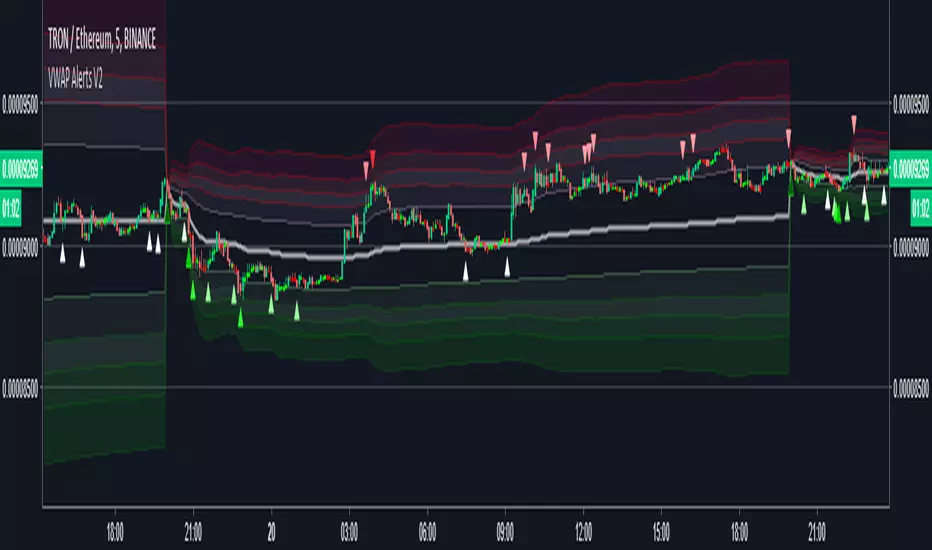
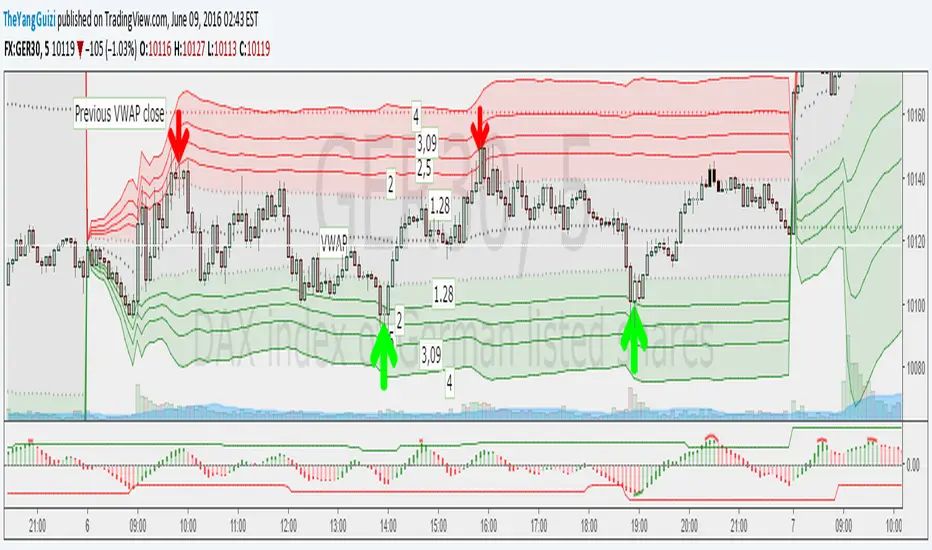
VWAP Alerts V2Alerts added to "VWAP Stdev Bands v2" by SandroTurriate
Changes
-Adjusted trigger conditions for higher signal sensitivity
-Color change on bands and signals for better readability and ease on the eyes
-Alerts added for up to 4 deviations up and down
-Re-enabled deviations 4 and 5
-Re-enabled previous close
NMA indicatorIndicator “NMA”
Class : oscillator/trend deviations
Trading type : intraday
Time frame : 5 min – 60 min
Purpose : search for divergences
Level of aggressiveness : standard
Indicator «NMA» is used to determine the divergence points between current prices and their fair (theoretical, calculated) values. Presence of strong divergence is a signal that prices have entered overbought/oversold zone. This, in turn, is a basis for position opening opposite to the current price dynamics.
Structure of the indicator
Indicator consists of colored lines and signal triangles, displayed on the chart.
- green line – shows current fair price. When current price is close to this line it means that there are no any significant divergences in the price dynamics. The green line is also a take-profit line – at this price positions should be closed;
- blue line – shows synthetic support level (analogue of the oversold zone), which is changing dynamically. From blue line “buy” trades are recommended;
- red line – shows synthetic resistance level (analogue of the overbought zone), which is changing dynamically. From red line “sell” trades are recommended;
To ease the trading process indicator displays on the chart “buy” and “sell” signals in form of blue/red triangles.
Input parameters of the indicator
To set up the indicator a number of input parameters are used:
- AR period (period of indicator, by default = 21) – is used to calculate fair (theoretical) prices based on linier auto regression model.
- Number of deviations (the number of standard deviations, by default = 1.5) – this parameter regulates the level of aggressiveness of the indicator. The bigger the parameter is the less signals are generated, but higher the quality if these signals is.
Rules of trading
Indicator can be used on the any time frame. For the intraday purposes periods from 5 min to 1 hour are recommended.
The general rules are as follows:
- if price crosses the blue line up-down – this is a signal that current price has fallen too much relatively its theoretical value (analogue of the oversold zone);
- if price crosses the red line down-up – this is a signal that current price has risen too much relatively its theoretical value (analogue of the overbought zone);
- “buy” from the blue line. For additional indication blue triangle is displayed on the chart;
- “sell” from the red line. For additional indication red triangle is displayed on the chart;
- take-profits are set near the green line
- stop-losses are not provided. Positions are closed after the opposite signal appears.

Relative Volatility IndexCorrected Relative Volatility Index. This indicator was originally developed by Donald Dorsey (Stocks & Commodities V.11:6 (253-256): The Relative Volatility Index).
The indicator was revised by Dorsey in 1995 (Stocks & Commodities V.13:09 (388-391): Refining the Relative Volatility Index).
I suggest the refined RVI with optional settings. If you disabled Wilder's Smoothing and Refined RVI you will get the original version of RVI (1993, as built-in).
Also, you can choose an algorithm for calculating Standard Deviation.

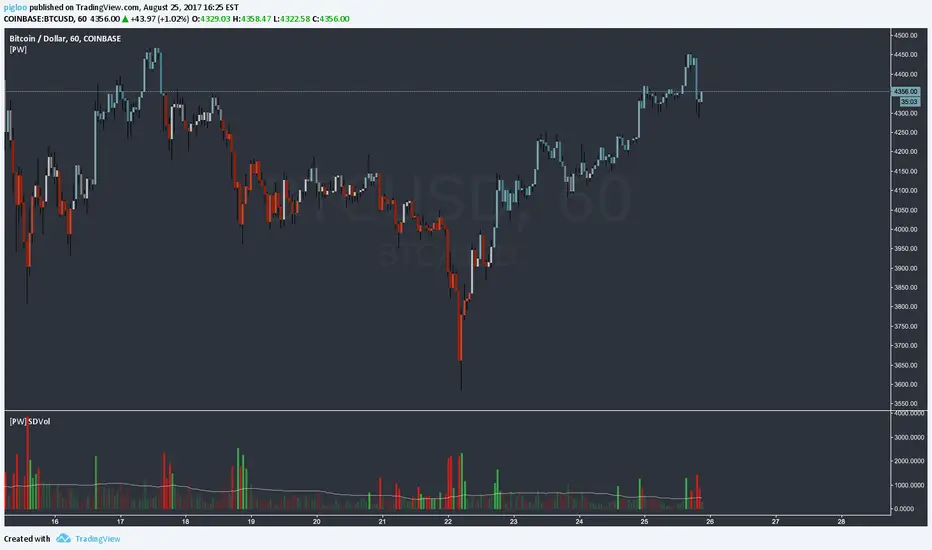
[PW] Volume Standard DeviationHere is a nice little script that highlights areas of volume using standard deviation, you can choose the look back periods.
This script is based on the excellent script by: @SteynTrade -
I have simplified it a bit and made it readable to my taste using alpha to highlight high volume areas.
Enjoy.
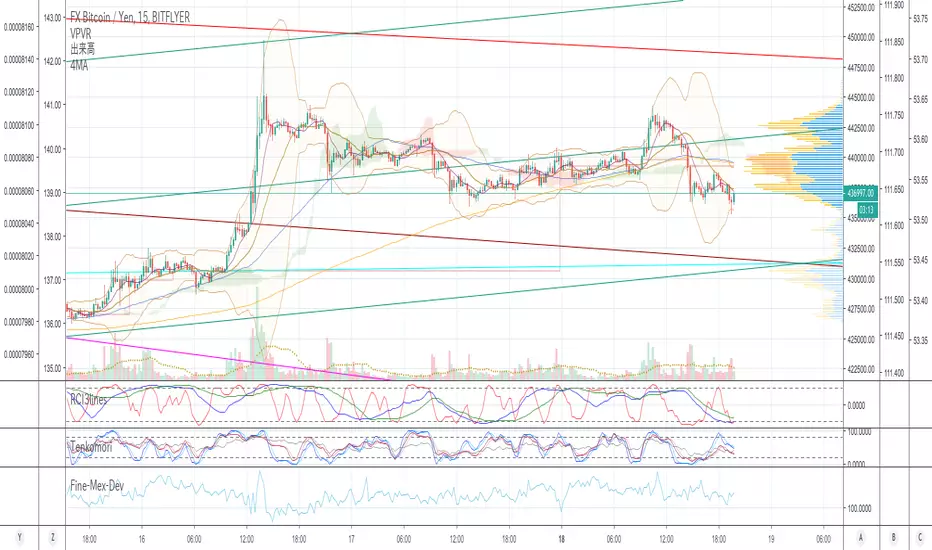
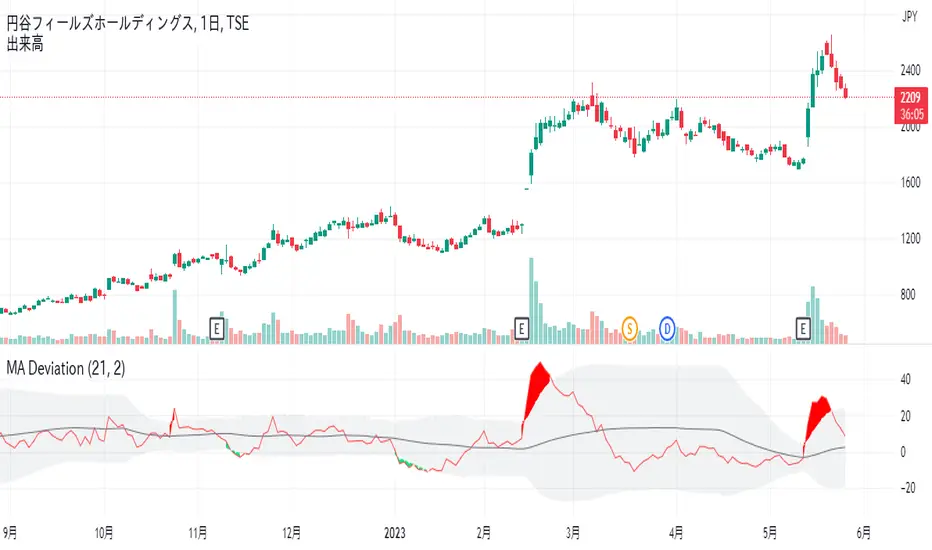
Moving average deviation rateMoving average deviation rate
Simple moving average deviation rate and standard deviation.
The bollinger band is momentum value standard devition.
Bat the bollinger band is not normal distribution to close price.
Moving average deviation rate is normal distribution.
This indicator is draw Moving average deviation rate and fill area 2σ standard devition.
If it exceeds 2σ, it is a trading opportunity.
移動平均かい離率と、2σのバンドです。
ボリンジャーバンドは移動量の標準偏差を描画しますが、終値はボリンジャーバンドに対して正規分布を描きません。
移動平均かい離率は、標準偏差に対して正規分布を示します。
かい離率2σを超えた場合、トレードチャンスです。
B3 ALMA PendulumB3 Pendulums, quick little indicators that do change print inside the current bar, so beware. It is good for anticipation, but it is important to make sure the current and next bars follow through.
Ever wanted an indicator that really points out the micro term action in the form of a pendulum swing? This my attempt to show the market ups and downs in the smallest amount of lag possible. This indicator is designed to bounce back and forth from 100 to -100 as it shows you the price's relationship to ALMA. Really its just a simple deviance from mean study made to amplify the quick ups and downs, and kind of the neatest on Heikin Ashi setups. It looks like Arabic language at first glance, lol.
This should be easy to template out to your own MA's. ~I hope you are enjoying the B3 scripts, that is now 9 open source shares and a couple protected ones. I still plan on a few more give-a-ways, as I prepare some of the algorithmic things I do for subscription. Feel free to comment about things you would like to see! ~B3

VWAP Stdev Bands v2 Modoriginal script by /u/SandroTurriate/ - I just made some small changes.
Vwap + standard deviation bands. Good for reversal trading among other things. Used intraday.
Very useful when price is ranging.
I added the option to fill the spaces between the deviation lines with color and also the option to add some extra bands. That's about it. Color/length/style etc is customizable.
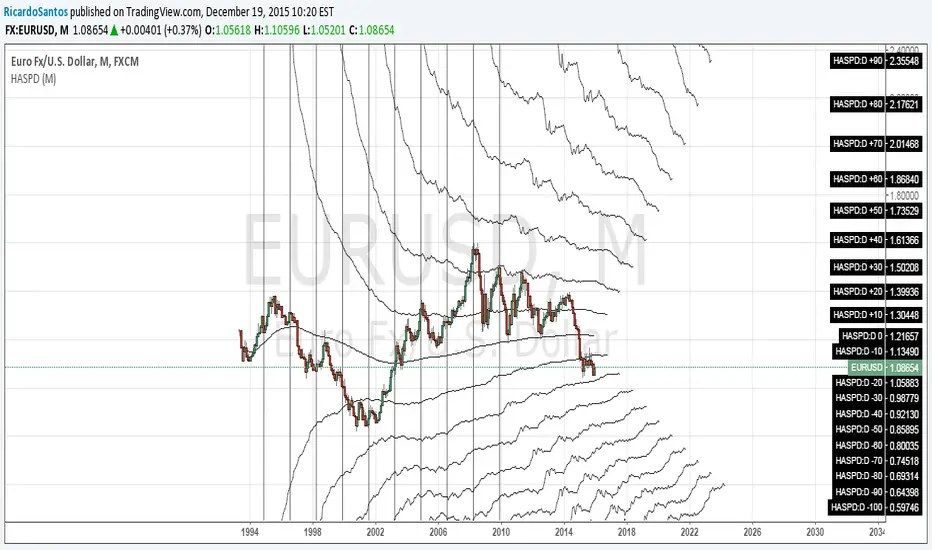
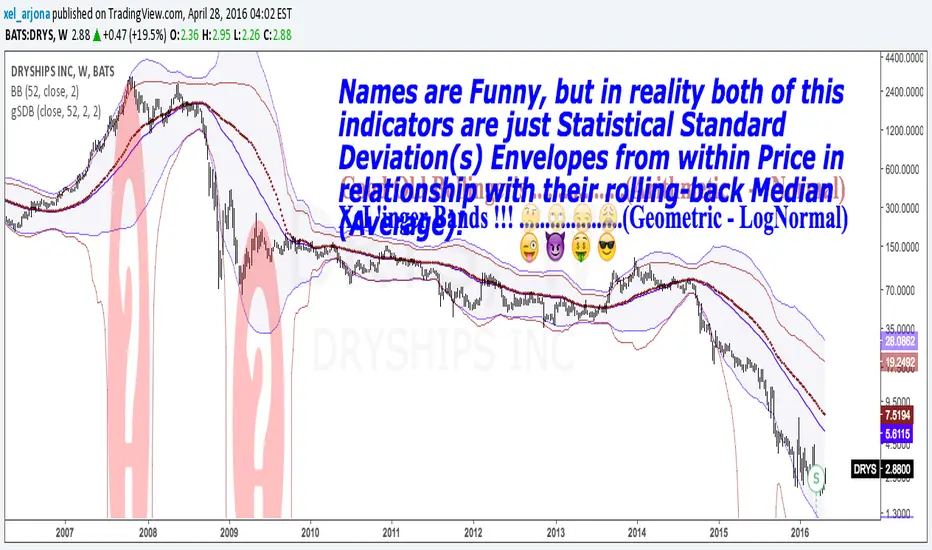
GEOMETRIC STANDARD DEVIATION BANDS v1 by @XeL_ArjonaGEOMETRIC STANDARD DEVIATION BANDS
Ver.1 By Ricardo M Arjona @XeL_Arjona
DISCLAIMER:
The Following indicator/code IS NOT intended to be a formal investment advice or recommendation by the author, nor should be construed as such. Users will be fully responsible by their use regarding their own trading vehicles/assets.
The embedded code and ideas within this work are FREELY AND PUBLICLY available on the Web for NON LUCRATIVE ACTIVITIES and must remain as is.
WHAT'S THIS?
This IS NOT the wheel "Re-Invention"... This is exactly what the name says: A pair of Envelope Bands to measure "volatility", constructed at statistical relation from within price series and their Rolling back MEAN (Simple Moving Average). YES, What Mr. Bollinger did and put it's name to this simple, cleaver and popular formula.
This time, I took the time to make another simple mod, but seems to me to be quite functional in REAL VOLATILE assets like in the example chart: TO USE THEIR GEOMETRIC MODE!!
Cheers!
Any feedback or public modification(s) are quite welcome to the community....!
@XeL_Arjona
Apr 28 2016
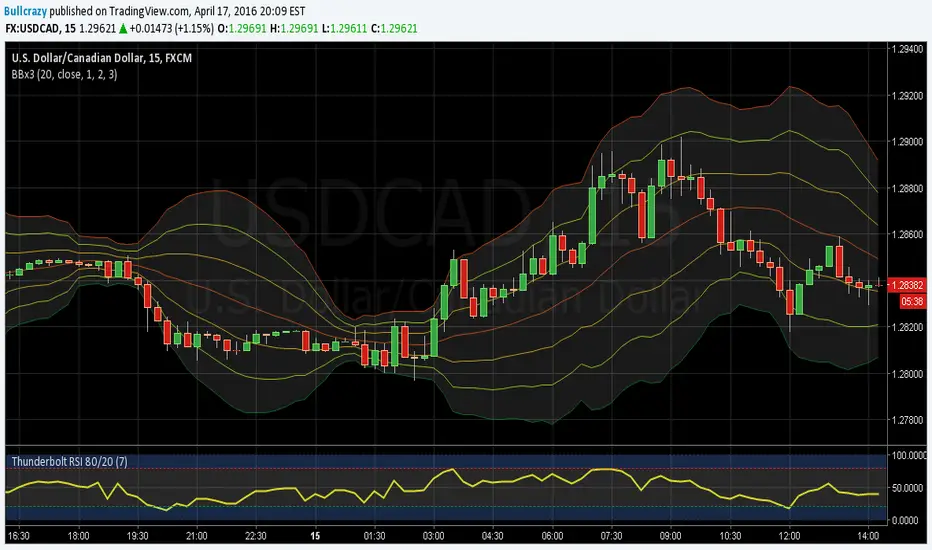
Triple Bollinger BandsI found myself using multiple bollinger bands a lot so I decided to add them all to one script and add the ability to adjust them by 0.2. It has helped me by not taking up as much space in the upper left corner as well as improving my in's and outs of trend continuation trades. If you manage to find a double top at +2 or greater deviation, and with a bearish divergence on the RSI as shown in this picture, GO SHORT SON! This was a fast and easy 35 - 40 pips and if you used your fibonacci for an exit you had little doubt of the final result and could have even been prepared for an immediate reversal knowing you were then at an oversold -2.8 deviation. I could go on and on........