Day Trading Booster by DGTTiming when day trading can be everything
In Stock markets typically more volatility (or price activity) occurs at market opening and closings
When it comes to Forex (foreign exchange market), the world’s most traded market, unlike other financial markets, there is no centralized marketplace, currencies trade over the counter in whatever market is open at that time, where time becomes of more importance and key to get better trading opportunities. There are four major forex trading sessions, which are Sydney , Tokyo , London and New York sessions
Forex market is traded 24 hours a day, 5 days a week across by banks, institutions and individual traders worldwide, but that doesn’t mean it’s always active the entire day. It may be very difficult time trying to make money when the market doesn’t move at all. The busiest times with highest trading volume occurs during the overlap of the London and New York trading sessions, because U.S. dollar (USD) and the Euro (EUR) are the two most popular currencies traded. Typically most of the trading activity for a specific currency pair will occur when the trading sessions of the individual currencies overlap. For example, Australian Dollar (AUD) and Japanese Yen (JPY) will experience a higher trading volume when both Sydney and Tokyo sessions are open
There is one influence that impacts Forex matkets and should not be forgotten : the release of the significant news and reports. When a major announcement is made regarding economic data, currency can lose or gain value within a matter of seconds
Cryptocurrency markets on the other hand remain open 24/7, even during public holidays
Until 2021, the Asian impact was so significant in Cryptocurrency markets but recent reasearch reports shows that those patterns have changed and the correlation with the U.S. trading hours is becoming a clear evolving trend.
Unlike any other market Crypto doesn’t rest on weekends, there’s a drop-off in participation and yet algorithmic trading bots and market makers (or liquidity providers) can create a high volume of activity. Never trust the weekend’ is a good thing to remind yourself
One more factor that needs to be taken into accout is Blockchain transaction fees, which are responsive to network congestion and can change dramatically from one hour to the next
In general, Cryptocurrency markets are highly volatile, which means that the price of a coin can change dramatically over a short time period in either direction
The Bottom Line
The more traders trading, the higher the trading volume, and the more active the market. The more active the market, the higher the liquidity (availability of counterparties at any given time to exit or enter a trade), hence the tighter the spreads (the difference between ask and bid price) and the less slippage (the difference between the expected fill price and the actual fill price) - in a nutshell, yield to many good trading opportunities and better order execution (a process of filling the requested buy or sell order)
The best time to trade is when the market is the most active and therefore has the largest trading volume, trading all day long will not only deplete a trader's reserves quickly, but it can burn out even the most persistent trader. Knowing when the markets are more active will give traders peace of mind, that opportunities are not slipping away when they take their eyes off the markets or need to get a few hours of sleep
What does the Day Trading Booster do?
Day Trading Booster is designed ;
- to assist in determining market peak times, the times where better trading opportunities may arise
- to assist in determining the probable trading opportunities
- to help traders create their own strategies. An example strategy of when to trade or not is presented below
For Forex markets specifically includes
- Opening channel of Asian session, Europien session or both
- Opening price, opening range (5m or 15m) and day (session) range of the major trading center sessions, including Frankfurt
- A tabular view of the major forex markets oppening/closing hours, with a countdown timer
- A graphical presentation of typically traded volume and various forext markets oppening/clossing events (not only the major markets but many other around the world)
For All type of markets Day Trading Booster plots
- Day (Session) Open, 5m, 15m or 1h Opening Range
- Day (Session) Referance Levels, based on Average True Range (ATR) or Previous Day (Session) Range (PH - PL)
- Week and Month Open
Day Trading Booster also includes some of the day trader's preffered indicaotrs, such as ;
- VWAP - A custom interpretaion of VWAP is presented here with Auto, Interactive and Manual anchoring options.
- Pivot High/Low detection - Another custom interpretation of Pivot Points High Low indicator.
- A Moving Average with option to choose among SMA, EMA, WMA and HMA
An example strategy - Channel Bearkout Strategy
When day trading a trader usually monitors/analyzes lower timeframe charts and from time to time may loose insight of what really happens on the market from higher time porspective. Do not to forget to look at the larger time frame (than the one chosen to trade with) which gives the bigger picture of market price movements and thus helps to clearly define the trend
Disclaimer : Trading success is all about following your trading strategy and the indicators should fit within your trading strategy, and not to be traded upon solely
The script is for informational and educational purposes only. Use of the script does not constitutes professional and/or financial advice. You alone the sole responsibility of evaluating the script output and risks associated with the use of the script. In exchange for using the script, you agree not to hold dgtrd TradingView user liable for any possible claim for damages arising from any decision you make based on use of the script
DGT

Volume Profile, Pivot Anchored by DGTVolume Profile (also known as Price by Volume ) is an charting study that displays trading activity over a specified time period at specific price levels. It is plotted as a horizontal histogram on the finacial isntrumnet's chart that highlights the trader's interest at specific price levels. Specified time period with Pivots Anchored Volume Profile is determined by the Pivot Levels, where the Pivot Points High Low indicator is used and presented with this Custom indicator
Finally, Volume Weighted Colored Bars indicator is presneted with the study
Different perspective of Volume Profile applications;
Anchored to Session, Week, Month etc : Anchored-Volume-Profile
Custom Range, Interactive : Volume-Profile-Custom-Range
Fixed Range with Volume Indicator : Volume-Profile-Fixed-Range
Combined with Support and Resistance Indicator : Price-Action-Support-Resistance and Volume-Profile
Combined with Supply and Demand Zones, Interactive : Supply-Demand-and-Equilibrium-Zones
Disclaimer : Trading success is all about following your trading strategy and the indicators should fit within your trading strategy, and not to be traded upon solely
The script is for informational and educational purposes only. Use of the script does not constitutes professional and/or financial advice. You alone the sole responsibility of evaluating the script output and risks associated with the use of the script. In exchange for using the script, you agree not to hold dgtrd TradingView user liable for any possible claim for damages arising from any decision you make based on use of the script

Oscillators Overlay w/ Divergencies/Alerts by DGTAn oscillator is a technical analysis tool that, simply said, gauge momentum, determine market trend direction and duration. For some oscillators, fluctuations are bounded by some upper and lower band, and traders use them to discover short-term overbought or oversold conditions.
Oscillators are often combined with moving average indicators to signal trend breakouts or reversals
Histogram, is the difference between the oscillator and signal lines, which oscillates above and below a center line and is used as a good indication of an asset's momentum
What to look for
- Signal Line Crossover is the most common signal produced by the oscillators
- Zero Line Crossovers have a very similar premise to Signal Line Crossovers
- Divergence , when the oscillator and actual price are not in agreement, is another signal created by the oscillators
- Overbought and Oversold , with any range-bound oscillator, conditions are a primary signal generated
Oscillators Overlay study
* Presents oscillators on top of the mian chart (price chart)
* A single indicator for many well known and custom oscillators
* Divergence detection
* Alerts for various condtions
The list of oscillators included;
- Awesome Oscillator (AO)
- Chaikin Oscillator (Chaikin Osc)
- Commodity Channel Index (CCI)
- Distance Oscillator
- Elder-Ray Bear and Bull Power
- Elliott Wave Oscillator (EWO)
- Klinger Oscillator
- Money Flow Index (MFI)
- Moving Average Convergence Divergence (MACD)
- Rate Of Change (ROC)
- Relative Strength Index (RSI)
- Stochastic (Stoch)
- Stochastic RSI (Stoch RSI)
- Volume Oscillator (Volume Osc)
- Wave Trend
In technical analysis, investors find oscillators to be important technical tools and consider them more effective when used in conjunction with other means of technical analysis
Disclaimer : Trading success is all about following your trading strategy and the indicators should fit within your trading strategy, and not to be traded upon solely
The script is for informational and educational purposes only. Use of the script does not constitutes professional and/or financial advice. You alone the sole responsibility of evaluating the script output and risks associated with the use of the script. In exchange for using the script, you agree not to hold dgtrd TradingView user liable for any possible claim for damages arising from any decision you make based on use of the script

MACD-X Overlay, More Than MACD by DGTMoving Average Convergence Divergence – MACD
The most popular indicator used in technical analysis , the moving average convergence divergence ( MACD ), created by Gerald Appel. MACD is a trend-following momentum indicator , designed to reveal changes in the strength, direction, momentum, and duration of a trend in a financial instrument’s price
Historical evolution of MACD ,
- Gerald Appel created the MACD line,
- Thomas Aspray added the histogram feature to MACD
- Giorgos E. Siligardos created a leader of MACD
MACD employs two Moving Averages of varying lengths (which are lagging indicators) to identify trend direction and duration. Then, MACD takes the difference in values between those two Moving Averages (MACD Line) and an EMA of those Moving Averages (Signal Line) and plots that difference between the two lines as a histogram which oscillates above and below a center Zero Line. The histogram is used as a good indication of a security's momentum.
The MACD indicator is typically good for identifying three types of basic signals;
Signal Line Crossovers
A Signal Line Crossover is the most common signal produced by the MACD . On the occasions where the MACD Line crosses above or below the Signal Line, that can signify a potentially strong move. The standard interpretation of such an event is a recommendation to buy if the MACD line crosses up through the Signal Line (a "bullish" crossover), or to sell if it crosses down through the Signal Line (a "bearish" crossover). These events are taken as indications that the trend in the financial instrument is about to accelerate in the direction of the crossover.
Zero Line Crossovers
Zero Line Crossovers occur when the MACD Line crossed the Zero Line and either becomes positive (above 0) or negative (below 0). A change from positive to negative MACD is interpreted as "bearish", and from negative to positive as "bullish". Zero crossovers provide evidence of a change in the direction of a trend but less confirmation of its momentum than a signal line crossover
Divergence
Divergence is another signal created by the MACD . Simply, divergence occurs when the MACD and actual price are not in agreement. A "positive divergence" or "bullish divergence" occurs when the price makes a new low but the MACD does not confirm with a new low of its own. A "negative divergence" or "bearish divergence" occurs when the price makes a new high but the MACD does not confirm with a new high of its own. A divergence with respect to price may occur on the MACD line and/or the MACD Histogram
Moving Average Crossovers , another hidden signal that MACD Indicator identifies
Many traders will watch for a short-term moving average to cross above a longer-term moving average and use this to signal increasing upward momentum. This bullish crossover suggests that the price has recently been rising at a faster rate than it has in the past, so it is a common technical buy sign. Conversely, a short-term moving average crossing below a longer-term average is used to illustrate that the asset's price has been moving downward at a faster rate and that it may be a good time to sell.
Moving Average Crossovers in reality is Zero Line Crossovers, the value of the MACD indicator is equal to zero each time the two moving averages cross over each other. For easy interpretation by trades, Zero Line Crossovers are simply described as positive or negative MACD
False signals
Like any forecasting algorithm, the MACD can generate false signals. A false positive, for example, would be a bullish crossover followed by a sudden decline in a financial instrument. A false negative would be a situation where there is bearish crossover, yet the financial instrument accelerated suddenly upwards
What is “MACD-X” and Why it is “More Than MACD”
In its simples form, MACD-X implements variety of different calculation techniques applied to obtain MACD Line. Different calculation techniques lead to different values for MACD Line, as will further discuss below, and as a consequence the signal line and the histogram values will differentiate accordingly.
Main features of MACD-X ;
1- Plotting of the Oscillator presented on top of the price chart (main chart) and applicable on both log and linear scale. Maximum plotting length is limited to 250 bars
2- Introduces different proven techniques applied on MACD calculation, such as MACD-AS (Histogram), MACD-Leader and MACD-Source, besides the traditional MACD (MACD-TRADITIONAL)
• MACD-Traditional, by Gerald Appel
It is the MACD that we know, stated as traditional just to avoid confusion with other techniques used with this study
• MACD-Histogram, by Thomas Aspray
The MACD-Histogram measures the distance between MACD and its signal line (the 9-day EMA of MACD ). Aspray developed the MACD-Histogram to anticipate signal line crossovers in MACD . Because MACD uses moving averages and moving averages lag price, signal line crossovers can come late and affect the reward-to-risk ratio of a trade. Bullish or bearish divergences in the MACD-Histogram can alert chartists to an imminent signal line crossover in MACD
Aspray's contribution served as a way to anticipate (and therefore cut down on lag) possible MACD crossovers which are a fundamental part of the indicator.
• MACD-Leader, by Giorgos E. Siligardos, PhD
MACD Leader has the ability to lead MACD at critical situations. Almost all smoothing methods encounter in technical analysis are based on a relative-weighted sum of past prices, and the Leader is no exception. The concealed weights of MACD Leader are such that more relative weight is used in the more recent prices than the respective weights used by the components of MACD . In effect, the Leader expresses more changes in average price dynamics for the recent price movement than MACD , thus eventually leading MACD , especially when significant trend changes are about to take place.
• MACD-Source, a custom experimental interpretation of mine,
MACD Source, presents an application of MACD that evaluates Source/MA Ratio, relatively with less lag, as a basis for MACD Line, also can be expressed as source convergence/divergence to its moving average. Among the various techniques for removing the lag between price and moving average (MA) of the price, one in particular stands out: the addition to the moving average of a portion of the difference between the price and MA. MACD Source, is based on signal length mean of the difference between Source and average value of shot length and long length moving average of the source (Source/MA Ratio), where the source is actual value and hence no lag and relatively less lag with the average value of moving average of the source .
MACD Source provides relatively early crossovers comparing to MACD and better momentum direction indications, assuming the lengths are set to same values
3- Alerts presented for MACD and Signal Line Crosses both for Early Warning and Confirmed Crossovers
For more, You are kindly invited to have a look to other MACD or similar studies presented on separate pane
MACD-X, More Than MACD by DGT , P-MACD by DGT and Price Distance to its MA by DGT
Disclaimer : Trading success is all about following your trading strategy and the indicators should fit within your trading strategy, and not to be traded upon solely
The script is for informational and educational purposes only. Use of the script does not constitutes professional and/or financial advice. You alone the sole responsibility of evaluating the script output and risks associated with the use of the script. In exchange for using the script, you agree not to hold dgtrd TradingView user liable for any possible claim for damages arising from any decision you make based on use of the script

Volume Profile and Volume Indicator by DGTVolume Profile (also known as Price by Volume) is an charting study that displays trading activity over a specified time period at specific price levels. It is plotted as a horizontal histogram on the finacial isntrumnet's chart that highlights the trader's interest at specific price levels.
The histogram is used by traders to predict areas of support and resistance. Price levels where the traded volume is high could be assumed as support and resistance levels.
Price may experience difficulty moving above or below areas with large bars. Usually there is a great deal of activity on both the buy and sell side and the market stays at that price level for a great deal of time
It is advised to use volume profile in conjunction with other forms of technical analysis to maximize the odds of success
Light version of Volume Profile is added to Price Action - Support & Resistance by DGT

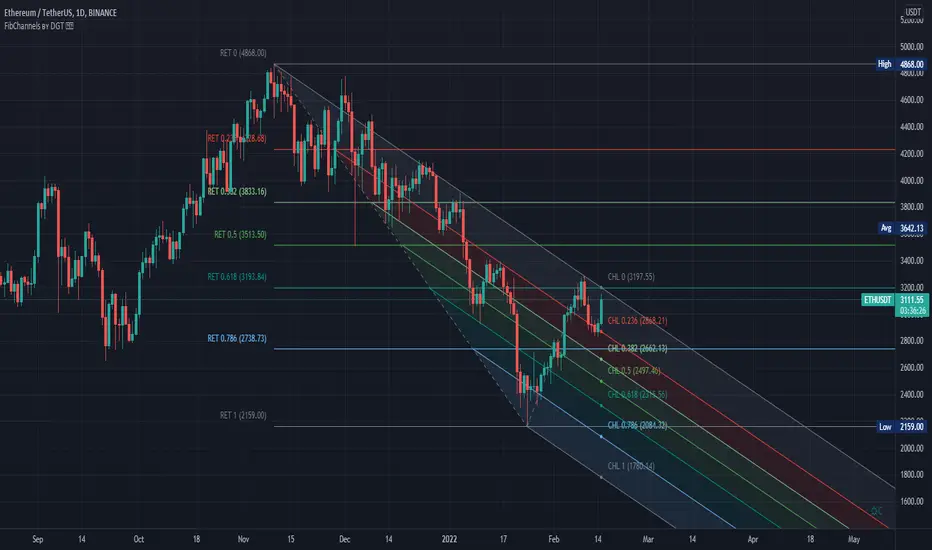
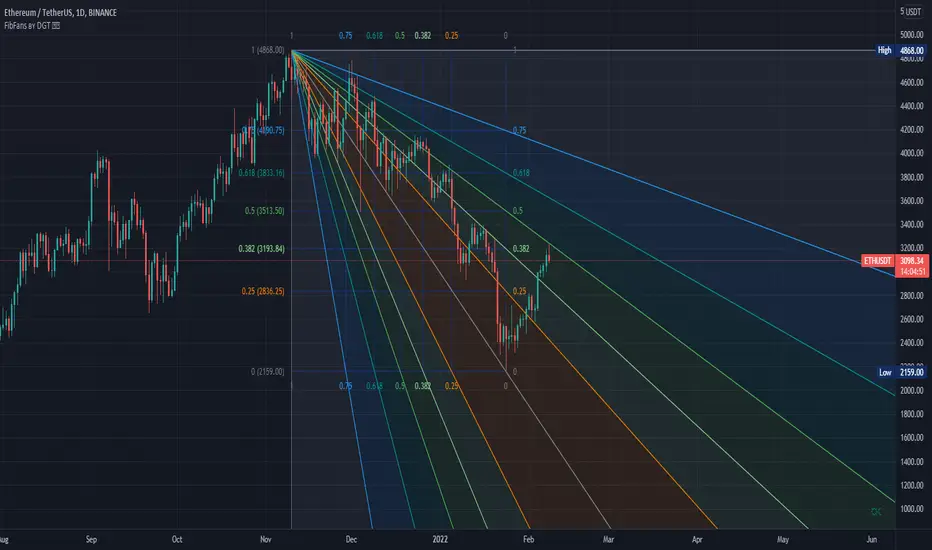
Auto Fib Time Zones and Trend-Based Fib Time by DGTFibonacci time zones, based on the Fibonacci number sequence, are vertical lines that represent potential areas where a swing high, low, or reversal could occur.
Trend-Based Fib Time shows probable price corrections in an existing trend. A useful tool to use in addition to Elliot Wave counting, Fib Time helps to identify how far the wave is likely to travel
Please note, Time zones aren't concerned with price, only time
Disclaimer :
Trading success is all about following your trading strategy and the indicators should fit within your trading strategy, and not to be traded upon solely
The script is for informational and educational purposes only. Use of the script does not constitute professional and/or financial advice. You alone have the sole responsibility of evaluating the script output and risks associated with the use of the script. In exchange for using the script, you agree not to hold dgtrd TradingView user liable for any possible claim for damages arising from any decision you make based on use of the script

Distance Oscillator - Support and Resistance by DGT
Prices high above the Moving Average (MA) or low below it are likely to be remedied in the future by a reverse price movement as stated in the article by Denis Alajbeg, Zoran Bubas and Dina Vasic published in International Journal of Economics, Commerce and Management
This study is the third variant that aims to present this idea, and the output of the study is presented as lines that serve as possible support and resistance levels in the future.
1st variant of the idea is presented as an centered oscillator, link to Price Distance to its MA Study , within its description you may find more about the idea and some statistical observations. Also some derivatives with MACD-X, More Than MACD and P-MACD
2nd variant of the idea are presented as colored triangle line (Volatility Colored Price/MA Line), using the same calculation methods and presented in the bottom of price chart.
Link to studies where it is included : Colored Directional Movement and Bollinger Band's Cloud , SuperTrendRange and Pivot Points vX
3rd variant (this study) as stated earlier aims to present the same idea as support and resistance levels.
Options
The users can adjust source and length of the moving average that is used as base for the distance oscillator
Signal triggering options includes length for the deviation bands, multiplier as well as smoothing of the oscillator
Line customization settings
Additionally an alert can be configured to be warned earlier to watch out for probable pullbacks or reversals
Technical details for whom interested
Calculating the price distance to the MA results in a centered oscillator lets call it Distance Oscillator (quite similar to the RSI), as shown in the blow chart
Unlike RSI, oscillations with the distance oscillator are not limited within a specific range, hence identifying overbought and oversold is not as straight forward as it is with RSI. To determine overbought and oversold levels, standard deviation of distance oscillator is calculated and bands generated with the same approach applied with Bollinger Bands.
Once we have the threshold bands then crossing those bands we may assume as important levels and draw a line, if oscillator values keeps above the threshold bands (deviation bands) the logic behind the code will update the line drawing accordingly.
To reduce noise a smoothing can be applied
Alerts :
Please note that the implementation applied here can be applied to any oscillator such as RSI, Stochastic, MFI etc even Volume (if bear candle volumes are multiplied by -1)
Disclaimer :
Trading success is all about following your trading strategy and the indicators should fit within your trading strategy, and not to be traded upon solely
The script is for informational and educational purposes only. Use of the script does not constitute professional and/or financial advice. You alone have the sole responsibility of evaluating the script output and risks associated with the use of the script. In exchange for using the script, you agree not to hold dgtrd TradingView user liable for any possible claim for damages arising from any decision you make based on use of the script
Sacred Geometry by DGTSacred geometry ascribes symbolic and sacred meanings to certain geometric shapes and certain geometric proportions. The study of sacred geometry has its roots in the study of nature, and the mathematical principles at work therein
In trading, using geometry for technical analysis is highly used concept, such as Gann Tools, Fibonacci Tools, Elliott Wave Theory are some examples that are based on the idea that the market is geometric and cyclical in nature
Thanks to @AtomOfScent's "almost like sacred geometry" comment to FibFans on Previous HTF HL
study give me the idea to go further and to demonstrate just how far we can go with this style of analysis. And here comes an experimental attempt to present some of sacred geometric shapes such as Seed of Life, Fruit of Life and Spiral, where the resulting image may help technical analysts to predict price changes.
Fruit of Life, example and how it is derived (maximum line limitation does not allow to draw all circles, so red circles are drawn manually to present the idea). Fruit of Life is base for the Metatron’s Cube and we can create all five Platonic Solids from it (Hexahedron, Tetrahedron, Octahedron, Icosahedron and Dodecahedron)
Spiral Examples :
Again special thanks to @AtomOfScent for commenting on the draft version of the study as well as providing valuable suggestions.
Disclaimer :
Trading success is all about following your trading strategy and the indicators should fit within your trading strategy, and not to be traded upon solely
The script is for informational and educational purposes only. Use of the script does not constitute professional and/or financial advice. You alone have the sole responsibility of evaluating the script output and risks associated with the use of the script. In exchange for using the script, you agree not to hold dgtrd TradingView user liable for any possible claim for damages arising from any decision you make based on use of the script
HTF Candles by DGThigher timeframe (multi timeframe) candles
a simple study introducing new pine function box.new

FibFans on Previous HTF HL [FaizanNawaz] by DGTFibonacci Fans application on top of Previous Higher TimeFrame High and Low. Idea owner is @faizannawaz1, special thanks to him for both the idea and tesing the application
WARNING : Study includes plottings in the future, and due to temporal gaps in non 7/24 markets such as weekends, holidays etc plotting of the fans will move to the open session (the effect will be observed on Friday and Monday). With crypto no any side affect will be observed.
More about Fibonacci Fans, how to apply fibonacci fans and automated fibonacci speed and resistance fans study
Adiitonally the study includes some addons, such as
Central Pivot Range and Traditional Pivot Points
Volume Weighted Colored Bars
Price Range Meter - Horizontal HTF Candle
Disclaimer :
Trading success is all about following your trading strategy and the indicators should fit within your trading strategy, and not to be traded upon solely
The script is for informational and educational purposes only. Use of the script does not constitute professional and/or financial advice. You alone have the sole responsibility of evaluating the script output and risks associated with the use of the script. In exchange for using the script, you agree not to hold dgtrd TradingView user liable for any possible claim for damages arising from any decision you make based on use of the script
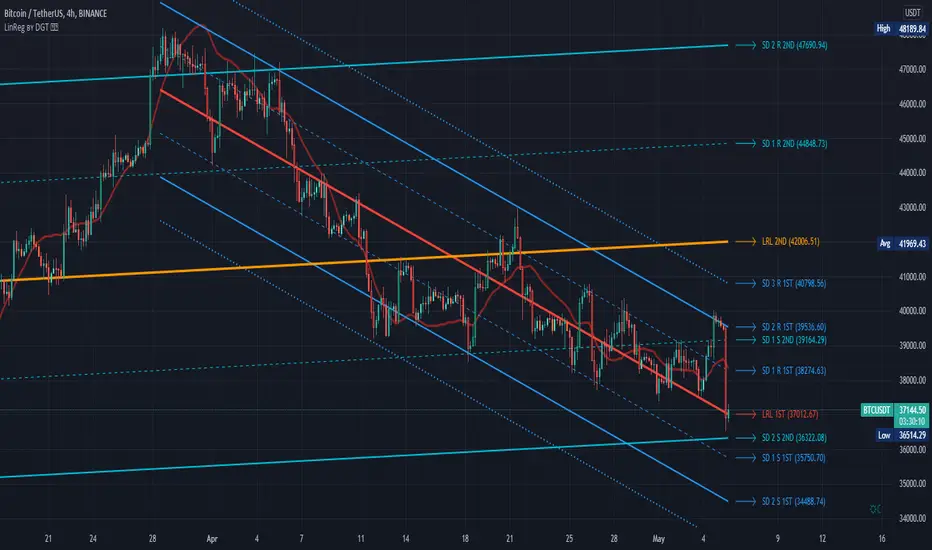
Raff Regression Channel by DGTRᴀꜰꜰ Rᴇɢʀᴇꜱꜱɪᴏɴ Cʜᴀɴɴᴇʟ (RRC)
This study aims to automate Raff Regression Channel drawing either based on ZigZag Indicator or optionally User Preference
The Raff Regression Channel , developed by Gilbert Raff, is based on a linear regression, which is the least-squares line-of-best-fit for a price series, with evenly spaced trend lines above and below . The width of the channel is set by determining the high or low that is the furthest from the linear regression.
Because the channel distance is based off the largest pullback or highest peak within a trend, for effectively drawing and using a Raff Regression Channel it is recommend/required that a Raff Regression Channel is applied to “mature” trends. Knowing this requirement, for better automated drawing results this study benefits from the Zig Zag Indicator, where the Zig Zag indicator is used to help identify price trends and changes in price trends. Option to manually adjust lengths for drawing a Raff Regression Channel is also made available.
Using a Raff Regression Channel
Once The Raff Regression Channel is drawn, covering an existing trend, Exᴛᴇɴꜱɪᴏɴ Lɪɴᴇꜱ are drawn to identify ᴛʜᴇ ꜱᴜᴘᴘᴏʀᴛ﹐ʀᴇꜱɪꜱᴛᴀɴᴄᴇ ᴏʀ ʀᴇᴠᴇʀꜱᴀʟ ᴘᴏɪɴᴛꜱ
The trend is up as long as prices rise within this channel. An uptrend may be reversing (not always, but likely) when price breaks below the channel extension . The trend is down as long as prices decline within the channel. Similarly, a downtrend may be reversing (not always, but likely) when price breaks above the channel extension . Moves outside the channel extensions can be indication of a reversal or can denote overbought or oversold conditions
For further details please refer to education post Raff Regression Channel
█ FEATURES
- AUTO or MANUALLY adjusted Raff Regression Channel and Channel Extentions drawing
- ALERTs, for Linear Regression Line, Raff Regression Upper and Lower Channel Extentions
- LSMA , Least Squares Moving Average, in other words Linear Regression Curve
█ SETTINGS
Setting Loopback and Number of Bars are the most important part for The Raff Regression Channel, where ;
- Lookback, defines where the Raff Regression Channel is starting, it is recommended to set to a trend begining
- Number of Bars, defines how many bars to be assumed for calculation, or simply stated the end of the Raff Regression Channel drawing (not extentions but the main channel, extentions by default will be drawn till the last bar)
Setting of Loopback and Number of Bars is performed eigher automatically based on Zig Zag indicator or users may prefer to set them manually. If selected automatically then
- Deviation and Depth values of Zig Zag indicator are used for calculations (enabling visually plotting of ZigZag Lines will help to identify better visually the points), where ;
Deviation, is a multiplier that affects how much the price should deviate from the previous pivot in order for the bar to become a new pivot.
Depth, affects the minimum number of bars that will be taken into account when building
Short-term traders may wish to apply the channel to small waves of a trend so they can reduce the value of the Deviation and Depth
█ OTHER CHANNEL CONSEPTS
Linear Regression Channels, , what linear regression channels are? and linear regression channel/curve/slope study
Fibonacci Channels, how to apply fibonacci channels and automated fibonacci channels study
Andrews’ Pitchfork, how to apply pitchfork and automated pitchfork study
Special Thanks to @Kiss66000 for his kind suggestion, je vous remercie beaucoup @Kiss66000
Disclaimer :
Trading success is all about following your trading strategy and the indicators should fit within your trading strategy, and not to be traded upon solely
The script is for informational and educational purposes only. Use of the script does not constitute professional and/or financial advice. You alone have the sole responsibility of evaluating the script output and risks associated with the use of the script. In exchange for using the script, you agree not to hold dgtrd TradingView user liable for any possible claim for damages arising from any decision you make based on use of the script
Auto PitchFan, Fib Extension/Retracement and ZigZag by DGT Aᴜᴛᴏ PɪᴛᴄʜFᴀɴ, Fɪʙ Exᴛᴇɴꜱɪᴏɴ/Rᴇᴛʀᴀᴄᴇᴍᴇɴᴛ ᴀɴᴅ ZɪɢZᴀɢ
This study aim to automate PitchFan drawing tool and combines it with Fibonacci Extentions/Retracements and ZigZag.
Common setting options, applied to all components of the study
Deviation , is a multiplier that affects how much the price should deviate from the previous pivot in order for the bar to become a new pivot. Increasing its value is one way to get higher timeframe Levels
Depth , affects the minimum number of bars that will be taken into account when building
Historical PitchFan / Fibonacci Levels option will allow plotting of PitchFan / Fibonacci Levels on previous Pivot Highs/Lows
█ PɪᴛᴄʜFᴀɴ — is a set of rays spreading out of the point of a trend's beginning. These rays inclined with the coefficients formed by a Fibonacci number sequence. It is recommended to adjust the Pitchfan plottings to fit after the first wave of the trend has passed and the correction has clearly begun.
PitchFan rays corresponding to Fibonacci levels appear on a chart and represent inclined lines of support and resistance. Price areas near these rays are estimated areas from which the price can turn around or make a significant rebound. The whole logic of working with a pitchfan is based on one simple idea - if the price has bounced off the level, then the correction is likely to end, and the trend will continue. If the price has broken the first resistance, you should wait for the next level test
- Automatically plots PitchFan Rays, based on Pivot Lows/Highs.
- Ability to set ALERTs for each PitchFan Ray Level
- PitchFan Labels displays the price of the line at the last bar, the price value will be recalculated in each new bar
Please check the link provided below with the educational post of how to apply pitchfork, application of pitchfan is same keeping in mind the recommendation stated above
█ Fɪʙ Rᴇᴛʀᴀᴄᴇᴍᴇɴᴛs / Exᴛᴇɴꜱɪᴏɴꜱ
Fibonacci retracements is a popular instrument used by technical analysts to determine support and resistance areas. In technical analysis, this tool is created by taking two extreme points (usually a peak and a trough) on the chart and dividing the vertical distance by the key Fibonacci coefficients equal to 23.6%, 38.2%, 50%, 61.8%, and 100%.
Fibonacci extensions are a tool that traders can use to establish profit targets or estimate how far a price may travel AFTER a retracement/pullback is finished. Extension levels are also possible areas where the price may reverse.
IMPORTANT NOTE: Fibonacci extensions option may require to do further adjustment of the study parameters for proper usage. Extensions are aimed to be used when a trend is present and they aim to measure how far a price may travel AFTER a retracement/pullback. I will strongly suggest users of this study to check the education post for further details where to use extensions and where to use retracements
- Automatically plots possible Support and Resistance levels, based on Pivot Lows/Highs.
- Ability to set ALERTs for each Fibonacci Extension/Retracement Level
- Labels displays the level and the level price
█ Zɪɢ Zᴀɢ — The Zig Zag indicator is used to help identify price trends and changes in price trends. The Zig Zag indicator plots points on a chart whenever prices reverse by a percentage greater than a Deviation variable. Straight lines are then drawn, connecting these points. The Zig Zag indicator serves base for PitchFan and Fibonacci Retracements / Extensions
█ OTHER
PitchFan is often used in combination with the other indicators and/or drawing tools such as Fibonacci Retracement, Fibonacci Channels, Fibonacci Time Zone and others. It allows identify the most powerful areas from which price can turn and to get more accurate trading signal
Andrews’ Pitchfork, how to apply pitchfork and automated pitchfork study
Fibonacci Fans, how to apply fibonacci fans and automated fibonacci speed and resistance fans study
Fibonacci Extension / Retracement, where to use extensions and where to use retracements and automated fibonacci extension / retracement / pivot points study
Others
Fibonacci Channels, how to apply fibonacci channels and automated fibonacci channels study
Linear Regression Channels, , what linear regression channels are? and linear regression channel/curve/slope study
Disclaimer :
Trading success is all about following your trading strategy and the indicators should fit within your trading strategy, and not to be traded upon solely
The script is for informational and educational purposes only. Use of the script does not constitute professional and/or financial advice. You alone have the sole responsibility of evaluating the script output and risks associated with the use of the script. In exchange for using the script, you agree not to hold dgtrd TradingView user liable for any possible claim for damages arising from any decision you make based on use of the script

Fibonacci Extension / Retracement / Pivot Points by DGTFɪʙᴏɴᴀᴄᴄɪ Exᴛᴇɴᴛɪᴏɴ / Rᴇᴛʀᴀᴄᴍᴇɴᴛ / Pɪᴠᴏᴛ Pᴏɪɴᴛꜱ
This study combines various Fibonacci concepts into one, and some basic volume and volatility indications
█ Pɪᴠᴏᴛ Pᴏɪɴᴛꜱ — is a technical indicator that is used to determine the levels at which price may face support or resistance. The Pivot Points indicator consists of a pivot point (PP) level and several support (S) and resistance (R) levels. PP, resistance and support values are calculated in different ways, depending on the type of the indicator, this study implements Fibonacci Pivot Points
The indicator resolution is set by the input of the Pivot Points TF (Timeframe). If the Pivot Points TF is set to AUTO (the default value), then the increased resolution is determined by the following algorithm:
for intraday resolutions up to and including 5 min, 4HOURS (4H) is used
for intraday resolutions more than 5 min and up to and including 45 min, DAY (1D) is used
for intraday resolutions more than 45 min and up to and including 4 hour, WEEK (1W) is used
for daily resolutions MONTH is used (1M)
for weekly resolutions, 3-MONTH (3M) is used
for monthly resolutions, 12-MONTH (12M) is used
If the Pivot Points TF is set to User Defined, users may choose any higher timeframe of their preference
█ Fɪʙ Rᴇᴛʀᴀᴄᴇᴍᴇɴᴛ — Fibonacci retracements is a popular instrument used by technical analysts to determine support and resistance areas. In technical analysis, this tool is created by taking two extreme points (usually a peak and a trough) on the chart and dividing the vertical distance by the key Fibonacci coefficients equal to 23.6%, 38.2%, 50%, 61.8%, and 100%. This study implements an automated method of identifying the pivot lows/highs and automatically draws horizontal lines that are used to determine possible support and resistance levels
█ Fɪʙᴏɴᴀᴄᴄɪ Exᴛᴇɴꜱɪᴏɴꜱ — Fibonacci extensions are a tool that traders can use to establish profit targets or estimate how far a price may travel AFTER a retracement/pullback is finished. Extension levels are also possible areas where the price may reverse. This study implements an automated method of identifying the pivot lows/highs and automatically draws horizontal lines that are used to determine possible support and resistance levels.
IMPORTANT NOTE: Fibonacci extensions option may require to do further adjustment of the study parameters for proper usage. Extensions are aimed to be used when a trend is present and they aim to measure how far a price may travel AFTER a retracement/pullback. I will strongly suggest users of this study to check the education post for further details, where to use extensions and where to use retracements
Important input options for both Fibonacci Extensions and Retracements
Deviation, is a multiplier that affects how much the price should deviate from the previous pivot in order for the bar to become a new pivot. Increasing its value is one way to get higher timeframe Fib Retracement Levels
Depth, affects the minimum number of bars that will be taken into account when building
█ Volume / Volatility Add-Ons
High Volatile Bar Indication
Volume Spike Bar Indication
Volume Weighted Colored Bars
This study benefits from build-in auto fib retracement tv study and modifications applied to get extentions and also to fit this combo
Disclaimer:
Trading success is all about following your trading strategy and the indicators should fit within your trading strategy, and not to be traded upon solely
The script is for informational and educational purposes only. Use of the script does not constitute professional and/or financial advice. You alone have the sole responsibility of evaluating the script output and risks associated with the use of the script. In exchange for using the script, you agree not to hold dgtrd TradingView user liable for any possible claim for damages arising from any decision you make based on use of the script

Linear Regression Channel / Curve / Slope by DGTTʜᴇ Lɪɴᴇᴀʀ Rᴇɢʀᴇꜱꜱɪᴏɴ Cʜᴀɴɴᴇʟꜱ
Linear Regression Channels are useful measure for technical and quantitative analysis in financial markets that help identifying trends and trend direction. The use of standard deviation gives traders ideas as to when prices are becoming overbought or oversold relative to the long term trend
The basis of a linear regression channel
Linear Regression Line – is a line drawn according to the least-squares statistical technique which produces a best-fit line that cuts through the middle of price action, a line that best fits all the data points of interest. The resulting fitted model can be used to summarize the data, to predict unobserved values from the same system. Linear Regression Line then present basis for the channel calculations
The linear regression channel
2. Upper Channel Line – A line that runs parallel to the Linear Regression Line and is usually one to two standard deviations above the Linear Regression Line.
3. Lower Channel Line – This line runs parallel to the Linear Regression Line and is usually one to two standard deviations below the Linear Regression Line.
Unlike Fibonacci Channels and Andrew’s Pitchfork, Linear Regression Channels are calculated using statistical methods, both for the regression line (as expressed above) and deviation channels. Upper and Lower channel lines are presenting the idea of bell curve method, also known as a normal distribution and are calculated using standard deviation function.
A standard deviation include 68% of the data points, two standard deviations include approximately 95% of the data points and any data point that appears outside two standard deviations is very rare.
It is often assumed that the data points will move back toward the average, or regress and channels would allow us to see when a security is overbought or oversold and ready to revert to the mean
please note : Over time, the price will move up and down, and the linear regression channel will experience changes as old prices fall off and new prices appear
█ Linear Regression Study Features
Linear Regression Channel
- Linear regression line as basis
- Customizable multiple channels based on Standard Deviation
- ALERTs for the channel levels
Linear Regression Curve
- Linear regression curve as basis
- Optional : Bands based on Standard Deviation or Volatility (ATR). Bands are applied with fixed levels 1, 2 and 3 times StdDev or ATR away from the curve
Linear Regression Slope
- Optional : Up/Down slope arrows for a used defined period
█ Volume / Volatility Add-Ons
High Volatile Bar Indication
Volume Spike Bar Indication
Volume Weighted Colored Bars
Auto Fib Channels by DGTThe Fibonacci Channel is a technical analysis tool that is used to estimate support and resistance levels based on the Fibonacci numbers. It is a variation of the Fibonacci retracement tool, except with the channel the lines run diagonally rather than horizontally.
This study will automatically place the channels where the levels indicate future areas of support and resistance
For further details please refer to education post
Nobody appears to know whether Fibonacci tools work because markets exhibit some form of natural pattern or because many investors use Fibonacci ratios to predict price movements, making them a self-fulfilling prophecy.
█ Study OPTIONS
Auto Fibonacci Channels , the main aim of the study
- Pivot threshold can be adjusted via “Deviation” and “Depth” input options
- Historical Channels / Retracements option will allow plotting of Channels on previous pivot high/lows
- Ability to set ALERTs for the Channel Levels
- Channel Labels displays the price of the line at the last bar, the price value will be updated in each new bar
Auto Fib Retracement – This is the build-in study of TradingView, customized to be in-line with Fibonacci Channels
- Pivot threshold can be adjusted via “Deviation” and “Depth” input options
- Historical Channels / Retracements option will allow plotting of Retracements on previous pivot high/lows
- Ability to set ALERTs for the Retracement Levels
Zig Zag – Derived from build-in Auto Fib Retracement with some customization options.
Disclaimer :
Trading success is all about following your trading strategy and the indicators should fit within your trading strategy, and not to be traded upon solely
The script is for informational and educational purposes only. Use of the script does not constitute professional and/or financial advice. You alone have the sole responsibility of evaluating the script output and risks associated with the use of the script. In exchange for using the script, you agree not to hold dgtrd TradingView user liable for any possible claim for damages arising from any decision you make based on use of the script
Auto Fib Speed Resistance Fans by DGTFibonacci Speed and Resistance Fan is an analytical drawing tool used to indicate the support and resistance levels of an existing trend and the price level at which possible changes in the trend may occur.
A Fibonacci Speed Resistance Fan consists of a trend line drawn between two extreme points - a trough and opposing peak or a peak and opposing trough - on which a set of sequential speed resistance lines are drawn above (which represents time) and below (which represents price). These lines are drawn based on time/price percentages of the distance between the beginning and the end of the trend line.
Speed resistance lines not only help to measure trend corrections but also measure the speed of a trend (the rate at which a trendline ascends or descends)
Traders can use the lines of the Fibonacci Speed and Resistance Fan to predict key points of resistance or support, at which they might expect price trends to reverse. Once a trader identifies patterns within a chart, they can use those patterns to predict future price movements and future levels of support and resistance. Traders use the predictions to time their trades. Key support and resistance levels tend to occur frequently at the 61.8-percent level on both uptrends and downtrends.
Please check for further details in the education post that I will share shortly after this publication :
Nobody appears to know whether Fibonacci tools work because markets exhibit some form of natural pattern or because many investors use Fibonacci ratios to predict price movements, making them a self-fulfilling prophecy.
█ Study OPTIONS
Auto Fibonacci Speed and Resistance Fan , the main aim of the study
- Pivot threshold can be adjusted via “Deviation” and “Depth” input options
- Historical Fans option will allow plotting of Speed and Resistance Fans on previous pivot high/lows
- Ability to set ALERTs for the Speed and Resistance Levels
- Price Grid Lines if extended it will result with Fib Retracement levels
- All lines, line levels are customizable, default values are set exactly to the same with the available Fib Speed and Resistance Fan drawing tool
Zig Zag – Derived from build-in Auto Fib Retracement with some customization options.
Example Usages :
Disclaimer :
Trading success is all about following your trading strategy and the indicators should fit within your trading strategy, and not to be traded upon solely
The script is for informational and educational purposes only. Use of the script does not constitute professional and/or financial advice. You alone have the sole responsibility of evaluating the script output and risks associated with the use of the script. In exchange for using the script, you agree not to hold dgtrd TradingView user liable for any possible claim for damages arising from any decision you make based on use of the script
Auto Pitchfork, Fib Retracement and Zig Zag by DGTPitchfork is a technical indicator for a quick and easy way for traders to identify possible levels of support and resistance of an asset's price. It is presents and based on the idea that the market is geometric and cyclical in nature
Developed by Alan Andrews, so sometimes called Andrews’ Pitchfork
It is created by placing three points at the end of previous trends
Schiff and Modified Pitchfork is a technical analysis tool derived from Andrews' Pitchfork
In general, traders will purchase the asset when the price falls near the support of either the center trendline or the lowest trendline. Conversely, they'll sell the asset when it approaches the resistance of either the center line or the highest trendline.
█ Study OPTIONS
Auto Pitchfork , the main aim of the study
Pivots threshold can be customized by “Deviation” and “Depth” input options
Pitchfork Type selection, available options Andrews' Pitchfork (Original), Schiff and Modified Pitchfork
Ability to set ALERTs for the Pitchfork Levels
Ability to add customized levels (all level lines customizable)
Auto Fib Retracement – This is the build-in study of TradingView, slight changes applied to fit with Auto Pitchfork
Zig Zag – Derived from build-in Auto Fib Retracement with some customization options.
█ Usage Tips :
Andrews' Pitchfork (Original) best fit in a Strong Trending Market
Schiff and Modified Pitchfork better with Correcting or Sideways Market. Modified Pitchfork is almost identical to a Parallel Chanel
Disclaimer :
Trading success is all about following your trading strategy and the indicators should fit within your trading strategy, and not to be traded upon solely
The script is for informational and educational purposes only. Use of the script does not constitute professional and/or financial advice. You alone have the sole responsibility of evaluating the script output and risks associated with the use of the script. In exchange for using the script, you agree not to hold dgtrd TradingView user liable for any possible claim for damages arising from any decision you make based on use of the script

RSI Support & Resistance by DGTRSI Sᴜᴘᴘᴏʀᴛ & Rᴇꜱɪꜱᴛᴀɴᴄᴇ ʙʏ DGT
This experimental study attempts to translate Relative Strength Index (RSI) threshold levels of oversold/overbought and bull/bear zones as probable Price Support and Resistance levels
█ OPTIONS
Support & Resistance Levels , the main aim of the study. Level calculations are based on Relative Strength Index (RSI) threshold levels of oversold/overbought and bull/bear zones, where all threshold values are customizable through the user dialog box. Background of the levels can be colored optionally
RSI Weighted Colored Bars and/or Mark Overbought/Oversold Bars , Bar colors can be painted to better emphasis RSI values. Darker colors when the oscillator is in oversold/overbought zones, light colors when oscillator readings are below/above the bull/bear zone respectively, and remain unchanged otherwise. Besides the colors, with “Display RSI Overbought/Oversold Price Bars” option little triangle shapes can be plotted on top or bottom of the bars when RSI is in oversold/overbought zones
Example usage of the study with explanations
█ OTHERS
More regarding Support & Resistance concept (definition, identifying levels, trading S&R, etc) you are kindly invited to check my previous publication
Price Action - Support & Resistance by DGT
More regarding Relative Strength Index (RSI) and Relative Strength of Volume Indicators , please check Relative Strength of Volume Indicators by DGT
Disclaimer:
Trading success is all about following your trading strategy and the indicators should fit within your trading strategy, and not to be traded upon solely
The script is for informational and educational purposes only. Use of the script does not constitute professional and/or financial advice. You alone have the sole responsibility of evaluating the script output and risks associated with the use of the script. In exchange for using the script, you agree not to hold dgtrd TradingView user liable for any possible claim for damages arising from any decision you make based on use of the script

Medium Term Weighted Stochastic (STPMT) by DGTLa Stochastique Pondérée Moyen Terme (STPMT) , or Mᴇᴅɪᴜᴍ Tᴇʀᴍ Wᴇɪɢʜᴛᴇᴅ Sᴛᴏᴄʜᴀꜱᴛɪᴄꜱ created by Eric Lefort in 1999, a French trader and author of trading books
█ The STPMT indicator is a tool which concerns itself with both the direction and the timing of the market. The STPMT indicator helps the trader with:
The general trend by observing the level around which the indicator oscillates
The changes of direction in the market
The timing to open or close a position by observing the oscillations and by observing the relative position of the STPMT versus its moving average
STPMT Calculation
stpmt = (4,1 * stoch(5, 3) + 2,5 * stoch(14, 3) + stoch(45, 14) + 4 * stoch(75, 20)) / 11.6
Where the first argument of the stoch function representation above is period (length) of K and second argument smoothing period of K. The result series is then plotted as red line and its moving average as blue line. By default disabled gray lines are the components of the STPMT
The oscillations of the STPMT around its moving average define the timing to open a position as crossing of STMP line and moving average line in case when both trends have same direction. The moving average determines the direction.
Long examples
█ Tʜᴇ CYCLE Iɴᴅɪᴄᴀᴛᴏʀ is derived from the STPMT. It is
cycle = stpmt – stpmt moving average
It is indicates more clearly all buy and sell opportunities. On the other hand it does not give any information on market direction. The Cycle indicator is a great help in timing as it allows the trader to more easily see the median length of an oscillation around the average point. In this way the traders can simply use the time axis to identify both a favorable price and a favorable moment. The Cycle Indicator is presented as histogram
The Lefort indicators are not a trading strategy. They are tools for different purposes which can be combined and which can serve for trading all instruments (stocks, market indices, forex, commodities…) in a variety of time frames. Hence they can be used for both day trading and swing trading.
👉 For whom that would like simple version of the Cycle indicator on top of the main price chart with signals as presented below.
Please note that in the following code STMP moving average direction is not considered and will plot signals regardless of the direction of STMP moving average. It is not a non-repainting version too.
here is pine code for the overlay version
// © dgtrd
//@version=4
study("Medium Term Weighted Stochastic (STPMT) by DGT", "STPMT ʙʏ DGT ☼☾", true, format.price, 2, resolution="")
i_maLen = input(9 , "Stoch MA Length", minval=1)
i_periodK1 = input(5 , "K1" , minval=1)
i_smoothK1 = input(3 , "Smooth K1", minval=1)
i_weightK1 = input(4.1 , "Weight K1", minval=1, step=.1)
i_periodK2 = input(14 , "K2" , minval=1)
i_smoothK2 = input(3 , "Smooth K2", minval=1)
i_weightK2 = input(2.5 , "Weight K2", minval=1, step=.1)
i_periodK3 = input(45 , "K3" , minval=1)
i_smoothK3 = input(14 , "Smooth K3", minval=1)
i_weightK3 = input(1. , "Weight K3", minval=1, step=.1)
i_periodK4 = input(75 , "K4" , minval=1)
i_smoothK4 = input(20 , "Smooth K4", minval=1)
i_weightK4 = input(4. , "Weight K4", minval=1, step=.1)
i_data = input(false, "Components of the STPMT")
//------------------------------------------------------------------------------
// stochastic function
f_stoch(_periodK, _smoothK) => sma(stoch(close, high, low, _periodK), _smoothK)
//------------------------------------------------------------------------------
// calculations
// La Stochastique Pondérée Moyen Terme (STPMT) or Medium Term Weighted Stochastics calculation
stpmt = (i_weightK1 * f_stoch(i_periodK1, i_smoothK1) + i_weightK2 * f_stoch(i_periodK2, i_smoothK2) + i_weightK3 * f_stoch(i_periodK3, i_smoothK3) + i_weightK4 * f_stoch(i_periodK4, i_smoothK4)) / (i_weightK1 + i_weightK2 + i_weightK3 + i_weightK4)
stpmt_ma = sma(stpmt, i_maLen) // STPMT Moving Average
cycle = stpmt - stpmt_ma // Cycle Indicator
//------------------------------------------------------------------------------
// plotting
plotarrow(change(sign(cycle)), "STPMT Signals", color.green, color.red, 0, maxheight=41)
alertcondition(cross(cycle, 0), title="Trading Opportunity", message="STPMT Cycle : Probable Trade Opportunity {{exchange}}:{{ticker}}-> Price = {{close}}, Time = {{time}}")

Price Action - Support & Resistance by DGTSᴜᴘᴘᴏʀᴛ ᴀɴᴅ Rᴇꜱɪꜱᴛᴀɴᴄᴇ , is undoubtedly one of the key concepts of technical analysis
█ Sᴜᴘᴘᴏʀᴛ ᴀɴᴅ Rᴇꜱɪꜱᴛᴀɴᴄᴇ Dᴇꜰɪɴɪᴛɪᴏɴ
Support and Resistance terms are used by traders to refer to price levels on charts that tend to act as barriers, preventing the price of an financial instrument from getting pushed in a certain direction.
A support level is a price level where buyers are more aggressive than sellers. This means that the price is more likely to "bounce" off this level rather than break through it. However, once the price has breached this level it is likely to continue falling until meeting another support level.
A resistance level is the opposite of a support level. It is where the price tends to find resistance as it rises. Again, this means that the price is more likely to "bounce" off this level rather than break through it. However, once the price has breached this level it is likely to continue rising until meeting another resistance level.
A previous support level will sometimes become a resistance level when the price attempts to move back up, and conversely, a resistance level will become a support level as the price temporarily falls back.
█ Iᴅᴇɴᴛɪꜰʏɪɴɢ Sᴜᴘᴘᴏʀᴛ ᴀɴᴅ Rᴇꜱɪꜱᴛᴀɴᴄᴇ
Support and resistance can come in various forms, and the concept is more difficult to master than it first appears. Identification of key support and resistance levels is an essential ingredient to successful technical analysis.
If the price stalls and reverses in the same price area on minimum of two different occasions, then a horizontal line is drawn to show that the market is struggling to move past that area. Those areas are static barriers, one of the most popular forms of support/resistance and are highlighted with horizontal lines.
Repeated test , the more often a support/resistance level is "tested" over an extended period of time (touched and bounced off by price), the more significance is given to that specific level
High volume , the more buying and selling that has occurred at a particular price level, the stronger the support or resistance level is likely to be
Market psychology , plays a major role as traders and investors remember the past and react to changing conditions to anticipate future market movement.
Psychological levels , is a price level that significantly affects the price of an underlying financial instrument. Typically, near round numbers often serve as support and resistance
The following support and resistance related topics are beyond the scope of this study, so they will be mentioned roughly only as a reference for support and resistance concept
Trendlines , Support and resistance levels in trends are dynamic. Throughout an uptrend, levels of support tend to look like a trendline, usually clustering around higher lows. As the price rises, the price where buyers consider the stock to be “too cheap” also changes, which creates new support levels on the way up. The same is also true for resistance levels. In an uptrend, a stock is continuously breaking through perceived resistance levels and making new highs
Moving Averages , is a constantly changing line that smooths out past price data while also allowing the trader to identify support and resistance. In the example Notice how the price of the asset finds support at the moving average when the trend is up, and how it acts as resistance when the trend is down
The Fibonacci Retracement/Extension tool , is a favorite among many short-term traders because it clearly identifies levels of potential support and resistance
Pivot Point Calculations , is another common technical analysis technique, where pivot point is calculated based on the high, low, and closing prices of previous trading session/day and support & resistance levels are projected based on the pivot point, different calculation techniques are available, as presented in this example of an pivot point indicator : PVTvX by DGT
█ Tʀᴀᴅɪɴɢ Bᴀꜱᴇᴅ ᴏɴ Sᴜᴘᴘᴏʀᴛ ᴀɴᴅ Rᴇꜱɪꜱᴛᴀɴᴄᴇ
Once an area or "zone" of support or resistance has been identified, those price levels can serve as potential entry or exit points because, as a price reaches a point of support or resistance, it will do one of two things—bounce back away from the support or resistance level (trading ranges), or violate the price level and continue in its direction (trading breakouts) —until it hits the next support or resistance level
The basic trading method for using support and resistance is to buy near support in uptrends or the parts of ranges or chart patterns where prices are moving up and to sell/sell short near resistance in downtrends or the parts of ranges and chart patterns where prices are moving down. Buying near support or selling near resistance can pay off, but there is no assurance that the support or resistance will hold. Therefore, consider waiting for some confirmation that the market is still respecting that area
Trading breakouts, a breakout is a potential trading opportunity that occurs when an asset's price moves above a resistance level or moves below a support level on increasing volume. The first step in trading breakouts is to identify current price trend patterns along with support and resistance levels in order to plan possible entry and exit points. Once the asset trades beyond the price barrier, volatility tends to increase and prices usually trend in the breakout's direction. Breakouts are such an important trading strategy since these setups are the starting point for future volatility increases, large price swings and, in many circumstances, major price trends. When trading breakouts, it is important to consider the underlying asset's support and resistance levels. The more times an asset price has touched these areas, the more valid these levels are and the more important they become. At the same time, the longer these support and resistance levels have been in play, the better the outcome when the asset price finally breaks out. Asset prices will often move slightly further than we expect them to. This doesn't happen all the time, but when it does it is called a false breakout. Therefore it is important to consider waiting for some confirmation while trading breakouts. It’s also popular for traders to sell 50% of their positions at the resistance level, and hold the rest in anticipation of a breakout above resistance
█ Pʀɪᴄᴇ Aᴄᴛɪᴏɴ - Sᴜᴘᴘᴏʀᴛ & Rᴇꜱɪꜱᴛᴀɴᴄᴇ ʙʏ DGT Sᴛᴜᴅʏ
This experimental study attempts to identify the support and resistance levels. Assumes a simple logic to discover moments where the price is rising or falling consecutively for minimum 3 bars with the condition volume increases on each bar and the last bar’s volume should be bigger than the long term volume moving average. A line will be drawn at the end of the move (highest or lowest, depending on the move direction), the line will be drawn at minimum on the 3rd bar and if condition holds for other consecutive bars the line will switch to 4th, 5th etc bar.
Lines will not be deleted so the historical ones will remain and will emphasis the levels significance when they overlap in feature. Strong levels are more likely to hold and cause the price to move in the other direction, whereas the minor levels may only cause the price to pause and keep moving in the same direction. Determining future levels of support and resistance can drastically improve the returns of a short-term investing strategy
Bar colors will be painted based on the volume of the specific bar to its long term volume moving average. This will help identifying the support and resistance levels significance and emphasis the sings of breakouts
Finally, Volume spikes will be marked on top of the price chart. A high volume usually indicates more interest in the security and the presence of institutional traders. However, a rapidly rising price in an uptrend accompanied by a huge volume may be a sign of exhaustion. Traders usually look for breaks of support and resistance to enter positions. When security break critical levels without volume , you should consider the breakout suspect and prime for a reversal off the highs/lows. Volume spikes are often the result of news-driven events. Volume spike will often lead to sharp reversals since the moves are unsustainable due to the imbalance of supply and demand
A good example with many support and resistance concepts observed on a stock chart and detected by the study
Settings:
Length of volume moving average, where volume moving average is used to detect support and resistance levels, is used as reference to compare with threshold values for volume spikes and colors of the bars
Hint, to get more historical lines scrolling chart to left will enable visualization of them. Please note they may appear to much all 500 line limit is used 😉
Special thanks to @HEMANT Telegram user, for his observations and suggestions
Disclaimer:
Trading success is all about following your trading strategy and the indicators should fit within your trading strategy, and not to be traded upon solely
The script is for informational and educational purposes only. Use of the script does not constitute professional and/or financial advice. You alone have the sole responsibility of evaluating the script output and risks associated with the use of the script. In exchange for using the script, you agree not to hold dgtrd TradingView user liable for any possible claim for damages arising from any decision you make based on use of the script

Analog/Digital World Clock by DGTWorld Clocks - something for fun
Happy New Year!
ps: in case no update on the charts then the clock will not update too and will lag or stop till a new update is received

Logistic RSI, STOCH, ROC, AO, ... by DGTExperimental attemt of applying Logistic Map Equation for some of widly used indicators.
With this study "Awesome Oscillator (AO)", "Rate of Change (ROC)", "Relative Strength Index (RSI)", "Stochastic (STOCH)" and a custom interpretation of Logistic Map Equation is presented
Calculations with Logistic Map Equation makes sense when the calculated results are iterated many times within the same equation.
Here is the Logistic Map Equation : Xn+1 = r * Xn * (1 - Xn)
Where, the value of r is the key for this equation which changes amazingly the behaviour of the Logistic Map.
The value we have asigned for r is less then 1 and greater than 0 ( 0 < r < 1) and in this case the iterations performed with the maximum number of output series allowed by Pine is quite enough for our purpose and thanks to arrays we can easiliy store them for further processing
What we have as output:
Each iteration result is then plotted (excluding plotting the first iteration), as circles or line based on user preference
Values above and below zero level (0) are coloured differently to emphasis bull and bear power
Finally Standard Deviation of Array's Elements is ploted as line. Users may choose to display this line only
So where it comes the indicators "Awesome Oscillator (AO)", "Rate of Change (ROC)", "Relative Strength Index (RSI)", "Stochastic (STOCH)".
Those are the indicators whose values are assigned to our key varaiable in the Logistic Map equation forulma which is r
Further details regarding Logistic Map can found under the description of “Logistic EMA w/ Signals by DGT” study
Disclaimer:
Trading success is all about following your trading strategy and the indicators should fit within your trading strategy, and not to be traded upon solely
The script is for informational and educational purposes only. Use of the script does not constitute professional and/or financial advice. You alone have the sole responsibility of evaluating the script output and risks associated with the use of the script. In exchange for using the script, you agree not to hold dgtrd TradingView user liable for any possible claim for damages arising from any decision you make based on use of the script

SuperTrendRange by DGTSuperTrendRange study attempts to determine the state of the market
• whether a well-established bull/bear trend is present
• whether the market is trading in a range
SuperTrendRange (STR) takes into account the volatility of the market - further details regarding volatility can be found in the description of “Volatility Bands by DGT” study
Due to its similarities to SupertTrend (ST) and Parabolic SAR (SAR), I will try to explain by stating differences between them
SuperTrendRange uses both the ATR (Average True Range) and STDEV (Standard Deviation) as part of its calculations - unlike ST and SAR where they use only ATR
Sensitivity of the indicator is adjusted using the multiplier setting of both ATR and STDEV
Additionally, unlike ST, the source of the basis of SuperTrendRange can be selected among the assets price value or its moving average
Source and Length are adjustable too
The SuperTrendRange, like Parabolic SAR indicator, appears on a chart as a series of dots, either above, below or unlike Parabolic SAR both above and below of the asset's price
A dot placed
- below the price when the market is trending upward
- above the price when it is trending downward
- both above and below when the price starts moving sideways – this is a feature that both SuperTrend and Parabolic SAR misses, where they are known to produce false signals and losing trades, whereas SuperTrendRange emphasis the zones of the ranges occurring and in most cases are considered no trade recommended zones. Please note that the range width may vary depending on how the market is volatile. It is up to the users to trade if it fits their trading strategies
Dots plotted above and below can be assumed as Support and Resistance levels
Example usages – with trading opportunities
Gold Monthly Chart
Bitcoin Daily Chart
Disclaimer:
Trading success is all about following your trading strategy and the indicators should fit within your trading strategy, and not to be traded upon solely
The script is for informational and educational purposes only. Use of the script does not constitute professional and/or financial advice. You alone have the sole responsibility of evaluating the script output and risks associated with the use of the script. In exchange for using the script, you agree not to hold dgtrd TradingView user liable for any possible claim for damages arising from any decision you make based on use of the script
