Breakout LabelsThis script labels the highest price of the lowest candle over a period of time. It then labels any bullish breakouts where the close price is higher than the high of the lowest candle.
Dips

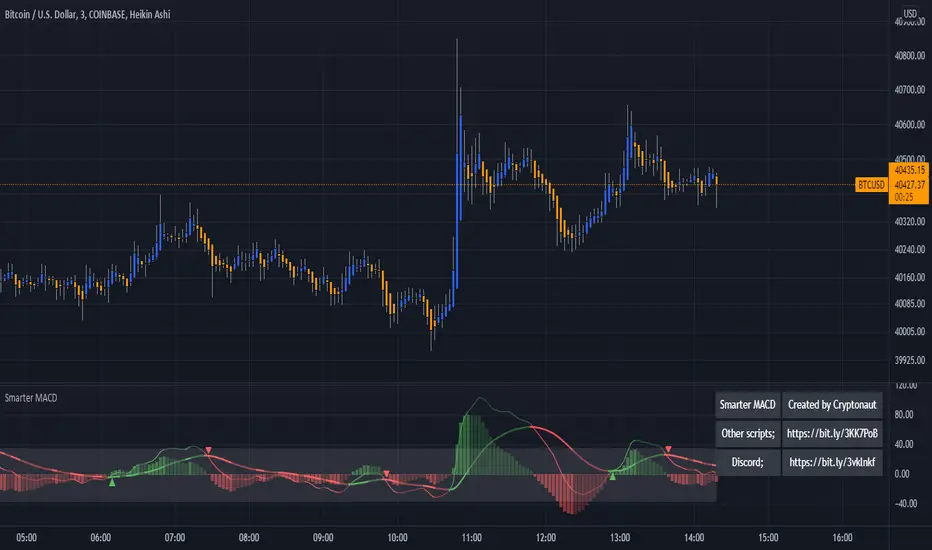
Smarter MACDA classic MACD with average peak and dip lines. The lighter green and red horizontal lines are the average peak and dip of the entire span, respectively. The second, bolder of the two lines are the averages of the peaks and dips above and below the overall peak and dip averages. The filled in color is to help visualize these averages and possible trade setups. Rework of the MACD + Averages script.
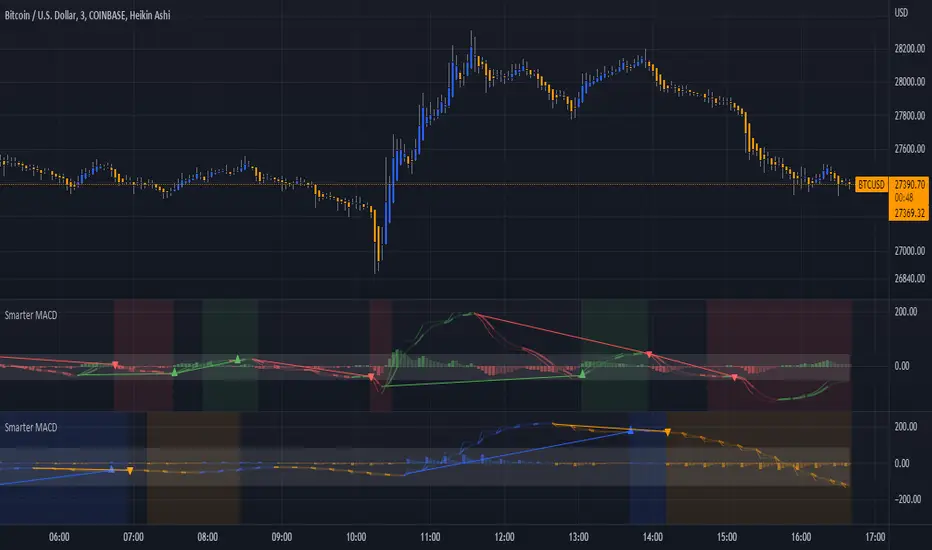
MACD + AveragesA classic MACD with average peak and dip lines. The lighter green and red horizontal lines are the average peak and dip of the entire span, respectively. The second, bolder of the two lines are the averages of the peaks and dips above and below the overall peak and dip averages. The filled in color is to help visualize these averages and possible trade setups.