Natural Directional Combo [CC]The Natural Directional Combo was created by Jim Sloman as part of his Ocean theory series and I believe this is his final unique formula that I'm publishing to make them all open source. If you know of any others then please send me a message. He passed away at a young age and I want to make sure his legacy lives on. Big thanks to @altcoinz and @tmac87 for giving me his full source code and materials in order to publish everything. So like my Natural Market Combo script, this essentially take his Natural Stochastic Indicator and his Natural Directional Index to create his own average of both indicators. Like the market combo indicator, I created a fix to address the errors in his original script and included both strong and normal buy and sell signals. Strong signals are darker in color and normal signals are lighter in color. Buy when the line turns green and sell when it turns red.
Let me know if there are any other scripts you would like to see me publish!
Direction

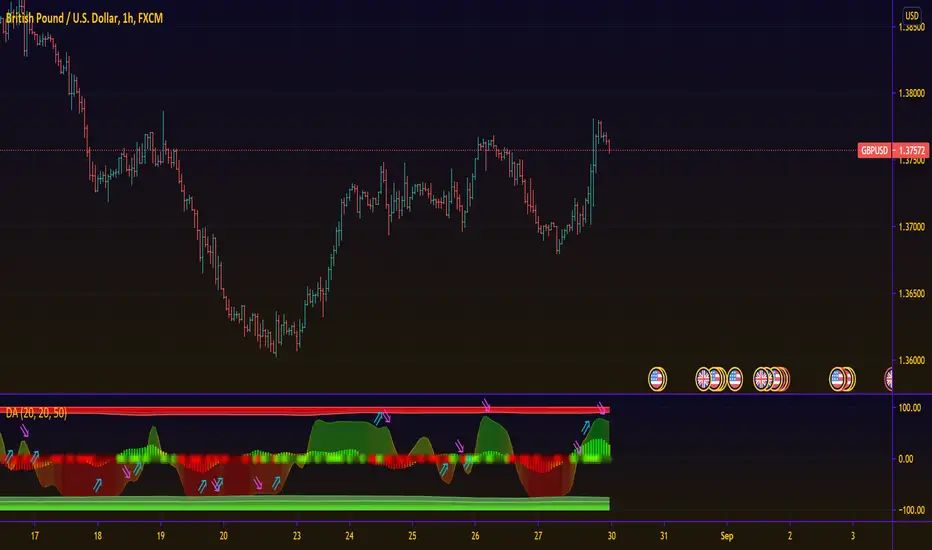
Directional AnalyzerThis script attempts to equip users with the necessary information about the direction of an instrument, and essentially it is a synergy of 3 algorithms.
The first algorithm (plotted as dots at level 0) studies the balance of delta volatility that constitutes the current bar and answers if bulls or bears are in control at that exact bar time
The second algorithm (plotted as an area) studies the development of delta volatility over the defined period by means of a polynomial regression. Effectively, it provides an overall picture of the trend strength.
The third algorithm (plotted as a line with arrow labels) utilizes simple elements of neural network in conjunction with some custom filters to predict the focal point that a trend will reverse its direction. This is predictive in nature, hence always adopt this with caution. While the labels display the predicted direction, the colors of the line also reflect the state of the current bar as well, adding to the confirmation of the first algorithm.
May you be on the right side of the trade.
Natural Directional Index [CC]The Natural Directional Index was created by Jim Sloman and this is another indicator that I'm publishing from the collection of Ocean indicators. I want to make sure his legacy is covered by as many eyes as possible. This is his version of the directional index indicator but he uses his weighting method to use the square root of time and you can see that the signals are very smooth. Big thanks of course to @altcoinz and @tmac87 for helping me get the full source code and files for all of his work. This indicator captures the current trend and I have used my strong buy and sell signals to let you know the strength of the current trend. Darker colors are for strong signals and lighter colors are for normal ones. Buy when the line turns green and sell when it turns red.
Let me know if there are any other indicators you would like to see me publish!

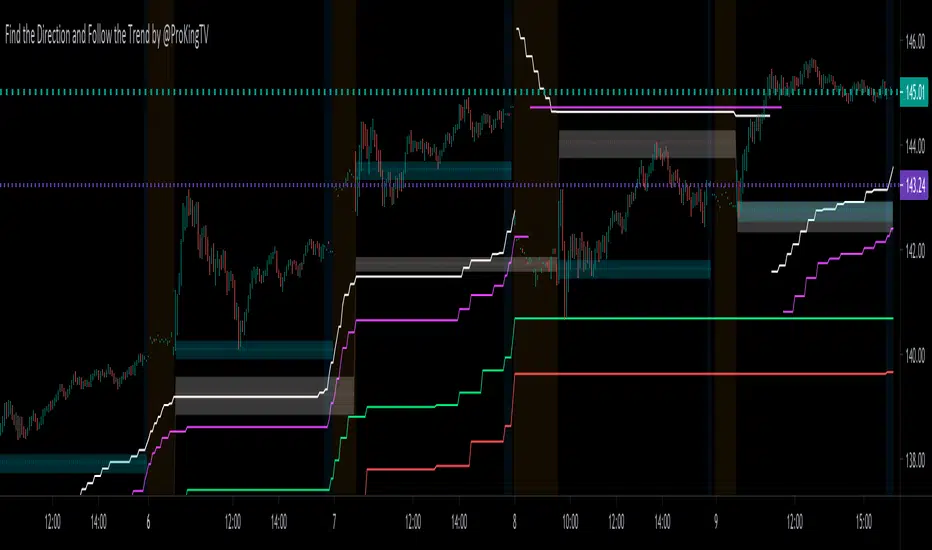
Pro Algo: Find the Direction and Follow the Trend
Find direction is the key to success for all traders. This script can find the direction and Opening Range. All you need to do is follow the direction and the trend generated from this script. It can be used for day trading and swing trading on all time frames. It generates short-trend, medium-trend and long-trend lines with no repaint and no lagging. It also generates Support/Resistance (S/R) area for Day-time and 24 hours time-frame.
How does it work?
* Defines all support/resistance (S/R) levels based on floor trader’s pivot points and my own S/R levels.
* Calculates the trend/reversal signals, price reactions close to all above S/R levels.
* Generates short-trend, middle-trend and long-trend line based on all combined factors and directions.
What are the signals?
* Pink line are short-trend line
* Green line are short-trend line
* Red line are short-trend
* Deep green area is S/R Opening Range for day-time, which can be used as Open Range Breakout
*
How to use?
* Find the Opening Range(green area)
* Follow the direction of Pink/Green/Red lines
* Trade in the same direction of opening range breakout and the direction of trend(Pink/Green/Red lines)
* It works on all time-frames from 1 min, 2 min, 3 min to 4 hours chart.
* The trend lines will not change, i.e trend lines will be same for all time frames
* There is no way to filter all noises even with higher time frame, all the trades must have a stop Or Reversal the direction once the trend is changed.
* These trend lines provide excellent support and resistances levels.
How to access?
* PM me (ProKingTV) to obtain access
* 10 days Free Trial is available

Volatility OscillatorThis tool displays relative volatility and directional trend. Excellent way to pickup diversions and reversals. Length can be lowered to 11 or 13 in settings to show price range.
Can be used to identify patterns such as parallel channels and likely direction of price action as pictured below.

binary angelMeasure angles of many indicators and create score base on this information, it can be use as helper for direction decision in binary option or classic trading

Trend Type Indicator by BobRivera990Usage:
The purpose of this indicator is to programmatically determine the type of price trend using technical analysis tools.
You can do a quick check on the asset’s higher and lower time frames. For example, if you are trading on an H1 chart, you can check the m5 chart to ensure that the trend is in the same direction and similarly check the H4 chart to ensure that the higher time frame price is also moving in the same direction.
If multiple time frame charts confirm a similar trend, then it is considered a very strong trend and ideal for Trend trading.
Remarks:
By default, the last status is related to 8 periods before the latest closing price.
Related definitions:
The three basic types of trends are up, down, and sideways.
1. Uptrend
An uptrend describes the price movement of a financial asset when the overall direction is upward. The uptrend is composed of higher swing lows and higher swing highs.
Some market participants ("long" trend traders) only choose to trade during uptrends.
2. Downtrend
A downtrend refers to the price action of a security that moves lower in price as it fluctuates over time.
The downtrend is composed of lower swing lows and lower swing highs.
3. Sideways
A sideways trend is the horizontal price movement that occurs when the forces of supply and demand are nearly equal. This typically occurs during a period of consolidation before the price continues a prior trend or reverses into a new trend.
How it works:
Step 1: Sideways Trend Detection
In this step we want to distinguish the sideways trend from uptrend and downtrend. For this purpose, we use two common technical analysis tools: ATR and ADX
1. Average True Range (ATR)
The average true range (ATR) is a technical analysis indicator that measures market volatility.
We also use a 20-period moving average of the ATR.
When the ATR is below the average of its last 20-periods, it means that the rate of price volatility has decreased and we conclude that the current trend is sideways
2. Average Directional Index (ADX)
The average directional index (ADX) is a technical analysis indicator used by some traders to determine the strength of a trend.
The trend has strength when ADX is above 25.
So when the ADX is less than or equal to 25, there is no strong trend, and we conclude that the current type of trend is sideways.
Step 2: Detect uptrend from downtrend
If it turns out that the current price trend is not sideways, then it is either uptrend or downtrend.
For this purpose, we use plus and minus directional Indicators (+ DI & -DI).
A general interpretation would be that during a strong trend, when +DI is higher than -DI, it is an uptrend. When -DI is higher than +DI, it is a downtrend.
Parameters:
"Use ATR …" ________________________// Use Average True Range (ATR) to detect Sideways Movements
"ATR Length"_______________________ // length of the Average True Range (ATR) used to detect Sideways Movements
"ATR Moving Average Type" ___________// Type of the moving average of the ATR used to detect Sideways Movements
"ATR MA Length" ____________________// length of the moving average of the ATR used to detect Sideways Movements
"Use ADX ..."_______________________ // Use Average Directional Index (ADX) to detect Sideways Movements
"ADX Smoothing”____________________// length of the Average Directional Index (ADX) used to detect Sideways Movements
"DI Length"_________________________// length of the Plus and Minus Directional Indicators (+DI & -DI) used to determine the direction of the trend
"ADX Limit" ________________________// A level of ADX used as the boundary between Trend Market and Sideways Market
"Smoothing Factor"__________________// Factor used for smoothing the oscillator
"Lag"______________________________// lag used to match indicator and chart
Resources:
www.investopedia.com

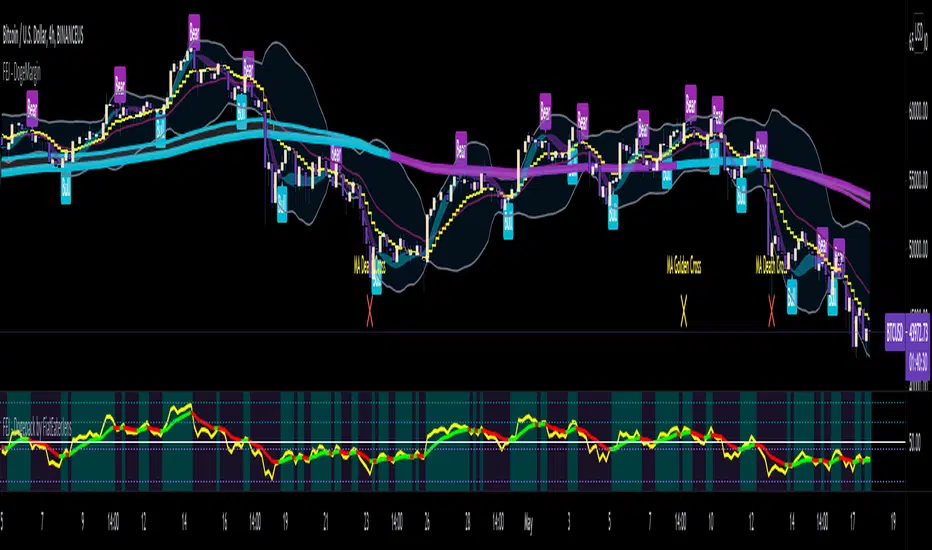
FAJ Dogepack Combines EMA + RSI indicator
Dieses Script ist eine einfache Kombination aus RSI und EMA.
Es erlaubt euch zu erkennen in welche Richtung der Trend in dem aktuellen
TimeFrame geht und wie stark dieser aktuell ist.
Außerdem zeigt es euch ob gerade eher die Bullen oder die Bären den Markt
dominieren. Mit Hilfe des Indikators lassen sich Top und Bottom des aktuellen
Time Frames erkennen.
Ich Empfehle nur eine Nutzung bei BTC um Wellen besser zu erkennen.
Erinnert euch daran, das ist nur eine Beta und gibt immer noch viele Fehlsignale aus, also testet es für euch selber in verschiedenen TimeFrames.
This script is a simple combination of RSI and EMA.
It allows you to see in which direction the trend is going in the current
time frame and how strong it is currently. It also shows you whether the
bulls or the bears are dominating the market. With the help of the indicator,
the top and bottom of the current time frame can be recognized.
recommended only use in BTC to better detect waves.
remember that it is in beta and still sends many false signals so you have to test it well in several time periods.
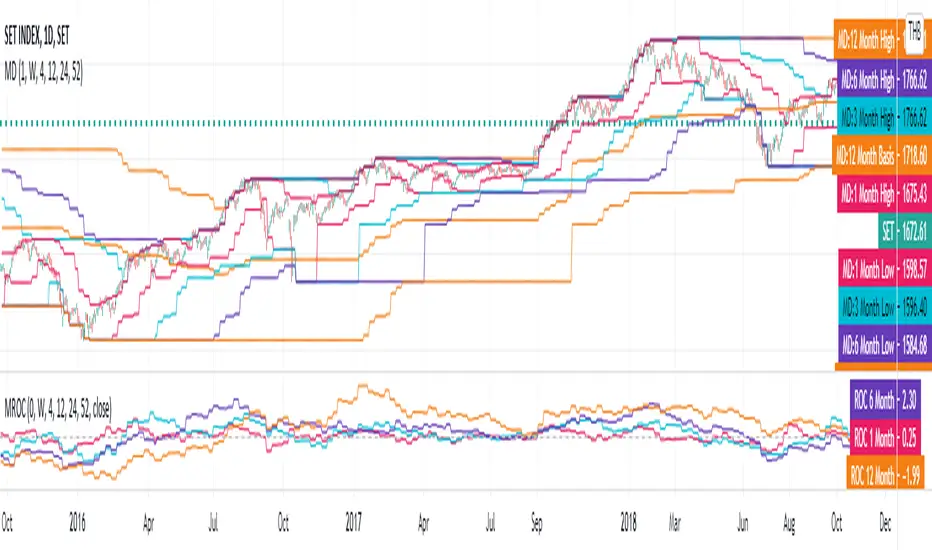
[Jett.][GoldenRush] Market DirectionThis script was created to analyze levels of market trends.
This is an indicator that is used to analyze the overall 2 levels.
1.Considering the index's key trends (Strategic Level)
2.Trend Analysis (Tactical Level)
To get a big overview of the trend and catch short-term movements. In this indicator, there are 4 levels of momentum measurements.
with the default setting
Major trends (Strategic Level)
1.We have the highest and lowest prices in the 52-week or 1-year scale.
2.We use the average of the highest and lowest prices(basis of 52-week). can be filtering the overview of the trend
3.As for the trend in 24-week or 6-month. Used to find the direction of the price And helps confirm that a trend is starting to take a certain direction.
Sub-level trend (Tactical Level)
1.Price in the level 12-week or 3-month. We use it to calculate the direction of movement in the short term, it is possible that the market will be bullish or bearish in 3-month.
2.And the 12-week or 3-month price is a confirmation of how strongly the short-term price moves in any direction.
3.If there will be a correction of the price base 12 weeks or 3-month price swings always happen first.
4.The 1-month price is the same as the trigger, if the market has a breakout in any way it could mean the start of a short sway.
By this indicator Besides being used to measure direction or trend, it can also be used as a significant filter for both support and resistance for short, medium, long term.
Jet.T.S. Trader
TM_INTRADAY_TOOLTM_INTRADAY_TOOL helps to identify following Things for Intraday Position on 1-3-5-10-15-30-60 Minutes and Daily timeframe along with Buy or sell signal.
1. Market Trend (Different Timeframe)
2. Price Direction
3. Area of Support & Resistance
4. Price Momentum
5. Volume Based Breakouts
Terminology Use ==> Black from Bottom for - Buy, Red from Top for - Sale Signal, and Numbers are to show time frame indication there is presence of buyer or seller like 1 for buy signal on 1 minute time frame etc.
Display and Interpretation ==> Buy Sale Signal in Digit with 1-3-5-10-15-30-60-D for different time frames.
any value signal ending with * shows breakout of support/ resistance and value signal starting with * shows entry to a momentum zone.
Green Mark with Triangle Up shows trend of that timeframe in positive and value shows upside possible direction on that timeframe vice versa for red signal with down triangle
T1 stand for trend change in 1 Minute timeframe and T3 stand for trend change in 3 Minute timeframe
Use market structure, chart pattern, trend lines for more support..
Time frame ==> Use proper Signal with 1 minute, 3 minute time frame
What to Identify ==> Overall Trend for the intraday
How to Use ==>
See how and order buildup is seen and current order position. Also area for volatility and expected movement in price direction
Note: - Use market structure, chart pattern, trend lines and price action parameter for more confirmation.
Entry ==>
Let’s wait the proper area of support or resistance ( Area of Value in case of trend pattern use)
Exit ==>
SL of swing high/low out of market structure with proper risk management and target with proper Risk/ Reward Ratio
Use the Below Contacts to Access this Indicator

Linear Regression Slope HistogramThis is the slope of linear regression plotted as a histogram. It has a threshold for the slope in case there is a minimum slope amount that the user wants for it to show green or red. The color shows a dim and bright effect depending on the direction of the slope to better show its rise and fall. You can set the length of the slope in the input setting screen.
Some interesting things about linear regression slope that I found out: It kind of looks like the histogram of ADX or the directional movement lines depending on the length used for the slope. According to Tushar Chande, linear regression can be used as an alternative of finding trend direction, although it is hard to say what length to use for it, I haven't been able to figure out a good way to apply it yet. According to Bulkowski, linear regression of the volume can be used with certain chart patterns that he listed to increase their chance of success by taking trades where the linear regression line points towards, so if you use volume as a source on this indicator you can take trades in whatever said direction. Got any other ideas on how to use linear regression? Feel free to let me knows, would gladly appreciate it.

Bitcoin Correlated Market DirectionIdentifies which major market is "controlling" Bitcoin and what direction that market is moving in.
Helps to identify confluence of trend or potential turning points for Bitcoin.
Blue = stocks in control and bullish
Purple = stocks in control and bearish
Orange = gold in control and bullish
Red = gold in control and bearish

indicatorenindicatoren is one non-overlaying indicator with multiple oscillators combined.
indicatoren provides the following functions:
- RSI (Relative Strength Index)
- Stochastics (representation of mathematically calculated momentum)
- Configurable MAcd (Moving Average Convergence Divergence) visually compressed to 0-100 range
- DMI & ADX (Directional Movement Index & Average Directional indeX) with visual lowering option
- Bollinger Bands direction
- COMBI Average
- Hourly, 4Hourly, Daily and Weekly time-indications
The length and appearance for each element can be adjusted. The MAcd has several modes and the brightness
of its elements can be adjusted with one single control.
The COMBI Average consists of a weighted average of the RSI, Stochastics, MAcd, DMI and the BB Direction.
It has its own definable length. Depending on the timeframe used, a visual indication of Hours, 4 Hours,
Days and Weeks might prove handy, especially on shorter timeframes.
Displaying this number of oscillators all at once may look like a carnival, therefore, each function can easily
be switched on or off. indicatoren can be used as just an advanced MAcd for example, or have it show the
combination of functions suiting you the most.
In order to combine a MAcd (+/- infinite scale) with Stochastics or RSI (0-100 scale), the MAcd is being visually
compressed and a Visual Multiplier parameter is provided to make it fit under any circumstances on any timeframe.
The DMI +/- and ADX scale are divided by 2.5 by default. Having the DMI’s on the lower portion of the indicator
does still provide decent info at a glance while it is not in the way of the other oscillators.
Books have been written and many articles and videos have been made about the meaning and possible applications
of these oscillators in trading.
The unique combination of these oscillators within indicatoren , together with the simple, yet useful,
visual options, make it to quite a versatile indicator on every timeframe on any chart.
GuidoN - November 2019, July 2020

Momentum Acceleration by DGTItalian physicist Galileo Galilei is usually credited with being the first to measure speed by considering the distance covered and the time it takes. Galileo defined speed as the distance covered during a period of time. In equation form, that is v = Δd / Δt where v is speed, Δd is change in distance, and Δt is change in time. The Greek symbol for delta, a triangle (Δ), means change.
Is the speed getting faster or slower?
Acceleration will be the answer, acceleration is defined as the rate of change of speed over a set period of time, meaning something is getting faster or slower. Mathematically expressed, acceleration denoted as a is a = Δv / Δt , where Δv is the change in speed and Δt is the change in time.
How to apply in trading
Lets think about Momentum, Rate of Return, Rate of Change all are calculated in almost same approach with Speed
Momentum measures change in price over a specified time period,
Rate of Change measures percent change in price over a specified time period,
Rate of Return measures the net gain or loss over a specified time period,
And Speed measures change in distance over a specified time period
So we may state that measuring the change in distance is also measuring the change in price over a specified time period which is length, hence
speed can be calculated as (source – source )/length and acceleration becomes (speed – speed )/length
In this study acceleration is used as signal line and result plotted as arrows demonstrating bull or bear direction where direction changes can be considered as trading setups
Just a little fun, since we deal with speed the short name of the study is named after famous cartoon character Speedy Gonzales
Trading success is all about following your trading strategy and the indicators should fit within your trading strategy, and not to be traded upon solely
Disclaimer: The script is for informational and educational purposes only. Use of the script does not constitutes professional and/or financial advice. You alone the sole responsibility of evaluating the script output and risks associated with the use of the script. In exchange for using the script, you agree not to hold dgtrd TradingView user liable for any possible claim for damages arising from any decision you make based on use of the script

Percentage Of Rising MA'sReturn the percentage of rising moving averages with periods in a custom range from min to max , with the possibility of using different types of moving averages.
Settings
Minimum MA Length Value : minimum period of the moving average.
Maximum MA Length Value : maximum period of the moving average.
Smooth : determine the period of an EMA using the indicator as input, 1 (no smoothing) by default.
Src : source input for the moving averages.
Type : type of the moving averages to be analyzed, available options are "SMA", "WMA" and "TMA", by default "SMA".
Usages
The indicator can return information about the main direction of a trend as well as its overall strength. A value of the indicator above 50 implies that more than 50% of the moving averages from period min to max are rising, this would suggest an uptrend, while a value inferior to 50 would suggest a down-trend.
On the chart, a ribbon consisting of simple moving averages from period 14 to 19, with a color indicating their direction, below the indicator with min = 14 and max = 19
The strength of a trend can be determined by how close the indicator is to 0 or 100, a value of 100 would imply that 100% percent of the moving averages are rising, this indicates a strong up-trend, while a value of 0 would suggest a strong down-trend.
Using different types of moving averages can allow to have more reactive or on the contrary, less noisy results.
Here the type of moving average used by both the ribbon and the indicator is the WMA, the WMA is more reactive than the SMA at the cost of providing less amount of filtering. On the other hand, using a triangular moving average (TMA) provide more filtering at the cost of being less reactive.
Finally, irregularities in the indicator output can be removed by using the smooth setting.
Above smooth = 50.
Details
The indicator is based upon a for loop, this implies that both the sma, wma or change functions are not directly usable, fortunately for us, it is possible to get the first difference of both the SMA, WMA and TMA without relying on a loop by using simple calculations.
The first difference of an SMA of period p is simply a momentum oscillator of period p divided by p , there are two ways to explain why this is the case, first, simple math can prove this, the first difference of an SMA is given by:
(x + x + ... + x )/p - (x + x + ... + x )/p
The repeating terms cancel each other out, as such, we end up with
(x - x )/p
which is simply a momentum oscillator divided by p , since this division doesn't change the sign of the output we can leave it out. We can also use impulses responses to prove this, the impulse response of a simple moving average is rectangular, taking the first difference of this impulse response will give the impulse response of a momentum oscillator, with the only difference being that the non-zero values of the result will be equal to 1/p instead of 1.
The same thing applies to the WMA
above the impulse response of the first difference of a WMA, we can see it is extremely similar to the one of a high pass SMA, only 1 bar longer, as such we can have the first difference of a WMA quite easily. The TMA is simply a 2 pass SMA (the SMA of an SMA), as such the solution is also simple.
piphunter bacdThe pip hunter bacd takes a pair of moving averages periods then through a series of calculations using those 2 moving averages gives you a signal line and what we call the bacd line when they cross it signifies a new trend direction
This tool is part of the total pip hunter package and comes with and compliments the pip hunter momentum extreme and trend scout indicators as it will allow you to take trades when this tool has identified the long term trend to be in the same direction as the momentum tool and short term trend tool and has confirmed that there is momentum behind the move
This is best used with the rest of the pip hunter package for more info on getting access to all three indicators in the package please message me for more information

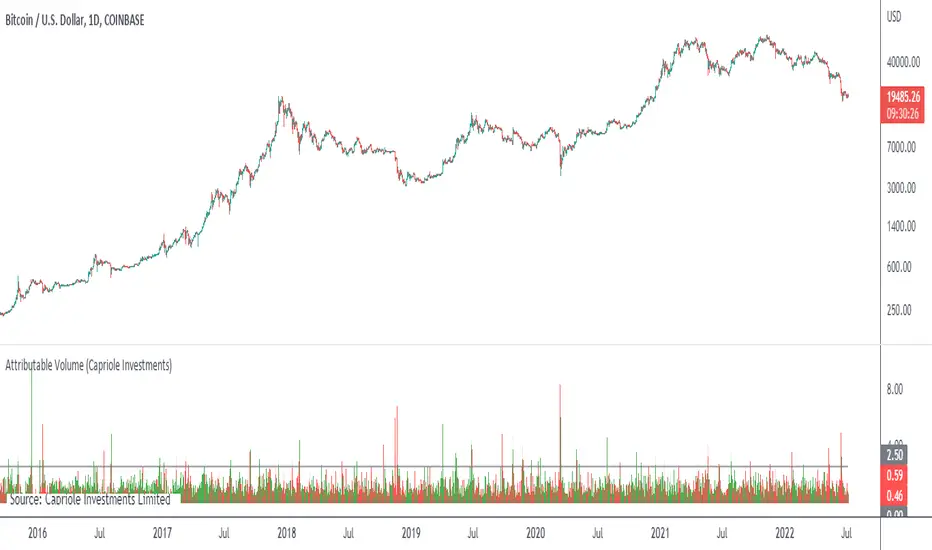
Attributable VolumeA volume indicator which calculates "Attributable Volume”, the portion of volume which contributed to the direction in which the candle moved.
Attributable Volume is calculated as: Total volume excluding the "counter wick" volume.
Where for a green (up) candle, the "counter wick" volume is the top wick volume.
In theory, Attributable Volume should better represent the effort of directional thrust of each candle.
By default, this indicator displays “Attributable RVOL”, but can be set to:
Attributable RVOL
RVOL
Attributable Volume
Volume
Note: RVOL = Relative Volume, the current volume divided by the Volume moving average. RVOL can be used to identify major moves, and potential starts/ends to trends.
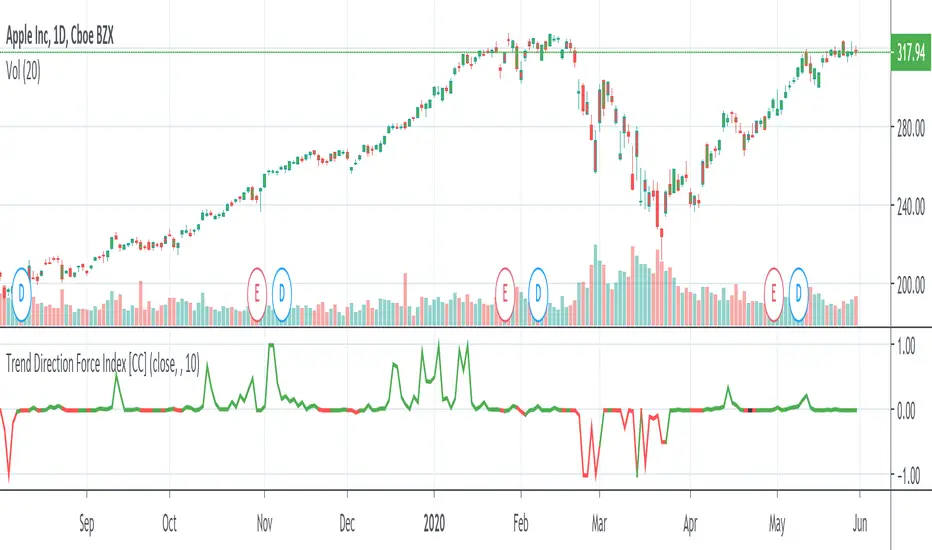
Trend Direction Force IndexThis is my own version of the famous Trend Direction Force Index and I modified the original to make my version react quickly to any trend. I have color coded the indicator to make it extremely easy to read so if it is green then buy and red then sell.
This was a custom request so if you would like more then just send me a message!
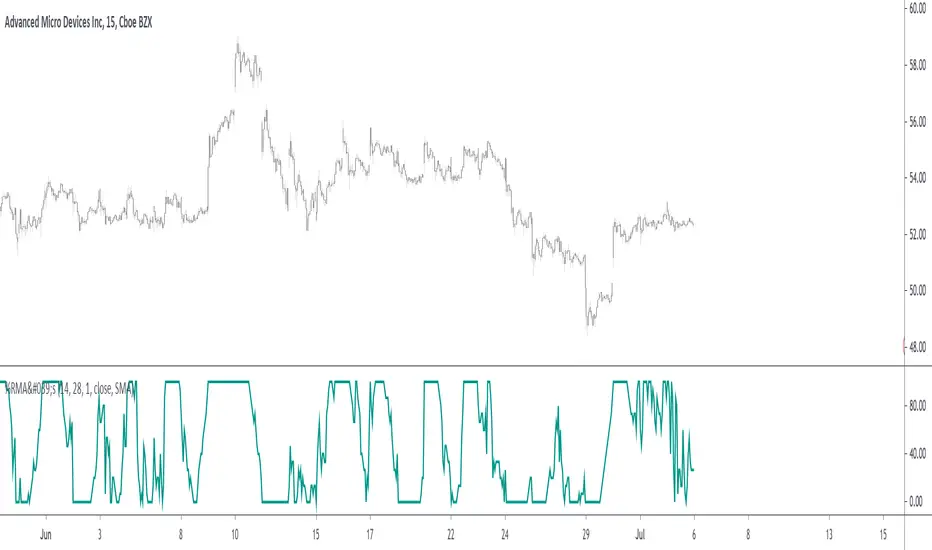
Direction&Strength Indicator
This simple Indicator shows:
(1) The D irection of a trend
(2) The S trength of a trend
hence the name "Direction & Strength Indicator.
How to read this Indicator:
Indicator above "resistance area" => strong UP trend
Indicator above 0 .................. => weak UP trend
Indicator below 0 .................. => weak DOWN trend
Indicator below "resistance area" => strong DOWN trend
Notice that this is a time-lagging indicator. Severity of timelag depends on set period of the indicator!
You can also identify overbought and oversold areas. (Tip: Compare to RSI.)

Momentum DirectionMomentum trading is a technique in which traders buy and sell according to the strength of recent price trends. ... Momentum traders bet that an asset price that is moving strongly in a given direction will continue to move in that direction until the trend loses strength
How to use :
This indicator gives you the exact entry and exit reading the moving average and direction into the oscillator aqua positive orange negative buy or sell signals and divergence plus pivots to overview potential reversals
Perfect Entry Timing
The best momentum trades come when a news shock hits, triggering rapid movement from one price level to another. In turn, this sets off buying or selling signals for observant players who jump in and are rewarded with instant profits. Another batch of momentum capital enters as the trade evolves, generating counter swings that shake out weak hands. The hot money population finally hits an extreme, triggering volatile whipsaws and major reversals.

Alpha - Bybit Directional MetricsThis is only for BTCUSD contracts on the Bybit exchange.
Alerts are built-in and working.
No Repainting nonsense.
Important:
This indicator will ONLY work for the ticker it is built for. It will not plot if you try and apply it to a different ticker.
Features:
Select the prefered lookback length, either Short or Long. If looking for a more reactive means of calculation then use Short. If you want more data taken into account giving a greater average then use Long.
Green bar color represents a LONG opportunity
Red bar color represents a SHORT opportunity
This has been built specifically for @Rektproof for his trading comp so good luck fam. Killem.

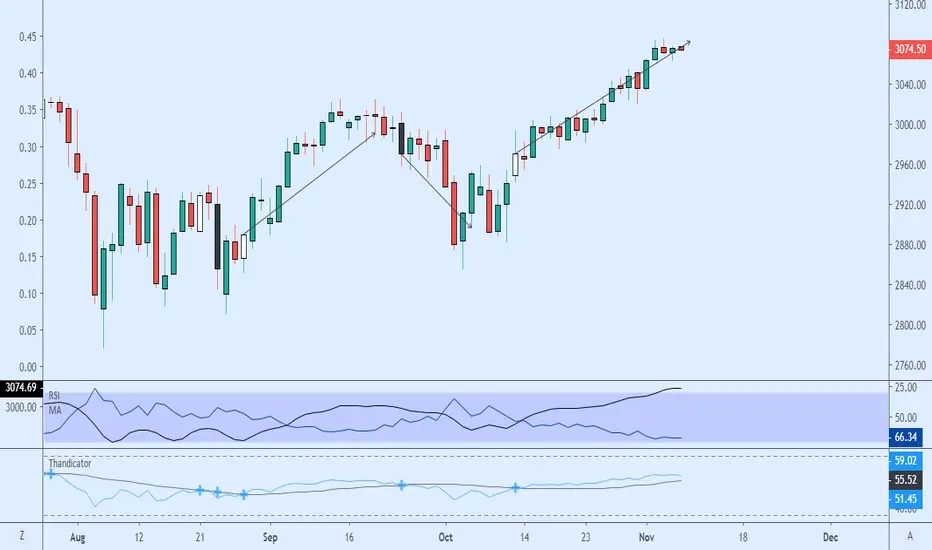
Thandicator v.1.0The Thandicator uses a cross of 30 RSI and 20 SMA bound to the RSI close. It's purpose is to mimic the RSI 14 / MA 5 cross and to highlight when to go long or short.
The white candles are meant to be a indication of upward momentum and black candles for downward momentum.
The signals can become choppy when a ticker becomes choppy, It's important to treat this indicator as you would any other, with a grain of salt and not 100% accurate.