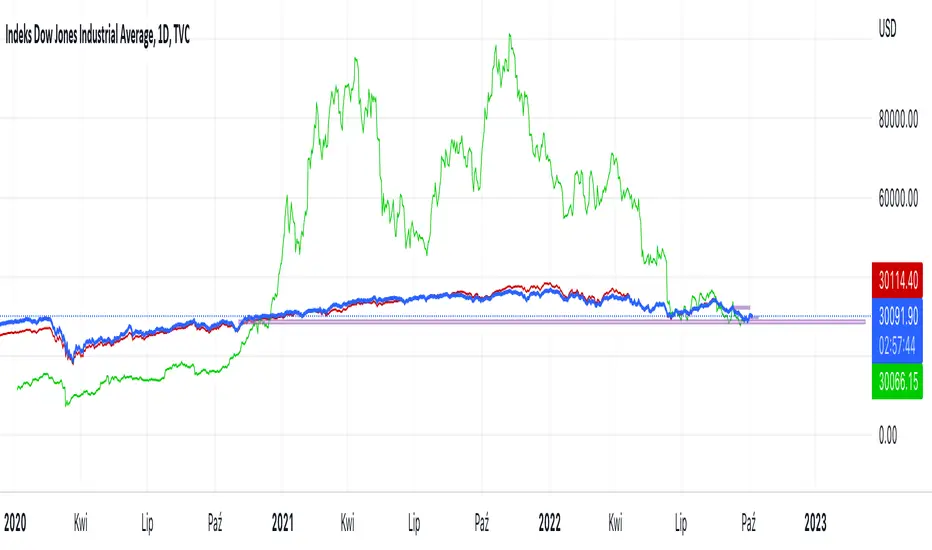
Hussarya compare DJI SPX BTCScript shows relations between DJI downJones SPX and BTC:USD.
DJI chart must be set from candlestick to line
Red line is price (close). x 8
Green line ist te price BTCUSD from Binance price (close) x 1.5
DJI
DOW 30 - Market BreadthDOW 30 indicator is intended for short-term intraday analysis and should not be used solely alone. Best to use this indicator in a combination with technical and fundamental analysis.
This indicator is calculated from all stocks in the DJI as of 8/9/2022;
- Evaluating VWAP,
- 9 EMA,
- 20 EMA.
Vwap Calculations;
Stock above Vwap = 1 (Vwap Bull),
Stock below Vwap = 1 (Vwap Bear),
As there are 30 stocks in the DJI, there is a max value of 30 Vwap Bulls/ Vwap Bears.
Ema Calculation;
Stock above 9 EMA = 0.5 (EMA Bulls),
Stock below 9 EMA = 0.5 (EMA Bears),
Stock above 20 EMA = 0.5 (EMA Bulls),
Stock below 20 EMA = 0.5 (EMA Bears),
For the EMA Bulls to reach 30 all stocks must be trading above both the 9 EMA and 20 EMA to reach a Max Value of 30.
The reasoning for this calculation is to suggest the current strength and speed of the current turn in the market.
Horizontal Lines:
There are three horizontal lines, MAX, MIN & Neutral;
MAX & MIN
Resides at the 30 & 0 levels suggesting the market is currently at an extreme. Representing all stocks are moving in the same direction together.
When the MAX or MIN are represented in the VWAP Line this represents directional conviction in the underlining DJI.
Neutral
Neutral resides at the 15 level and represents that the market is either about to make a decision or is choppy.
EXAMPLE
Below are some examples of how the DOW 30 indicator is able to represent the current market conditions.
Understand Current Market Conditions, either being Bullish, Neutral, or Bearish.
See live Market Mechanics, and understand the current market direction on a short-term timeframe.
DOW 30 indicator is intended for short-term intraday analysis and should not be used solely alone. Best to use this indicator in a combination with technical and fundamental analysis.
If there are any additional requests to the indicator feel free to leave a comment or privet message.
Best of luck trading.

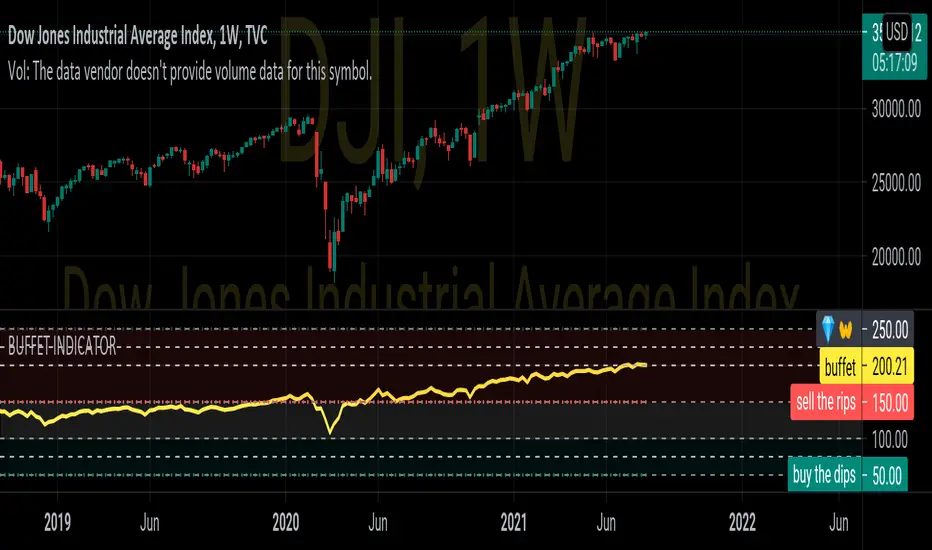
BUFFET INDICATORDISCRIPTION
The stock market cap to GDP ratio has become known as the Buffett Indicator in recent years, as Warren Buffett commented that he believes it is “probably the best single measure of where valuations stand at any given moment.”
CALCULATION
100*VALUE OF ALL STOCKS IN COUNTRY/GDP OF COUNTRY
100*wilshire5000/gdp
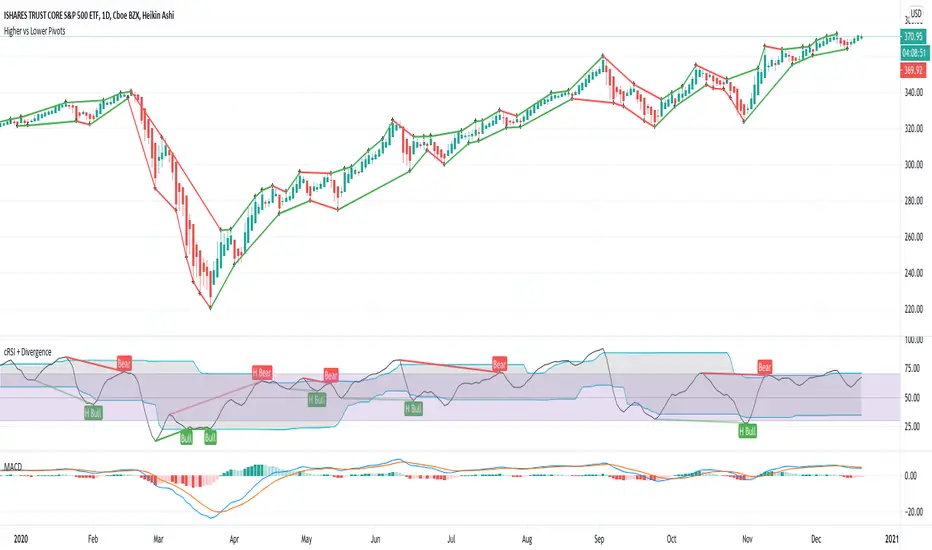
Higher vs Lower Pivots overlayA simple script that I made that draws lines between the high and low pivots. The color of the line define if the pivot is higher or lower than the previous pivot. The main thing to tune is the pivot look back vs look ahead, which are the same params used by the tradingview pivot indicator. There are several other params you can tweaks to get the look you want.
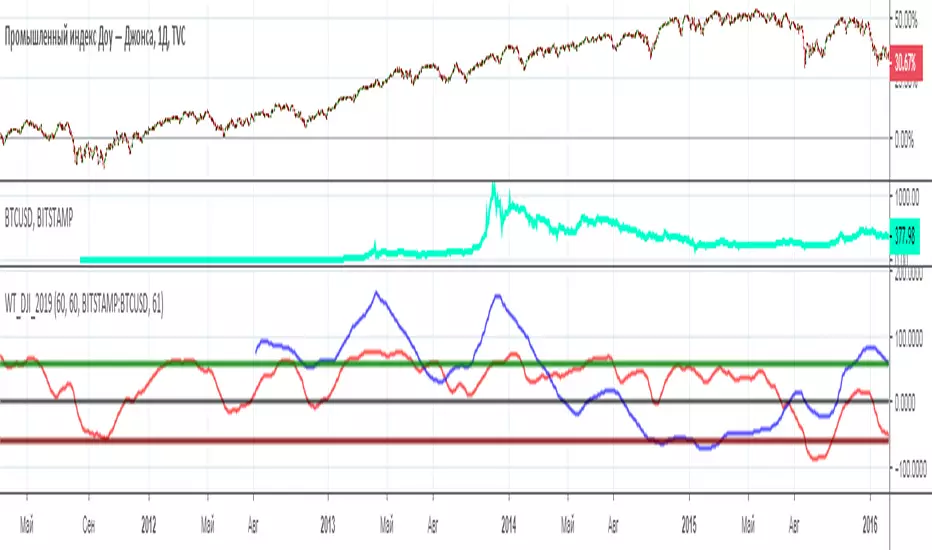
WT_BTC_Dow Jones_2019[wozdux]Comparison of two trading instruments using the indicator. Visual comparison often does not provide complete information. The scale and amplitude of the fluctuations of the two trading pairs are very different. Therefore, it is better to compare indicators from these pairs. I have used for this purpose, the speed indicator of price movement wt. The red line is the wt indicator from the trading instrument that is in the main window. The blue line is an indicator from the pair, which is written in the indicator settings. In addition, the calculation periods for each pair can be taken as the same or different. Often, trading pairs do not fluctuate synchronously, so it is necessary to select the periods of calculation of the wt indicator individually. In this example, Dow Jones and bitcoin were used.
-----------------------
Сравнение двух торговых инструментов с помощью индикатора. Визуальное сравнение часто не дает полной информации. Масштаб и амплитуда колебаний двух торговых пар бывают сильно различаются. Поэтому сравнивать лучше индикаторы от данных пар. Я использовала для этой цели индикатор скорости движения цены wt. Красная линия это индикатор wt от того торгового инструмента, который находится в главном окне. Синяя линия это индикатор от пары, которая прописывается в настройках индикатора. Кроме того, периоды вычислений для каждой пары можно брать как одинаковые, так и разные. Часто торговые пары колеблются не синхронно, поэтому стоит подбирать периоды вычислений индикатора WT индивидуально. В данном примере использовался Доу Джонс и биткоин.