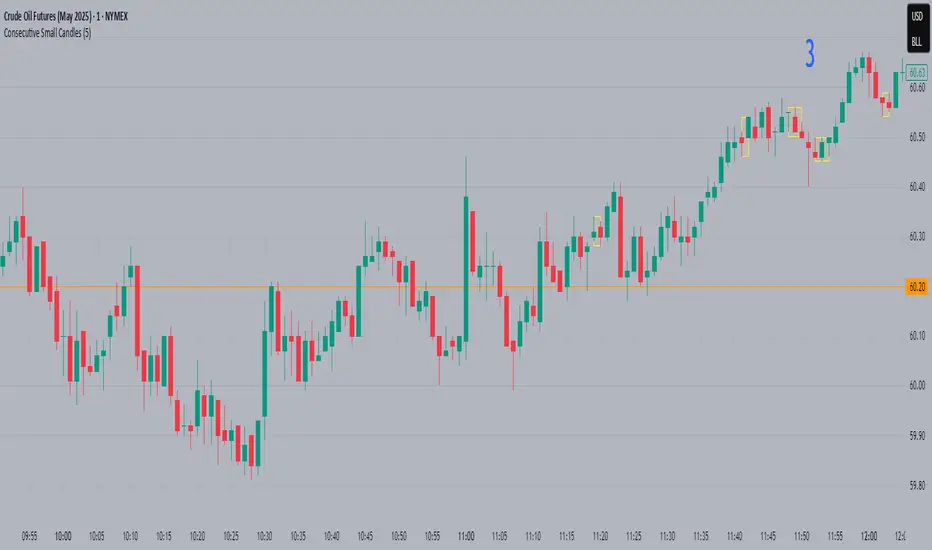
Consecutive Small CandlesThis script identifies relatively "small" candles based on their being smaller than a maximum size you set based on the instrument and your own criteria. Default is 5, as I use this indicator largely on CL which rarely has candles smaller than 3 ticks but frequently greater than 5.
It identifies 2 or more consecutive candles to help identify patterns similar to Bob Volman's Double Doji Break methodolgy. Written by Grok 3.
Doji
Candlestick Pattern Indicator – Doji, Harami, More [algo_aakash]This Candlestick Pattern Indicator is designed to help traders identify key price action patterns like Bullish Engulfing, Bearish Engulfing, Doji, Hammer, Morning Star, Evening Star, and many more directly on your TradingView chart. With customizable options to display both bullish and bearish patterns , this indicator provides real-time visual markers and labels, helping you make informed trading decisions.
Key features of the indicator include:
Detects popular candlestick patterns such as Bullish Engulfing, Bearish Engulfing, Hammer, Morning Star, Tweezer Tops, and more.
Customizable settings for displaying pattern shapes, labels, and opacity, tailored to your trading preferences.
Option to plot signals only after a candle closes, ensuring accuracy.
Alerts for immediate notification of detected patterns.
Visual markers on the chart, including arrows and labels, for quick recognition of potential trade setups.
This indicator is ideal for traders who rely on candlestick patterns for technical analysis and want an automated tool to highlight these setups for easier decision-making.
Whether you're a beginner or an experienced trader, this tool will help you spot important patterns in real-time without cluttering your chart.

Doji DetectorThis script is designed to detect Doji candlesticks, which are characterized by a small body compared to the overall candle range. The script identifies a Doji when:
✔ The body size is smaller than 10% of the total candle range, OR
✔ The body size is less than 3 pips.
How It Works:
The script calculates the body size of each candle (absolute difference between the open and close price).
It then compares the body size with the total candle range (high - low).
If the body size is smaller than 10% of the candle range or less than 3 pips, the script marks it as a Doji.
How to Use It:
Apply the script to your TradingView chart.
It will highlight Doji candles automatically.
Suitable for traders using price action analysis to identify potential market reversals or indecision zones.
🚀 Best suited for: Forex, Stocks, and Crypto markets.
🔔 Optional: You can modify the conditions to fit your trading strategy.

Triple Doji SequenceThe Triple Doji Sequence indicator helps traders identify consecutive Doji candlestick patterns, allowing them to choose between spotting single, double, or triple Dojis. A Doji is detected when the candle's body is small relative to its wicks, with either the upper or lower wick being significantly larger. Users can customize their own Doji criteria by adjusting the body size and wick dominance settings. The indicator ensures that consecutive Dojis align in the same direction before confirming a valid pattern, making it easier to identify market indecision or potential trend reversals.
When the chosen Doji sequence is detected, the indicator plots a star (*) above bearish Dojis (upper wick dominant) and below bullish Dojis (lower wick dominant). It also sends alerts when a valid sequence is confirmed at the close of the bar. This tool helps traders refine their strategy by spotting repeated Doji formations, which may indicate key turning points or continuation patterns in price action.
How to Use the Triple Doji Sequence Indicator?
Apply the Indicator:
Add the Triple Doji Sequence indicator to your TradingView chart.
It will automatically scan for Doji patterns based on your settings.
Customize Your Doji Criteria:
Adjust the body size and wick dominance settings to define what qualifies as a Doji.
Choose whether to detect single, double, or triple Doji sequences.
Interpret the Signals:
A star (*) above a candle signals a bearish Doji (upper wick dominant).
A star (*) below a candle signals a bullish Doji (lower wick dominant).
Set Up Alerts:
Enable alerts to receive notifications when a Doji sequence is confirmed at bar close.
Choose alert frequency based on your trading strategy (e.g., once per bar, once per bar close).
Use in Trading Strategy:
Doji sequences can indicate trend reversals or market indecision.
Combine this indicator with support/resistance levels, volume, or other indicators to confirm signals.
PS: Good luck in finding a Triple Doji :)

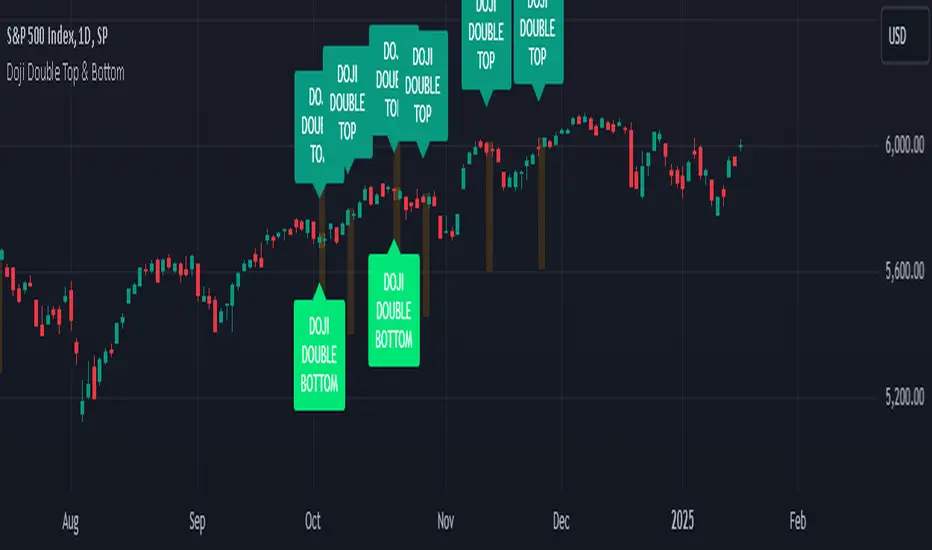
Doji Double Top & Double Bottom
FUNCTION :
This indicator checks if 2 consecutive candlesticks are formed in such a way that both the lows or both the highs of the consecutive candlesticks are almost at the same level and either of them is a doji
TIMEFRAMES :
it works on daily, weekly, monthly and higher timeframes
CRITERIA :
There is maximum difference value between 2 consecutive candlesticks' lows or 2 consecutive candlesticks' highs
Minimum value of the doji's wick size
Maximum value of the doji's body size
These 3 conditions need to be fulfilled for the 2 consecutive candlesticks to be considered as a Double top or Double bottom by this indicator
EXAMPLES :
Here the indicator is giving only double Bottom signals on CRUDE OIL chart
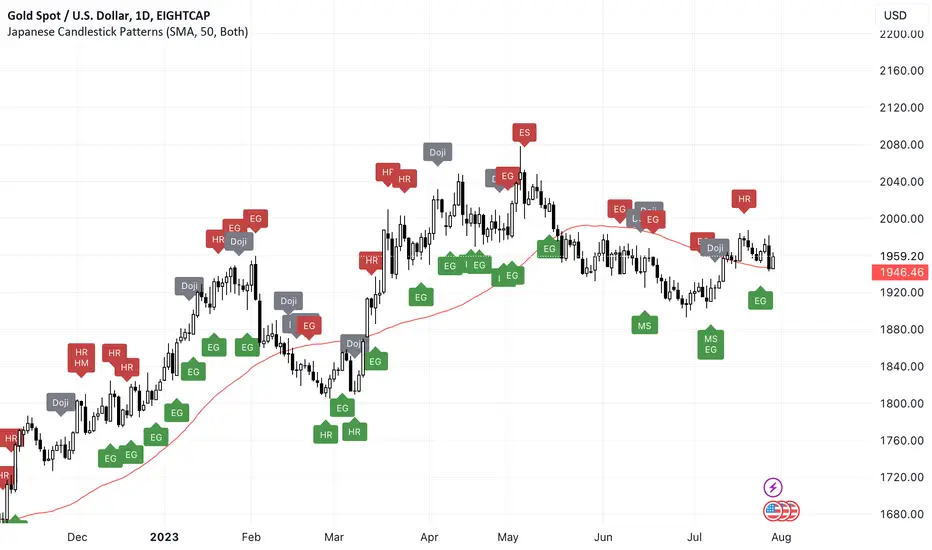
Here the indicator is giving only double top signals on GOLD chart
Here the indicator gives both double top & double bottom signals on EUR/USD Daily chart
Here the indicator is giving both double top & double bottom signals on EUR/USD Half-Yearly chart
DEFINITIONS :
There are 2 types -
DOJI DOUBLE BOTTOM - if the lows of 2 consecutive candlesticks are almost at the same level & either of them is doji then it is called Double Bottom and market is supposed to go higher after forming it.
DOJI DOUBLE TOP - if the highs of 2 consecutive candlesticks are almost at the same level & either of them is doji then it is called Double Top and market is supposed to go lower after forming it.
SETTINGS :
There are options to change the value of each of the 3 parameters within the indicator's settings for daily, weekly & monthly chart [
LIMITATIONS :
You should not trade based on the signals from this indicator solely, you should check other parameters too before making trading decision
Price Action StrategyThe **Price Action Strategy** is a tool designed to capture potential market reversals by utilizing classic reversal candlestick patterns such as Hammer, Shooting Star, Doji, and Pin Bar near dinamic support and resistance levels.
***Note to moderators
- The moving average was removed from the strategy because it was not suitable for the strategy and not participating in the entry or exit criteria.
- The moving average length has been replaced/renamed by the support/resistance lenght.
- The bullish engulfing and bearish engulfing patterns were also removed because in practice they were not working as entry criteria, since the candle price invariably closes far from the support/resistance level even considering the sensitivity range. There was no change in the backtest results after removing these patterns.
### Key Elements of the Strategy
1. Support and Resistance Levels
- Support and resistance are pivotal price levels where the asset has previously struggled to move lower (support) or higher (resistance). These levels act as psychological barriers where buying interest (at support) or selling interest (at resistance) often increases, potentially causing price reversals.
- In this strategy, support is calculated as the lowest low and resistance as the highest high over a 16-period length. When the price nears these levels, it indicates possible zones for a reversal, and the strategy looks for specific candlestick patterns to confirm an entry.
2. Candlestick Patterns
- This strategy uses classic reversal patterns, including:
- **Hammer**: Indicates a buy signal, suggesting rejection of lower prices.
- **Shooting Star**: Suggests a sell signal, showing rejection of higher prices.
- **Doji**: Reflects indecision and potential reversal.
- **Pin Bar**: Represents price rejection with a long shadow, often signaling a reversal.
By combining these reversal patterns with the proximity to dinamic support or resistance levels, the strategy aims to capture potential reversal movements.
3. Sensitivity Level
- The sensitivity parameter adjusts the acceptable range (Default 0.018 = 1.8%) around support and resistance levels within which reversal patterns can trigger trades (i.e. the closing price of the candle must occur within the specified range defined by the sensitivity parameter). A higher sensitivity value expands this range, potentially leading to less accurate signals, as it may allow for more false positives.
4. Entry Criteria
- **Buy (Long)**: A Hammer, Doji, or Pin Bar pattern near support.
- **Sell (Short)**: A Shooting Star, Doji, or Pin Bar near resistance.
5. Exit criteria
- Take profit = 9.5%
- Stop loss = 16%
6. No Repainting
- The Price Action Strategy is not subject to repainting.
7. Position Sizing by Equity and risk management
- This strategy has a default configuration to operate with 35% of the equity. The stop loss is set to 16% from the entry price. This way, the strategy is putting at risk about 16% of 35% of equity, that is, around 5.6% of equity for each trade. The percentage of equity and stop loss can be adjusted by the user according to their risk management.
8. Backtest results
- This strategy was subjected to deep backtest and operations in replay mode on **1000000MOGUSDT.P**, with the inclusion of transaction fees at 0.12% and slipagge of 5 ticks, and the past results have shown consistent profitability. Past results are no guarantee of future results. The strategy's backtest results may even be due to overfitting with past data.
9. Chart Visualization
- Support and resistance levels are displayed as green (support) and red (resistance) lines.
- Only the candlestick pattern that generated the entry signal to triger the trade is identified and labeled on the chart. During the operation, the occurrence of new Doji, Pin Bar, Hammer and Shooting Star patterns will not be demonstrated on the chart, since the exit criteria are based on percentage take profit and stop loss.
Doji:
Pin Bar and Doji
Shooting Star and Doji
Hammer
10. Default settings
Chart timeframe: 20 min
Moving average lenght: 16
Sensitivity: 0.018
Stop loss (%): 16
Take Profit (%): 9.5
BYBIT:1000000MOGUSDT.P

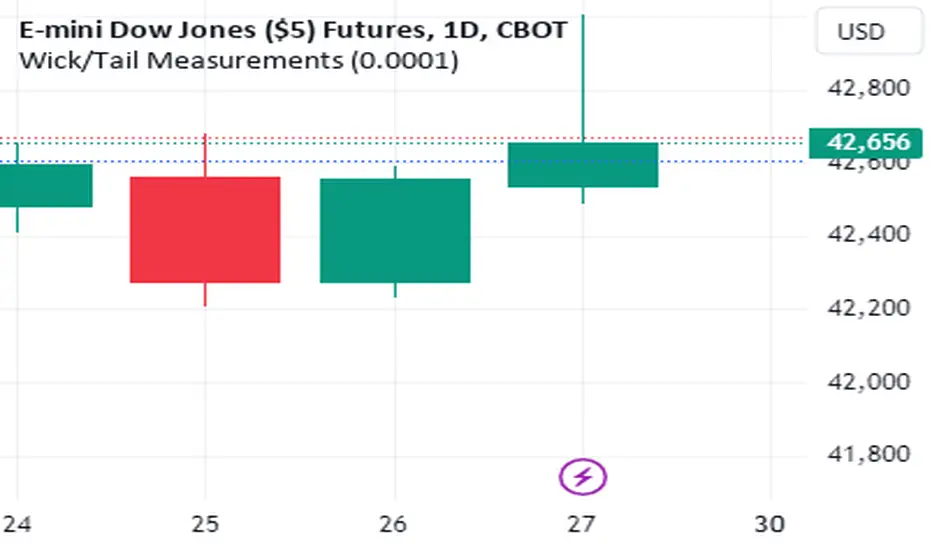
Wick/Tail Candle MeasurementsThis indicator runs on trading view. It was programmed with pine script v5.
Once the indicator is running you can scroll your chart to any year or date on the chart, then for the input select the date your interested in knowing the length of the tails and wicks from a bar and their lengths are measured in points.
To move the measurement, you can select the vertical bar built into the indicator AFTER clicking the green label and moving it around using the vertical bar *only*. You must click the vertical bar in the middle of the label to move the indicator calculation to another bar. You can also just select the date using the input as mentioned. This indicator calculates just one bar at a time.
measurements are from bar OPEN to bar HIGH for measured WICKS regardless of the bar being long or short and from bar OPEN to bar LOW for measured TAILS also regardless of the bar being long or short.
This indicator calculates tails and wicks including the bar body in the calculations. Basically showing you how much the market moved in a certain direction for the entire duration of that Doji candle.
Its designed to measure completed bars on the daily futures charts. (Dow Jones, ES&P500, Nasdaq, Russell 2000, etc) Although it may work well on other markets. The indicator could easily be tweaked in order to work well with other markets. It is not designed for forex markets currently.
Japanese Candle Patterns Detector in Potential Price ZoneThis script would find the 8 famous "Japanese Candle Stick Patterns" in your chart.
Please be aware it find patterns in "Potential price zones" only, which help you to avoid none-important patterns during a price trend.
I used RSI and ATR in my codes to find best candle forms and price conditions.
*** This indicator shared before but without source code. According to follow requests, I publish it again with source codes. I hope it helps you in trading journey...
Bellow patterns are detecting:
Hammer | ShootingStar | Engulfing Candle | Doji | Tweezers Top/Buttom | Three White Soldiers/Three Black Crows | Marubozu | Harami
* You can select your preferred patterns from indicator setting.
* Pattern names are abbreviated for better view on chart.
* Separate alerts for different type of candles for whom looking for a specific candle pattern
* Main alert which notify about every kind of candle patterns detect in a chart

Buy/Sell BoxThis indicator tries to identify the points where the price exceeds or falls below a rectangle based on the opening and closing prices of the previous period, the creation of the boxes occurs when a doji is detected therefore it will calculate the coordinates of the rectangle that will be drawn around it, therefore the indicator offers buy or sell signals based on this logic. Specifically, the buy signal is generated if the closing price is above the top of the rectangle and satisfies some previous price conditions while the sell signal is generated if the closing price is below the bottom of the rectangle and satisfies some conditions of previous prices within a further threshold based on the Ema 150.
Lines are then drawn on the graph to visually display the extreme price levels, which can be useful for any confirmation of buy and sell signals, Stop Loss and Take Profit, Trend Filter (to visually understand if the trend is bullish or bearish)
A potentially effective trading strategy could involve identifying buy and sell signals near the extreme price level lines drawn by the indicator. This approach can be used to try to improve the accuracy of your trading signals and make more informed decisions. For example:
When you receive a buy or sell signal based on the dojis and rectangles generated by the indicator, check whether the price is also near one of the extreme price level lines. If you are receiving a buy signal and notice that the current price is near a low of the lower level line, this may further confirm the buying opportunity, as the price is near a significant resistance level. On the contrary, if the sell signal was close to a maximum price level it could confirm an excellent short entry.
It is also possible to use the boxes as reference points to set the stop loss and take profit levels. If you are entering a buy position, you might consider setting your stop loss just below an upper line of the last box. Additionally, you may want to set your take profit near a higher price level if you are looking to maximize profits. This will help manage risks and protect your capital.

Contraction Box & Doji LinesContraction & Doji Lines indicator is designed to identify and visualize potential support and resistance levels on a price chart. It does this by detecting doji candlestick patterns and drawing horizontal lines from the middle of the doji bodies to the right. Additionally, it also highlights price contraction zones with colored boxes.
The indicator first identifies doji candlestick patterns that it suggests indecision in the market, a horizontal line and these horizontal lines can act as potential support or resistance levels. Traders can observe price reactions around these lines. If the price approaches a line and bounces off it, it may indicate a significant level in the market.
In addition to doji lines, this indicator also highlights price contraction zones. When a contraction zone is detected, a colored box is drawn to highlight this zone. The box extends from the fifth bar ago (left side) to the current bar (right side), with the highest high and lowest low of the identified zone. The color and width of this box can be customized using the "Box Line Border Color," "Box Background Color," and "Box Width" parameters.
A possible strategy could be can use the doji lines as potential support and resistance levels to make trading decisions. For example, if the price breaks above a doji line and holds, it may indicate a bullish signal.
The colored boxes highlight areas of price contraction, which often precede significant price movements. Traders can use these zones to anticipate potential breakouts or breakdowns.
For example, you might enter a long (buy) position if it anticipate a breakout from a contraction zone with a target price set above the breakout level. Conversely, you might enter a short (sell) position if they anticipate a breakdown from a contraction zone with a target price set below the breakdown level.

Doji TrenderDoji Trender searches multiple timeframes for candles where open and close are less than dojiPercent apart (default 0.025%), and plots the trends between them.
Experiment with dojiPercent to change the number of "dojis" detected. I will add doji sub-type indication if it appears to be meaningful.
By default, it plots the 5m (red), 15m (orange), 1h (yellow), 4h (green), and chart (cyan). If the chart timeframe is any of the configurable ones, the chart copy won't be drawn. (I might reverse that, so that cyan is always drawn.)
Since doji points are somewhat sparse, and the lookback is short (default 10), the EMA's make drastic corrections toward new indecision. (I'm not convinced the EMA's are useful and/or relevant.)
This works on any timeframe, but seems to work best on the 1D. (5m is somewhat irrelevant on the 1D, so there are tweaks to be made.)
Dojis from a timeframe are corrections to a doji trend from a higher timeframe.
Red corrects to orange, corrects to yellow, corrects to green.
If the chart timeframe is > 4h, the others will correct to cyan.
Otherwise, cyan will fit in-between the adjacent timeframes.
Multiple indecision candles within a short timespan forming sharp peaks indicate retests, backtests, rejections, and bounces off of support/resistance.
With a correct larger-timeframe channel, one would expect lower-timeframe indecision at/along typical levels.
Although the doji's have unpredictable wicks, the dots printed by this indicator do not. Matched with volume, they reveal the prices where the most violent battles between bulls and bears took place, and are likely to take place, again.
One could:
1) Put trends on the longest segments, then look for confluence along them, and/or near the intersections.
2) Use lower-timeframe doji trends to estimate the direction of the higher-timeframe doji trends, before they become detectable to Doji Trender. Confirm by looking for confluence where those trends intersect with horizontal support/resistance, this indicator, and/or others.
3) Notice that multiple legs on the same trend line are close to parallel, if not colinear.
4) Notice that many of the doji segments point toward (very-distant) future dojis.
5) Drop horizontal lines on the dots where we previously reversed, and find confluence in VRVP when we revisit them.
6) Create parallel (fib/whatever) channels that more-closely match MM's intent. The segments one uses to set the angle of the channel, and those used to align the channel, vertically, are not always the same:
a) Match the channel slope to as many doji slopes as possible, considering every trend.
b) Figure out where the channel actually belongs, re-considering every trend.

All Candlestick Patterns Screener [By MUQWISHI]▋ INTRODUCTION :
The Candlestick Patterns Screener has been designed to offer an advanced monitoring solution for up to 40 symbols. Utilizing a log screener style, it efficiently gathers information on confirmed candlestick pattern occurrences and presents it in an organized table. This table includes essential details such as the symbol name, signal price, and the corresponding candlestick pattern name.
_______________________
▋ OVERVIEW:
_______________________
▋ CREDIT:
Credit to public technical “*All Candlestick Patterns*” indicator.
_______________________
▋ USAGE:
_______________________
▋ Final Comments:
For best performance, add the Candlestick Patterns Screener on active symbol chart like QQQ, SPY, AAPL, BTCUSDT, ES, EURUSD or …etc.
Candlestick patterns are not a major concept to build a trading decision.
Personally, I see candlestick patterns as a means to comprehend the psychology of the market, and help to follow the price action.
Please let me know if you have any questions.
Thank you.

Japanese Candlestick Patterns💡 Japanese Candlesticks are a visual representation of price movements in financial markets. They were first developed by Japanese rice traders in the 18th century to analyze the price of rice contracts, and have since been adopted by traders across the world for a wide range of assets.
📌 A candlestick is composed of a rectangular body and two thin lines, known as wicks, that extend from the top and bottom of the body. The body represents the difference between the opening and closing prices of the asset during a specific time period, while the wicks indicate the high and low prices reached during that period.
📌 By using these and other candlestick patterns, traders can identify potential buying and selling opportunities and manage their risk accordingly. However, it's important to note that candlestick patterns should be used in conjunction with other technical and fundamental analysis tools to make well-informed trading decisions.
📌 Candlestick patterns are particularly useful because they are based on price action rather than external factors such as news or economic data. This makes them useful for traders who employ technical analysis, as they can use candlestick patterns to identify potential trading opportunities and manage their risk accordingly.
🚀 Candlesticks can be used to identify market trends, as well as potential buying and selling opportunities. By analyzing the patterns formed by multiple candlesticks, traders can gain insights into the behavior of the market and make informed trading decisions. Overall, Japanese Candlesticks are a powerful tool for technical analysis that can provide valuable insights into financial markets.
🔍 THE PATTERNS THAT ARE RECOGNIZED:
🔄 Reversal Patterns
* Counterattack Lines
* Dark-Cloud Cover
* Engulfing ( Bearish / Bullish )
* Hammer
* Hanging Man
* Harami ( Bearish / Bullish )
* In Neck
* On Neck
* Piercing
* Three Black Crows
* Thrusting
* Upside Gap Two Crows
⭐️ Stars
* Abandoned Baby
* Evening star
* Inverted Hammer
* Morning Star
* Shooting Star
🎯 Doji
* Doji
* Dragonfly Doji
* Evening Doji Star
* Gravestone Doji
* Long Legged Doji
* Morning Doji Star
🔥 Continuation Patterns
* Falling Three Methods
* Rising Three Methods
* Tasuki ( Upside / Downside )
🥊 Utility
* Long Lower Shadow
* Long Upper Shadow
❤️ Please, support the work with like & comment! ❤️
Trading Session TemplateDescription:
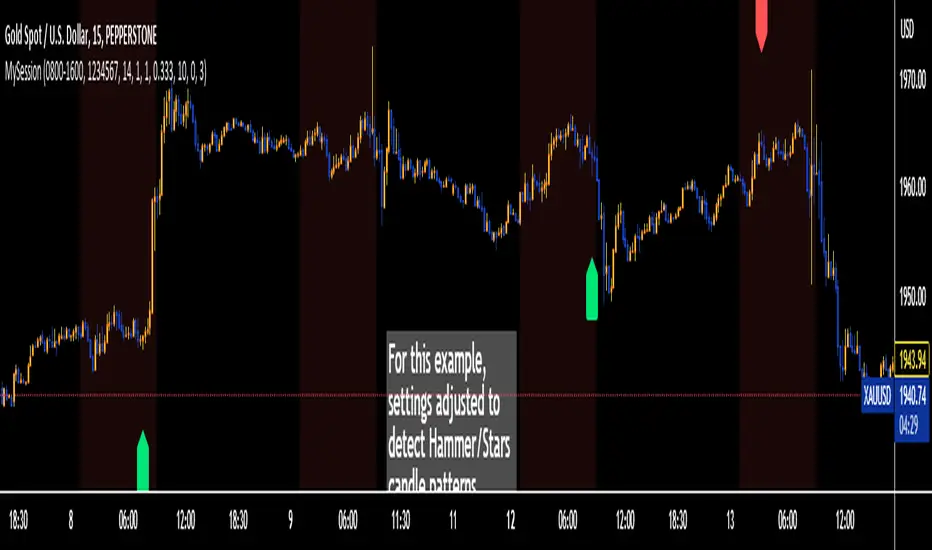
The Trading Session Template Indicator is a powerful script that allows traders to customize their own trading session time range on a chart. With this indicator, you have the flexibility to define specific hours during which you prefer to focus your trading activities. The example chart showcases the New York session hours, but you can easily adapt it to any desired time range based on your trading strategy and preferences.
Key Features:
Customizable Trading Session: The indicator empowers you to define your own trading session time range, tailored to your preferred market sessions or specific trading hours. This flexibility ensures that the indicator aligns with your unique trading strategy.
Highlighted Trading Session: When a new trading day begins, the script automatically scans for the specified time range. Once the first candle within the range begins printing, the background color of the chart is highlighted, indicating the beginning of the trading session. When the last candle within the range is closed, the background color returns to normal.
Focus on Specific Market Sessions: This indicator is particularly useful for traders who prefer to trade certain market sessions or specific hours during the day. By customizing the trading session, you can better align your trading activities with specific market conditions and trading opportunities.
Candle Pattern Detection: The indicator includes the ability to detect candle patterns such as Doji, Engulfing, Hammer, and Shooting Star. You can activate the desired candle patterns and set up alerts for them. When an alert is triggered, indicating the formation of a specific candle pattern, you can further analyze the market and make informed trading decisions.
ATR Filter: The indicator offers an ATR (Average True Range) filter to limit noise and focus on candle patterns with a size comparable to the ATR. You can set a minimum and maximum size for a candle compared to the ATR. This helps you filter out smaller or larger candles that may not align with your trading preferences.
Stop Loss (SL) and Take Profit (TP) Levels: When a candle pattern is detected, based on the ATR, the indicator can display suggested Stop Loss and Take Profit levels. This feature provides additional guidance for risk management and potential profit targets.
User-Friendly Interface: The indicator provides a user-friendly interface with adjustable settings and switches for customization. Tooltips are available to guide you through the various options and configurations, making it easy to adapt the indicator to your trading style and preferences.
Note:
The Trading Session Template Indicator is designed for timeframes lower than 1D. It does not plot any information on timeframes of 1D and higher.
Disclaimer:
The Trading Session Template Indicator is provided for informational and educational purposes only. Trading in the financial markets involves risk, and you should only trade with funds that you can afford to lose. The indicator's past performance is not indicative of future results. Always conduct your own research and due diligence before making any investment decisions. The creator of this indicator shall not be held responsible for any losses or damages incurred from the use of this indicator.
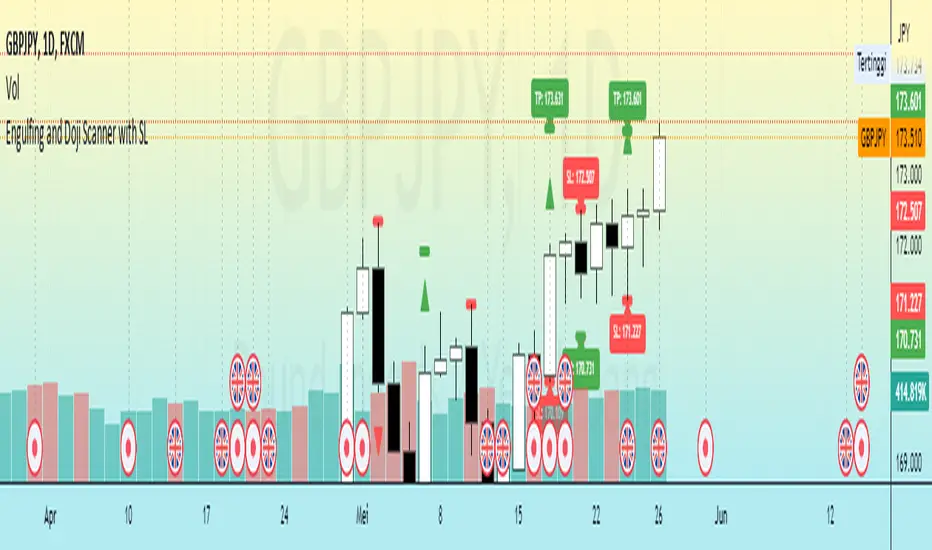
Engulfing and Doji Scanner with SLThe Bullish Engulfing pattern occurs when the close is higher than the open, and scripts will look for this pattern by checking the difference in the close and open prices sufficiently in pips. Likewise, the Bearish Engulfing pattern occurs when the close is lower than the open, and scripts will look for this pattern by checking for sufficient difference in the open and close in pips.
The Doji pattern occurs when the absolute difference between the open and close prices is very small compared to the price range for that period. The script will look for these patterns by comparing the difference between the open and close prices by a certain percentage of the price range.
After the patterns are detected, the script will calculate the Stop Loss (SL) and Take Profit (TP) levels based on the parameters set. The SL level will be determined based on the lowest price range with certain adjustments, while the TP level is calculated using a 1:1 ratio to the SL distance.
This script will display arrows and Stop Loss and Take Profit labels on the chart to assist traders in identifying relevant patterns and levels. However, it is important to remember that these scripts only assist in the analysis of patterns and levels, and a more complete trading strategy and decision-making remains the responsibility of the trader.
The Golden Candlestick PatternThe Golden pattern is a three-candlestick configuration based on a variation of the golden ratio (2.618) from the Fibonacci sequence.
The bullish Golden pattern is composed of a normal bullish candlestick with any type of body, followed by a bigger bullish candlestick with a close price that is at least 2.618 times the size of the first candlestick (high to low). Finally, there must be an important condition that is, a third candlestick that comes back to test the open of the second candlestick from where the entry is given.
The bearish Golden pattern is composed of a normal bearish candlestick with any type of body, followed by a bigger bearish candlestick with a close price that is at least 2.618 times the size of the first candlestick (high to low). Finally, there must be an important condition that is, a third candlestick that comes back to test the open of the second candlestick from where the entry is given.

Pure Morning 2.0 - Candlestick Pattern Doji StrategyThe new "Pure Morning 2.0 - Candlestick Pattern Doji Strategy" is a trend-following, intraday cryptocurrency trading system authored by devil_machine.
The system identifies Doji and Morning Doji Star candlestick formations above the EMA60 as entry points for long trades.
For best results we recommend to use on 15-minute, 30-minute, or 1-hour timeframes, and are ideal for high-volatility markets.
The strategy also utilizes a profit target or trailing stop for exits, with stop loss set at the lowest low of the last 100 candles. The strategy's configuration details, such as Doji tolerance, and exit configurations are adjustable.
In this new version 2.0, we've incorporated a new selectable filter. Since the stop loss is set at the lowest low, this filter ensures that this value isn't too far from the entry price, thereby optimizing the Risk-Reward ratio.
In the specific case of ALPINE, a 9% Take-Profit and and Stop-Loss at Lowest Low of the last 100 candles were set, with an activated trailing-stop percentage, Max Loss Filter is not active.
Name : Pure Morning 2.0 - Candlestick Pattern Doji Strategy
Author : @devil_machine
Category : Trend Follower based on candlestick patterns.
Operating mode : Spot or Futures (only long).
Trades duration : Intraday
Timeframe : 15m, 30m, 1H
Market : Crypto
Suggested usage : Short-term trading, when the market is in trend and it is showing high volatility .
Entry : When a Doji or Morning Doji Star formation occurs above the EMA60.
Exit : Profit target or Trailing stop, Stop loss on the lowest low of the last 100 candles.
Configuration :
- Doji Settings (tolerances) for Entry Condition
- Max Loss Filter (Lowest Low filter)
- Exit Long configuration
- Trailing stop
Backtesting :
⁃ Exchange: BINANCE
⁃ Pair: ALPINEUSDT
⁃ Timeframe: 30m
⁃ Fee: 0.075%
⁃ Slippage: 1
- Initial Capital: 10000 USDT
- Position sizing: 10% of Equity
- Start: 2022-02-28 (Out Of Sample from 2022-12-23)
- Bar magnifier: on
Disclaimer : Risk Management is crucial, so adjust stop loss to your comfort level. A tight stop loss can help minimise potential losses. Use at your own risk.
How you or we can improve? Source code is open so share your ideas!
Leave a comment and smash the boost button!
Thanks for your attention, happy to support the TradingView community.

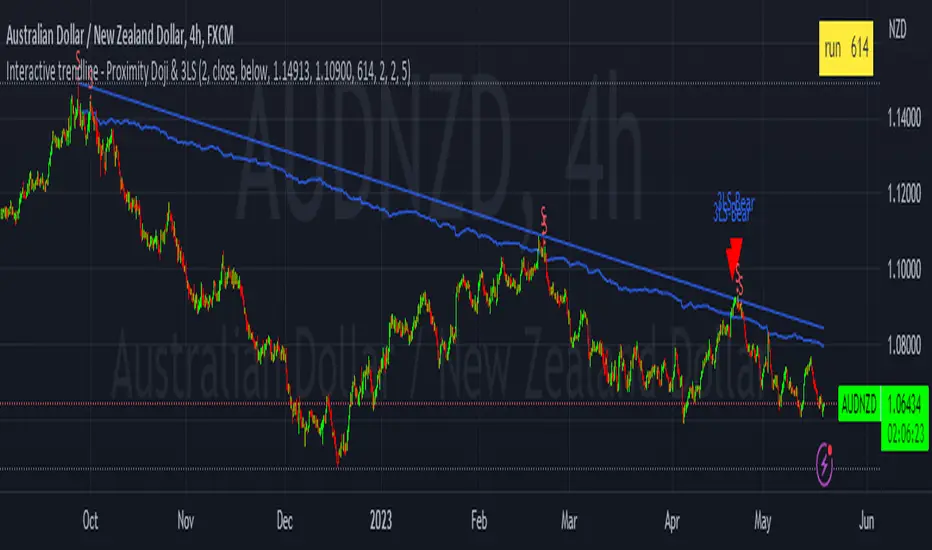
Interactive trendline - Proximity Doji & 3LSThis script was developed with Blockhead305 (seriously talented) and uses 1) the Three Line Strike from The Moving Average as well as 2) an original doji script written for me and 3) the Interactive Trendline as developed by Blockhead305. The basic premise is that should a doji or Three Line Strike occur within a customizable ATR distance from your trendline, an on-chart notification will appear or you could set an alarm to warn you if this has happened.
How to set this up:
Step 1 - Find a a trend
Step 2 - Identify the candles that touches the trendline
Step 3 - Click on the indicator
Step 4 - Set the X1 and Y1 coordinates for the start of the trend
Step 5 - Set the X2 and Y2 coordinates for the last relevant candle of the trend
Step 6 - Write the number in the yellow box down (in this case 880)
Step 7 - Open the settings of the indicator
Enter the number from the yellow box into the box titled "Run" - Press "OK"
Step 8 - Chart should/could now show Buy/Sell Signals for the Dojis and/or Bullish or Bearish Three Line Strikes
Notes
1. If your trendline is bearish (X1/Y1 is higher than X2/Y2) only bearish signals will appear and vice versa
2. You can change the ATR multiples from trendline in the settings - I prefer 2 (which is also the default)
3. You can toggle Big Engulfing and/or Three Line Strike on or off (exact functionality as per The Moving Average functionality)
4. You can construct the type of doji you would like to see at the bottom of the settings screen - I prefer the following settings:
Dominant Wick Multiple - 2
Recessive Wick Multiple - 2
Body Multiple - 5
5. I place my SL above last high (shorts) or last low (longs) but could also use the trendline for this
6. I use TP with RRR off 1:2 but much more is obviously possible.
7. ONLY ONE INTERACTIVE TRENDLINE CAN BE USED ON THE SAME CHART
8. THE NUMBER IN THE YELLOW BOX IS RELEVANT TO THE TIMEFRAME THAT THE TRENDLINE WAS CREATED ON. IF YOU CHANGE
TIMEFRAMES IT WILL NOT WORK
Happy to receive constructive criticism and/or suggestions for improvements on the settings.
Doji Pattern 1 Hr BY J.GrimanPatron de Doji de cuerpo real, para el periodo de tiempo en 1 Hora para los mercaods bursatiles.

DojiCandle body size RSI-SMMA filter MTF
DojiCandle body size RSI-SMMA filter MTF
Hi. I was inspired by a public script written by @ahmedirshad419, .
I thank him for his idea and hard work.
His script is the combination of RSI and Engulfing Pattern.
//------------------------------------------------------------
I decided to tweak it a bit with Open IA.
I have changed:
1) candle pattern to DojiCandle Pattern;
2) I added the ability for the user to change the size of the candlestick body;
3) Added SMMA 200;
4) Changed the colour of SMMA 200 depending on price direction;
5) Added a change in the colour of candlesticks, depending on the colour of the SMMA 200;
6) Added buy and sell signals with indicator name, ticker and close price;
7) Added ability to use indicator on multi time frame.
How it works
1. when RSI > 70 > SMMA 200 and form the bullish DojiCandle Pattern. It gives sell signal
2. when RSI < 30 < SMMA 200 and form the bearish DojiCandle Pattern. It gives buy signal
settings:
basic setting for RSI, SMMA 200 has been enabled in the script to set the levels accordingly to your trades
Enjoy

Minimalist Doji HighlighterThis minimalism focused indicator was designed specifically to highlight doji candles (gravestone, long-legged, and dragonfly) that generally signal indecision/neutrality within price structure to improve trading accessibility for the disabled/visually impaired, visual charting cues or pattern visibility, and educational/learning purposes.
HOW TO USE IT:
Highlight doji candles to improve visual cues on chart.
Default size of 0.15-0.02 works best, yet can be modified thus ensuring flexibility of use and experimentation.
Additionally, there is an option to add crosses above doji candles for additional visual cues; this feature is set to false by default to avoid cluttering charts.
MARKET USAGE:
All time frames and assets.
MARKET CONDITIONS:
All conditions.

Doji FinderModified version of HPotter's "Doji and Near Doji automatic finding script".
Candles are classified based on not just the size of the body but also the distance from the close to the high/low. This avoids classifying a reversal candle with a long wick but a strong close as a doji.

CANDLE FILTER Todays scripts is based on my Pullback And Rally Candles with other meaningful candles such as Hammers and Dojis.
You can choose which Candles to show on the cart and if you want to candles to appear above or below a moving average.
If you follow my work, you may recognise some of these candles which I'm about to show you however these candles are 1) more refined and 2) has moving average filters.
Ive included a D,6H,1H Candle in this script as on different timeframes - each swing low on average has a different amount of bars within the swing low / swing high so the DPB and RD will only work on the Daily
//Pullback candle
This candle is very powerful when used with simple Price Action such as Market Structure//Demand zones and support zones. (((((WORKS BEST IN UPTRENDS AND BOTTOM OF RANGES)))))
Ive included a D,6H,1H Pullback Candle in this script as on different timeframes - each swing low on average has a different amount of bars within the swing low so the DPB will only work on the Daily
//DAILY PULLBACK (Swing Traders)
snapshot
//4H PULLBACK (Swing Traders)
snapshot
- this signal will produce more signals due to the swing low filter on the 4H
//1H PULLBACK
snapshot
- this signal has been refined due to too many candle displaying in weak areas
!!!IF YOU DONT WANT TO USE PULLBACKS DURING DOWNTRENDS THEN USE THE EMA FILTER TO TURN OFF THE PULLBACKS WHEN PRICE IS BELOW THE MOVING AVERAGE!!!
//Rally candle (My personal Favourite) (((((WORKS BEST IN DOWNTRENDS AND TOP OF RANGES)))))
This candle is very powerful when used with simple Price Action such as Market Structure//Supply zones and Resistance zones.
//DAILY RALLY(Swing Traders)
snapshot
//4H RALLY(Swing Traders)
snapshot
- this signal will produce more signals due to the swing high filter on the 4H
!!!IF YOU DONT WANT TO USE RALLIES DURING UPTRENDSTHEN USE THE EMA FILTER TO TURN OFF THE RALLIES WHEN PRICE IS ABOVE THE MOVING AVERAGE!!!
//POWERFUL DOJIS (INDECISION)
snapshot
We look for indecision in key areas to see if momentum is shifting. When combined with Pullbacks or Rallys - this will enhance the odds of a probably area.
//HAMMERS
snapshot
//MOVING AVERAGES
snapshot
Short EMA = 50
Long EMA = 200
This filter can be used when the market is trending - look out for rejections off the moving averages
Also you can chance the Short And Long EMA to choose which MA cross you want to use
snapshot
ALSO ALL THE CANDLES HAVE A ALERT CONDITIONS WHICH YOU CAN ACCESS - THIS WILL ALERT ANY CANDLE YOU CHOOSE
Please leave a like/comment on this post as this is much appreciated....
