Ranges With Targets [ChartPrime]The Ranges With Targets indicator is a tool designed to assist traders in identifying potential trading opportunities on a chart derived from breakout trading. It dynamically outlines ranges with boxes in real-time, providing a visual representation of price movements. When a breakout occurs from a range, the indicator will begin coloring the candles. A green candle signals a long breakout, suggesting a potential upward movement, while a red candle indicates a short breakout, suggesting a potential downward movement. Grey candles indicate periods with no active trade. Ranges are derived from daily changes in price action.
This indicator builds upon the common breakout theory in trading whereby when price breaks out of a range; it may indicate continuation in a trend.
Additionally, users have the ability to customize their risk-reward settings through a multiplier referred to as the Target input. This allows traders to set their Take Profit (TP) and Stop Loss (SL) levels according to their specific risk tolerance and trading strategy.
Furthermore, the indicator offers an optional stop loss setting that can automatically exit losing trades, providing an additional layer of risk management for users who choose to utilize this feature.
A dashboard is provided in the top right showing the statistics and performance of the indicator; winning trades; losing trades, gross profit and loss and PNL. This can be useful when analyzing the success of breakout trading on a particular asset or timeframe.
E-signal

RMI Trend SniperThe "RMI Trend Sniper" is a powerful trend-following indicator designed to help traders identify potential buy and sell signals in the market.
It combines elements of the Relative Strength Index (RSI) and the Money Flow Index (MFI) to provide a comprehensive view of market momentum and strength.
🔷 Key Features:
🔹 Customizable Settings : Tailor the indicator to your trading preferences with customizable input parameters, including RSI and MFI lengths, threshold levels, and visual settings.
🔹 Momentum Signals : The indicator generates clear bullish and bearish momentum signals, allowing you to spot potential trend reversals or continuations.
🔹 The positive condition considers the previous RMI value, current RMI value, and positive change in the 5-period exponential moving average (EMA) of the closing price.
🔹 The negative condition looks at the current RMI value and negative change in the 5-period EMA.
🔹 Visual Bands : Visualize market volatility with dynamically plotted bands around the Range Weighted Moving Average (RWMA), providing insights into potential price fluctuations.
🔹 Candlestick Coloring : Easily identify bullish and bearish conditions with color-coded candlesticks, helping you make informed trading decisions.
The "RMI Trend Sniper" is a versatile tool suitable for traders of all experience levels. Whether you are a novice or an experienced trader, this indicator can help you enhance your technical analysis and improve your trading strategies.

Fibonacci Ranges (Real-Time) [LuxAlgo]The "Fibonacci Ranges" indicator combines Fibonacci ratio-derived ranges (channels), together with a Fibonacci pattern of the latest swing high/low.
🔶 USAGE
The indicator draws real-time ranges based on Fibonacci ratios as well as retracements. Breakouts from a Fibonacci Channel are also indicated by labels, indicating a potential reversal.
Each range extremity/area can also be used as support/resistance.
🔶 CONCEPTS
Fibonacci Channels
Latest Fibonacci
Both, Latest Fibonacci and Fibonacci Channels , display different Fibonacci levels (labels not included in the code):
However, the 2 react in a totally different way.
🔹 Fibonacci Channels
2 conditions must be fulfilled until a Fibonacci Channel is displayed:
New swing high/low
close has to be between chosen limits/levels ( Break level )
As visual guidance, chosen Break levels are accentuated by 2 small gray blocks:
Once the channel is displayed, it will remain visible until x consecutive bars break out of the chosen Break level at closing time.
• x consecutive bars is set by Break count .
The amount of breaks is counted in the code. When the price, without breaking the user-set limit, closes back between the 2 levels, the count is reset to 0.
By enabling Channels and Shadows you can see previous channels (" Shadows ", which is always delayed with 1 bar)
Previous channels can be helpful in finding potential support/resistance areas, especially from large channel blocks
The more narrow Break levels are set the less chance the price closes between these 2 levels, and the quicker close breaks out.
In other words, narrow levels give fewer & smaller channels, broader levels give more & larger channels.
Note:
• swing settings: L & R
• Break count (x consecutive bars that close outside chosen levels to invalidate the Fibonacci Channel )
will also be of influence in displaying the channels.
• Show breaks enable you to visualize signals when there is a break:
• Alerts can also be set ( Break Down / Break Up )
🔹 Latest Fibonacci
This displays the Fibonacci levels between the latest swing high and swing low, independently from the Fibonacci Channel .
The Lastest Fibonacci can be helpful in detecting the current trend against the larger Fibonacci Channel .
🔶 SETTINGS
🔹 Swing Settings
L: set left of pivothigh / pivotlow
R: set right of pivothigh / pivotlow
🔹 Fibonacci Channels
Channel : Channel / Channels + Shadows / None
Break level
-0.382 - 1.382
0.000 - 1.000
0.236 - 0.764
0.382 - 0.618
Break count
🔹 Fibonacci
Toggle
Colours: [ -0.382 - 0 ], [ 0.236 - 0.382 ], [ 0.5 ], [ 0.618 - 0.764 ], [ 1 - 1.382 ]

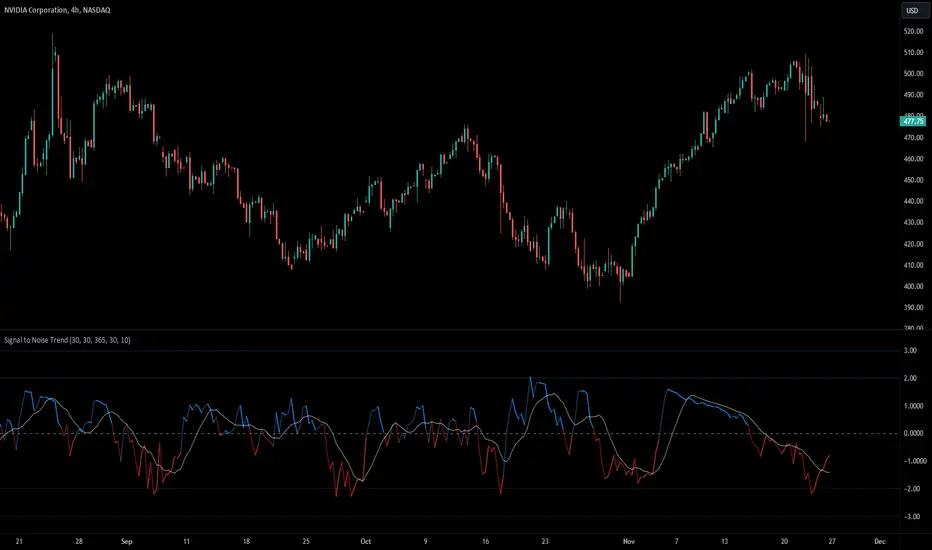
Signal to Noise TrendSignal to Noise Ratio
The Signal to Noise Ratio or SNR is used to assess the quality of information or data by comparing the strength of a useful signal to the presence of background noise or random variations.
In Finance the SNR refers to the ratio of strength of a trading signal to the background noise. A high SNR suggest a clear and reliable signal, meanwhile a low SNR indicates more noise (random fluctuations, volatility, or randomness).
Signal To Noise Trend
This indicator basically calculates the signal to noise of returns and then gets the Z-Score of the signal to noise ratio to find extremes levels of signal and noise. The Lines basically are standard deviations from the mean. 1,2,3 Are standard deviations same with the -1,-2,-3 Lines.
The signal is expressed as the positive Z-Score value, and the Noise is the negative Z-Score Value.
The moving average enhances the indicator ability to display the trend of returns and the trend strength. It provides a smooth representation of the Signal to Nose Ratio values.
There are more trending conditions when there is a higher signal, and there is more "ranging" conditions when there is more noise present in the markets.
The Standard deviations help find extreme levels of signal and noise. If the noise reaches the standard deviation of -3 then that means that there is a extreme negative deviation from the mean, and this would be a rare occurrence, with a lot of noise. This could indicate a potential reversion in market states, and could be followed by a trending move.
Another example is that if the Z-Score value reaches a Standard deviation of 3, this could mean that there is extremely strong and rare signal, and could potentially mean a change to a more noisy environment soon.
Signal ComposerThis Signal Composer script can compose existing signals from other "Signal Indicators" into one and can forward it to the "Template Trailing Strategy".
It allows the user to combine the logic of two signals and define the conditions that will trigger the start, end, cancel start, and cancel end deals of the produced signal. A signal will be composed from those user-defined conditions.
For example, one signal indicator may have the main logic and the other the filter logic. If you want to combine more signals you may add two Signal Composer scripts and pipe the output of the first composer to the second one.
This is the "main building block" of creating a bit more complex strategies without writing any code.
The "indicator on indicator" feature is needed so you can forward the resulting signal to the "Template Trailing Strategy" so that you can set take profits, stop losses, custom alerts, and all other nifty features this framework provides.
Thus, you should be a Plus or Premium user to get its full potential. It is very convenient for those who want to create a strategy without coding their own signal indicator and for those who want to fast-prototype various ideas based on simple but composable conditions.
It can nicely be combined with the "Signal Adapter" which combines simple (non-signal) indicators and produces a signal. This is a recipe to build fast and backtest more complex strategy logic.
This approach has a fail-fast mentality! Keep, in mind that you can code a single signal indicator with your composed logic later on only if the idea turns out to be "good enough".

Signal AdapterThis Signal Adapter script can compose a signal based on inputs from other simple (non-signal) indicators and can forwards it to the "Template Trailing Strategy".
It allows the user to combine up to eight external inputs and define the conditions that will trigger the start, end, cancel start and cancel end deals.
A signal will be composed from those user-defined conditions. The "indicator on indicator" feature is needed so you can forward the resulted signal to the "Template Trailing Strategy".
Thus you should be Plus or Premium user to get it's full potential. It is very convenient for those who want to create a strategy without coding their own signal indicator and for those
who want to fast prototype various ideas based on simple conditions.

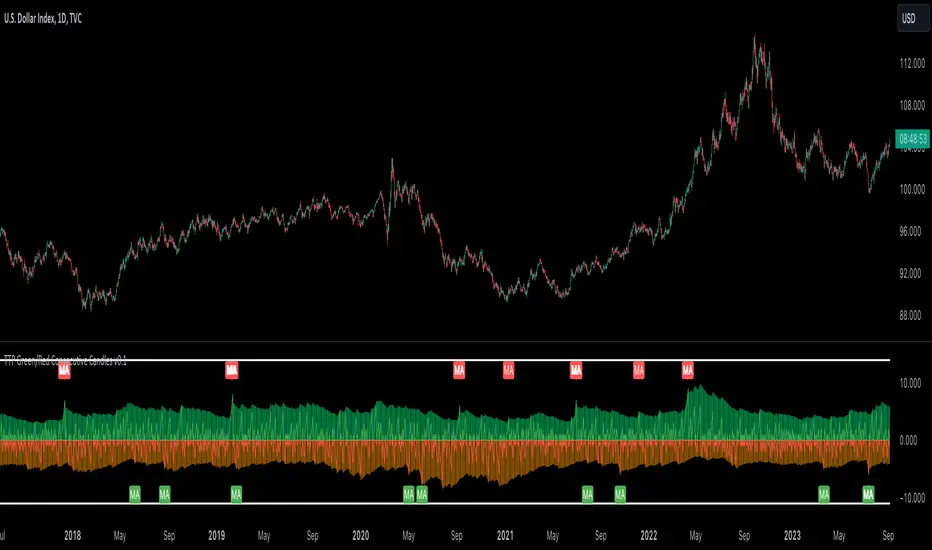
TTP Green/Red Consecutive CandlesThis indicator counts consecutive green/red candles offering some basic statistics and signals/alerts.
Features
- Counts consecutive green/red candles in an oscillator chart
- Moving average of the counting helps spotting when the consecutive candles are away from the mean. MA length and multiplier to adjust the signal sensitivity.
- Thresholds can be set to backtest and send alerts on any number of arbitrary consecutive candles of the same color.
- All time highs: the indicator keeps track of when the maximum has been reached
- Distribution data: the number of times each number of consecutive color candles has been reached is offered
Signals
- Threshold signal triggers when the number of candles of the same color is above the specified threshold.
- MA cross signal triggers when the number of candles of the same color is above the MA.
Smoothing ATR bandThere are two bands calculated with the ATR and I added "Smoothing" into the script.
Smoothing ATR with multiplier can display two bands above and below the price.
We can ONLY find some ATR bands in Community Scripts with "Basic" setting which is used to set Stop Loss.
And yet , Smoothing ATR with multiplier is capable of making traders manifestly recognize OverBought & OverSold.
FurtherMore, I added a condition with "plotshape", which is "Stop Hunt"
Stop Hunt is an absolutely usual strategy to clean the leverage and it always makes high volatility moves.
When high> above band and close< above band , long signal, it means it had been abundantly bought but the larger traders weren't satisfied; therefore, they quickly sold out to lower the price. The sell condition is on the contrary.
The signals mainly make traders manifestly recognize OverBought & OverSold.

Sublime Trading | Donchian Breakout SignalsWhat kind of traders/investors are we?
We are trend followers. Our scripts are designed to be used on the higher timeframes (weekly/daily) to catch the large moves/trends in the market.
Most have heard of long-term trend following. Few know how to execute the strategy.
Our scripts are designed specifically to identify and invest in long-term market trends.
What does this script do?
It produces entry signals in a confirmed bull and bear trend.
The logic is based on Donchian 20, which serves the following two purposes:
1. Confirms end-of-day entry points in a long-term trend
2. Filters out entry points in a sideways market
The signal is produced on a break and close of the Donchian 20 high in a bull trend and a break and close of the Donchian 20 low in a bear trend.
How is the entry price produced?
The entry is based on a percentage value of the range of the breakout bar added to the high of the bar in a bull trend.
In a bear trend, the percentage is subtracted from the low of the bar.
This gives an objective entry when placing a position once the OHLC of a bar is confirmed at the end of the trading day.
How is the stoploss price produced?
The script uses the formula ATR 15 x 4.
We use ATR as it produces a stoploss which is unique to the volatility of the asset. The more volatile the asset, the wider the stoploss.
We use ATR 15 as it brings an average reading across half a month, incorporating days of extreme volatility.
The multiplier 4 works well to avoid positions being stopped out prematurely on pullbacks.
When the stoploss is hit, there is when traders and investors may consider exiting positions.
What is the best timeframe to use the script?
We recommend the daily timeframe as this is where trader and investors identify and enter long-term market trends.
The higher timeframes are where traders and investors take fewer positions but hold for longer time periods.
As a result, trend followers place priority on the quality of the entry rather than quantity.
What makes this script unique?
This script has been coded specifically for the daily timeframe to:
Highlight the start of a potential long-term trends.
Confirm entry points at the end of the trading day, absorbing intraday noise.
Reduce fake breakouts in a trend.
Continue to create entry points as the trend develops to allow for compounding.
Filter out breakouts in a sideways market.
This entry signal script helps traders and investors focus on the quality of a potential position when investing in long-term market trends.

Parabolic SAR + EMA 200 + MACD SignalsParabolic SAR + EMA 200 + MACD Signals Indicator, a powerful tool designed to help traders identify optimal entry points in the market.
This indicator combines three popular technical indicators: Parabolic SAR (Stop and Reverse), EMA200 (Exponential Moving Average 200) and MACD (Moving Average Convergence Divergence) - to provide clear and concise buy and sell signals based on market trends.
The MACD component of this indicator calculates the difference between two exponentially smoothed moving averages, providing insight into the trend strength of the market. The Parabolic SAR component helps identify potential price reversals, while the EMA200 acts as a key level of support and resistance, providing additional confirmation of the overall trend direction.
Whether you're a seasoned trader or just starting out, the MACD-Parabolic SAR-EMA200 Indicator is a must-have tool for anyone looking to improve their trading strategy and maximize profits in today's dynamic markets.
Buy conditions
The price should be above the EMA 200
Parabolic SAR should show an upward trend
MACD Delta should be positive
ُSell conditions
The price should be below the EMA 200
Parabolic SAR should show an downward trend
MACD Delta should be negative

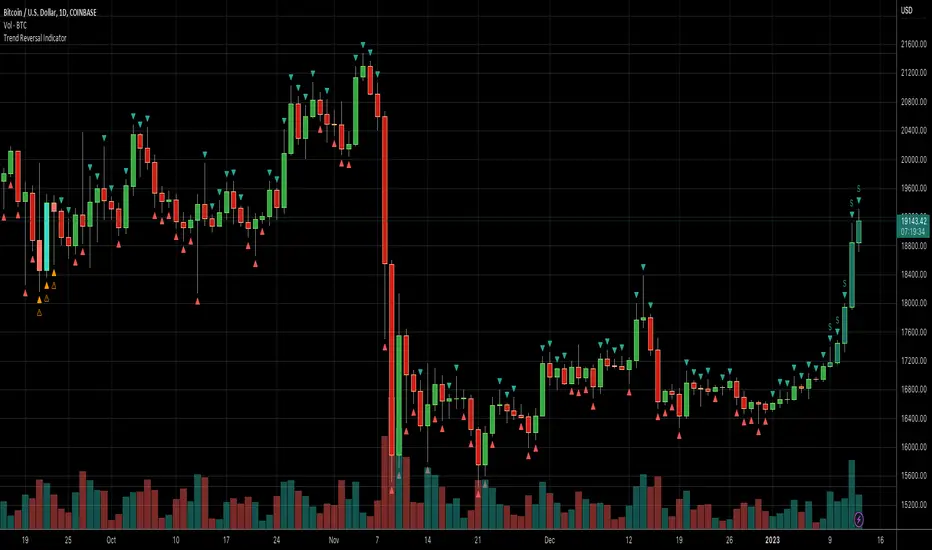
Reversal Signals [LuxAlgo]The Reversal Signals indicator is a technical analysis tool that aims to identify when a trend is fading and potentially starting to reverse.
As a counter-trend tool, the Reversal Signals indicator aims to solve the problem of several technical analysis indicators that perform well during trending markets but struggle in ranging markets. By understanding the key concepts and applications of the tool, traders can enhance their market timing and improve their trading strategies.
Note: It's important to explore the settings of the indicator to customize to your own usage & display as there are various options available as covered below.
🔶 USAGE
The Reversal Signals indicator is comprised of two main phases: Momentum Phase and Trend Exhaustion Phase . These phases help identify potential trend reversals in bullish, bearish, and ranging markets.
🔹The Momentum Phase
The momentum phase consists of a 9-candle count and in rare cases 8-candle count. In a bullish trend, a starting number ‘1’ is plotted if a candle closes higher than the close of a candle four periods ago. In a bearish trend, a starting number ‘1’ is plotted if a candle closes lower than the close of a candle four periods ago.
The following numbers are plotted when each successive candle satisfies the four-period rule. The potential reversal point comes when the Reversal Signals plot a label on top of a candle in a bullish trend or at the bottom of a candle in a bearish trend. The momentum phase is immediately canceled if, at any point, a candle fails to satisfy the four-period rule.
Based on the extremes of the momentum phase, the Reversal Signals generate support & resistance levels as well as risk/stop levels.
🔹 The Trend Exhaustion Phase
The trend exhaustion phase starts after completing the momentum phase and consists of a 13-candle count. In a bullish trend exhaustion phase, each candle’s close is compared to the close of two candles earlier, and the close must be greater than the close two periods earlier. In a bearish trend exhaustion phase, each candle’s close is compared to the close of two candles earlier, and the close must be lower than the close two periods earlier.
The trend exhaustion phase does not require a consecutive sequence of candles; if the order of candles is interrupted, the trend exhaustion phase is not canceled. The trend exhaustion phase generates stronger trading signals than the momentum phase, with the potential for longer-lasting price reversals.
🔹 Trading Signals
The Reversal Signals script presents an overall setup and some phase-specific trade setup options, where probable trades might be considered. All phase-specific trade setups, presented as options, are triggered once the selected phase is completed and followed by a price flip in the direction of the trade setup.
Please note that those setups are presented for educational purposes only and do not constitutes professional and/or financial advice
- Momentum: Enter a trade at momentum phase completion, and search for buy (sell) when the bullish (bearish) momentum phase pattern is complete. Ideally, the momentum phase completion should close near its support/resistance line but shall not be above them, which indicates continuation of the trend
- Exhaustion: Enter a trade on trend exhaustion phase completion, and search for buy (sell) when the bullish (bearish) trend exhaustion phase is complete
- Qualified: Buy (sell) when a bullish (bearish) trend exhaustion phase combined with another bullish (bearish) momentum phase sequence is complete
Long trade setups are presented with "L" label and short trade setups with "S" label, where the content of the label displays details related to the probable trade opportunity
Once a phase-specific trade setup is triggered then the Reversal Signals script keeps checking the status of the price action relative to the phase-specific trade setups and in case something goes wrong presents a caution label. Pay attention to the content of the caution labels as well as where they appear. A trade signal, followed immediately by a warning indication can be assumed as a continuation of the underlying trend and can be traded in the opposite direction of the suggested signal
It is strongly advised to confirm trading setups in conjunction with other forms of technical and fundamental analysis, including technical indicators, chart/candlestick pattern analysis, etc.
🔶 DETAILS
The Reversal Signals script performs the detection of the phases by counting the candlestick meeting the specific conditions, which includes:
- Detection of the 8th and 9th candle perfection during the momentum phase
- In some cases, the 8th count will be assumed as momentum phase completion
- Trend exhaustion phase counting stops in case any type of momentum phase completion is detected during the counting process
- Postponing the last count of the trend exhaustion phase, the 13th candle must be below/above the 8th candle and if not the candles will be indicated with '+' sign under them and the script continues to search for a 13th candle at the next ones until the conditions are met
🔶 ALERTS
When an alert is configured, the user will have the ability to be notified in case;
Momentum / Trend Exhaustion phase completion
Support & Resistance level cross detection
Stop / Risk level cross detection
Long / Short Trade Setups are triggered
Please note, alerts are available with 'any alert() function call' and the alerts will be received only for the features that are enabled during alert configuration
🔶 SETTINGS
🔹 Momentum Phase
Display Phases: displays the momentum phases, where the Completed option allows the display of only completed momentum phases. The detailed option allows the display of the entire process of the momentum phase processes
Support & Resistance Levels: Toggles the visibility of the Support & Resistance Levels and Line Styling options
Momentum Phase Risk Levels: Toggles the visibility of the momentum phase Stop/Risk Levels and Line Styling options
For color options please refer to the options available under the style tab
🔹 Trend Exhaustion Phase
Display Phases: displays the trend exhaustion phases, where the Completed option allows the display of only completed trend exhaustion phases. The detailed option allows the display of the entire process of the trend exhaustion phase processes
Trend Exhaustion Phase Risk Levels: Toggles the visibility of the trend exhaustion phase Stop/Risk Levels
Trend Exhaustion Phase Target Levels: Toggles the visibility of the trend exhaustion phase Target Levels
For color options please refer to the options available under the style tab
🔹 Trade Setups
Overall Trend Direction & Trade Setup: displays the overall trend and probable trade setup levels, the users should search for a price flip and confirm with other means of technical and fundamental analysis for the trade setups once the label is plotted
Phase-Specific Trade Setup Options
Momentum: Searches for a trade setup after momentum phase completion
Exhaustion: Searches for a trade setup after trend exhaustion phase completion, stronger trend reversal possibility compared to momentum phase setup
Qualified: Searches for a trade setup after the trend exhaustion phase followed by a momentum phase completion
None: No trade setups are presented
Price Flips against the Phase Specific Trade Setups: enables checking the price action relative to the phase-specific trade setups
🔶 RELATED SCRIPTS
Here are the scripts that may add additional insight during potential trading decisions.
Buyside-Sellside-Liquidity
Support-Resistance-Classification

Oscillator buy and sellThe oscillator in the provided script is a custom indicator designed to help identify choppy market conditions and generate buy and sell signals based on the direction of the price movement. It is derived from the ATR (Average True Range) and the percentage of the ATR relative to the closing price. When the ATR percentage is below the specified threshold, the market is considered choppy. In this script, the oscillator has a value of 1 when the closing price is higher than the opening price, and -1 when the closing price is lower than the opening price.
How to use the buy and sell signals:
1. Buy Signal: When the oscillator transitions from a negative value to a positive value, a buy signal is generated. This indicates that the price is moving upwards, and it might be a good opportunity to enter a long position. A green arrow will appear below the candlestick where the buy signal is generated.
2. Sell Signal: When the oscillator transitions from a positive value to a negative value, a sell signal is generated. This indicates that the price is moving downwards, and it might be a good opportunity to enter a short position or close an existing long position. A red arrow will appear above the candlestick where the sell signal is generated.
It is essential to remember that this oscillator is a simple tool and should not be solely relied upon for making trading decisions. It is recommended to use this oscillator in conjunction with other technical analysis tools and indicators to improve the accuracy of your trading decisions. Additionally, always consider your risk tolerance and trading strategy before entering or exiting trades.

Long & Short / Bullish & Bearish & Neutral / Sentiment LONG and SHORT signal generation:
The LONG and SHORT signals in this script are generated based on a combination of sentiment, price strength, and volume strength calculations. The following parameters and calculations are used in determining these signals:
Sentiment:
The sentiment is calculated using a Simple Moving Average ( SMA ) of the SMO (oscillator) over a specified sentiment_length.
Price Strength:
The price strength is calculated as the percentage change in the closing price compared to the previous closing price.
Volume Strength:
The volume strength is calculated as the percentage change in the trading volume compared to the previous trading volume .
Custom Oscillator:
This oscillator is calculated as the difference between price strength and volume strength, followed by calculating its SMA over a specified strength_length.
The LONG signal is triggered when:
The sentiment_diff (difference between the oscillator and the SMA oscillator) is greater than 0, and the close price is greater than the fast EMA ( Exponential Moving Average ) of the close price, OR
The custom oscillator crosses over its SMA , and the close price is greater than the open price, and the close price of the previous period is greater than the close price of two periods ago.
The SHORT signal is triggered when:
The sentiment_diff is less than 0, and the close price is less than the fast EMA of the close price, OR
The custom oscillator crosses under its SMA , and the close price is less than the open price, and the close price of the previous period is less than the close price of two periods ago.
Color change description:
The color change in this script is based on the relationship between the close price and the highest/lowest SMAs of the high/low price over a specified lengthInputRoR. The following colors are used:
Green:
Bullish area (close price is greater than the highest SMA of the high price)
Red:
Bearish area (close price is less than the lowest SMA of the low price)
Yellow:
Neutral area (close price is between the highest and lowest SMAs of the high and low prices)
Color meaning description:
Yellow (Neutral Area):
This color indicates that the close price is between the highest and lowest SMAs of the high and low prices, signaling more caution and uncertainty in the market.
Green ( Bullish Area):
This color represents a bullish market condition where the close price is greater than the highest SMA of the high price, suggesting a higher probability of a successful LONG position.
Red ( Bearish Area):
This color signifies a bearish market condition where the close price is less than the lowest SMA of the low price, indicating a higher probability of a successful SHORT position.
Support and Resistance lines explanation:
Support and resistance lines are calculated based on the highest and lowest prices over a specified number of periods. These lines are used to identify significant price levels where the market may experience increased buying or selling pressure.
Resistance:
The resistance line is calculated using the highest high price over a specified number of periods. This line represents a price level where selling pressure is expected to increase, making it more difficult for the price to rise further. Traders often consider resistance levels as potential entry points for SHORT positions or exit points for LONG positions.
Support:
The support line is calculated using the lowest low price over a specified number of periods. This line represents a price level where buying pressure is expected to increase, making it more difficult for the price to fall further. Traders often consider support levels as potential entry points for LONG positions or exit points for SHORT positions.
The resistance and support lines are plotted using different colors to help traders visualize the important price levels where the market may experience a reversal or consolidation.
Final Words:
This script provides LONG and SHORT signals and alerts based on a combination of sentiment, price strength, and volume strength calculations. It is designed to serve as a high-quality aid for executing well-informed trading ideas. However, it's important to note that the LONG and SHORT signals and alerts generated by this script should not be considered as trading advice. Traders should always conduct their own research and analysis before making any trading decisions. The script aims to assist in visualizing important market trends and price levels, helping traders make more informed decisions based on their personal trading strategies.
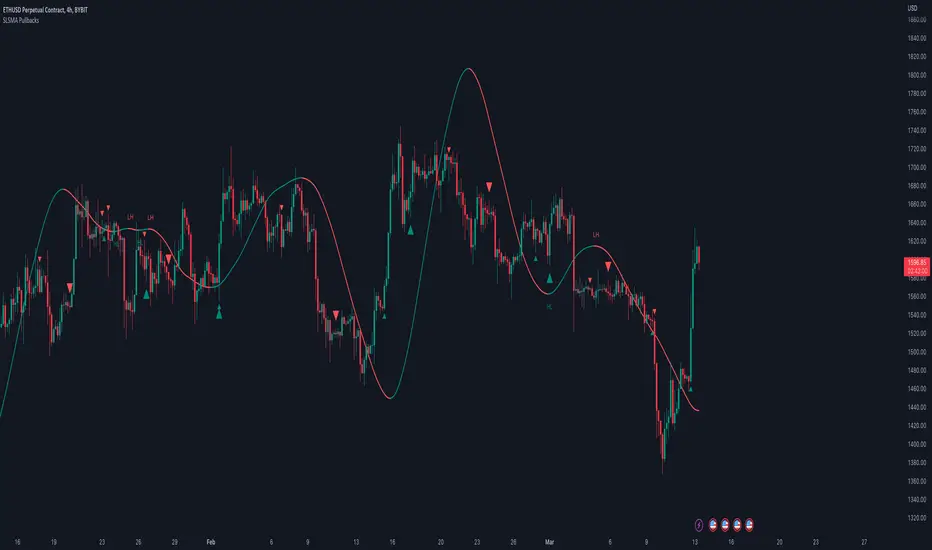
SLSMA PullbacksThis script picks up two types of pullbacks using the SLSMA line. The pb1 signal picks up a fast first pullback as price action breaks the SLSMA line. The pb2 signal detects a stronger pivot with the trend. There is an option to filter pb1 signals with trend in the settings. Lower highs and Higher lows are displayed as labels along the SLMSA line. This tool can be overlaid on your chart or over an indicator using it as its external source.
DojiCandle body size RSI-SMMA filter MTF
DojiCandle body size RSI-SMMA filter MTF
Hi. I was inspired by a public script written by @ahmedirshad419, .
I thank him for his idea and hard work.
His script is the combination of RSI and Engulfing Pattern.
//------------------------------------------------------------
I decided to tweak it a bit with Open IA.
I have changed:
1) candle pattern to DojiCandle Pattern;
2) I added the ability for the user to change the size of the candlestick body;
3) Added SMMA 200;
4) Changed the colour of SMMA 200 depending on price direction;
5) Added a change in the colour of candlesticks, depending on the colour of the SMMA 200;
6) Added buy and sell signals with indicator name, ticker and close price;
7) Added ability to use indicator on multi time frame.
How it works
1. when RSI > 70 > SMMA 200 and form the bullish DojiCandle Pattern. It gives sell signal
2. when RSI < 30 < SMMA 200 and form the bearish DojiCandle Pattern. It gives buy signal
settings:
basic setting for RSI, SMMA 200 has been enabled in the script to set the levels accordingly to your trades
Enjoy

[TTI] Whaley Breadth Thrust––––History & Credit
The Whaley Breadth Trust is a powerful signal that has a great success rate. It was invented by Wayne Whaley in 2009. Since 1970 to 2009, the signal has occured only 12 times!
–––––What it does
The indicator uses 3 conditions.
Condition 1: The Advancing and Declining NYSE stocks
Condition 2: The Up and Down volume
Condition 3:The absolute price increase in the SP500
It calculates different ratios and determine bullish or bearish setting based on this.
When only conditions 1 and 2 are present, we call this a Light Thrust. When all 3 conditions have occured then we call this Full Thrust.
–––––How to use it
Consider very bullish signal when you see this.
The light thrust occured on 12JAN23 on the SPX.
The signal occured in the following years: 1974, 1982, 1987, 2002, 2008

Buy Sell Signal ScannerThis is a higher timeframe scanner that detects whether the market is bullish or bearish according to our Buy Sell Indicator on up to 8 different timeframes. It can also be customized to scan different tickers so you can scan tickers that typically move with or against the ticker you are trading for extra confirmation. The scanner can be configured to use the exact same settings that you use with the Buy Sell Indicator so everything is using the same formula.
For price action identification, scalp mode looks at the candle body, candle wicks and size of the body and wicks and compares all of that to the previous candle to see if it is bullish or bearish. Swing mode will compare the current candle to the last 2 candles and long swing mode will compare the current candle to the last 10 candles. It’s looking for higher highs & lower lows, if the candle body is large or small and much more.
There are also filters that prevent signals from being given when the candle is small or has not made a higher high or lower low compared to the previous candle and multiple other filters to help hold positions longer. Once the price action direction has been confirmed, then the script looks at a massive amount of other calculations to determine if a signal should be given or not. These calculations are made up of all of my best indicators combined into a master signal generator as well as more new calculations from things I have learned over time and tested extensively that have not been made available to the public until now.
Price action as well as many other factors will all have to be confirming the direction before a signal can come in, but it reacts very quickly so it can give early signals at the first sign of reversal. Fine tune your settings to match your Buy Sell Indicator settings to get the same signals on the scanner.
HOW TO USE
The scanner will show the higher timeframe in a table on the side of the chart if no other ticker is selected to scan. The timeframe cell will show as green if that timeframe is currently in a bullish signal and red if that timeframe is currently in a bearish signal. If you set it to use a different ticker, the ticker name and timeframe will show up in the table.
The defaults are set up to scan the same ticker as your chart but on higher timeframes. It is set up for a 1 minute chart by default, but each timeframe can be adjusted to suit your preference all the way up to a 1 year timeframe.
You can set the scanner to look at different tickers as well which is very useful for getting confirmation by setting it to scan other tickers that usually move in the same direction or opposite of the ticker you are trading.
TRADE MODE
The signal settings allow you to match the scanner settings to your settings on the Buy Sell Indicator. There is scalp mode, swing mode and long swing mode. All 3 settings use the same calculations for signals, but they have different price action filters to help hold swings longer. Scalp mode will only be looking at the current bar compared to the previous bar, but swing mode will look at the current bar compared to the previous 2 candles. Long swing mode will compare the current candle to the last 10 candles to hold positions even longer.
There is also a candle trailing length that can be adjusted as well to suit your preference. This adds a filter that ensures the current candle is closing higher than the previous X number of candles you choose for a bull signal and is closing lower than X number of previous candles for a bear signal. Make sure to match these settings to how your Buy Sell Indicator is configured to get matching results.
You can also move the position of the scanner table to any part of the chart in the settings menu at the bottom.
ALERTS
There are alerts set up that will give you a signal when all timeframes are bullish on candle close and another signal that will alert when all timeframes are bearish on candle close. There is also an alert for when the first 4 timeframes & ticker are bullish and the last 4 timeframes & ticker are bearish or the opposite. This is useful for looking at forex markets and setting the first 4 to tickers that move together and the last 4 to tickers that move opposite.
MARKETS
This Buy Sell Signal Scanner can be used on any market with price data such as stocks, crypto, forex and futures.
TIMEFRAMES
This Buy Sell Signal Scanner can be used on any timeframe. And will scan any of our available timeframes between 1 minute and 1 year.
PAIRINGS
We recommend pairing this Buy Sell Signal Scanner with our Buy Sell Indicator so you can get signals and price action colored candles on the ticker you are trading and then use the scanner for confirmation of trend on higher timeframes and trade with the trend.

Buy Sell IndicatorThis Buy Sell Indicator uses price action calculations to determine the bullish or bearish nature of the current market and then calculates if the price action is strong enough to give a signal. The indicator is fully adjustable so you can fine tune it to fit your specific trading style with Scalp Mode, Swing Mode, Long Swing Mode and candle trailing length. It also has an automatic trailing stop loss and take profit features that can be customized.
For price action identification, scalp mode looks at the candle body, candle wicks and size of the body and wicks and compares all of that to the previous candle to see if it is bullish or bearish. Swing mode will compare the current candle to the last 2 candles and long swing mode will compare the current candle to the last 10 candles. It’s looking for higher highs & lower lows, if the candle body is large or small and much more.
There are also filters that prevent signals from being given when the candle is small or has not made a higher high or lower low compared to the previous candle and multiple other filters to help hold positions longer. Once the price action direction has been confirmed, then the script looks at a massive amount of other calculations to determine if a signal should be given or not. These calculations are made up of all of my best indicators combined into a master signal generator as well as more new calculations from things I have learned over time and tested extensively that have not been made available to the public until now.
Price action as well as many other factors will all have to be confirming the direction before a signal can come in, but it reacts very quickly so it can give early signals at the first sign of reversal. Fine tune your settings to match your trading style from within the input settings and then look for potential reversal areas and take signals that appear in that reversal area for the highest probability of winning trades. I decided not to include any support or resistance or similar tools in order to keep the indicator lightweight and respond as fast as possible as well as update the candles as quickly as possible. This also lets you keep your charts clean and only use the support & resistance tools that you prefer since everyone has a different trading style.
HIGHER TIMEFRAME AND/OR MARKET SCANNER
There is also a higher timeframe scanner available as a separate indicator titled Buy Sell Signal Scanner that you can find on my profile. It can be customized to show you up to 8 higher timeframes of your current ticker or any other ticker you like. This is useful for trading with the trend of the higher timeframes or you can set it to the same timeframe as your chart and scan other tickers that usually move together or opposite for extra confirmation. Each ticker/timeframe will be displayed in a table on the chart and colored green or red depending if it is currently bullish or bearish. If you are using a different timeframe than the current chart, then it will display the timeframe next to the ticker name.
HOW TO USE
CANDLES
The candles will paint blue or orange according to the price action detected. This can be customized or turned on/off and will follow the price action according to the trade mode settings. Using these candle colors helps to get rid of anxiety when watching candles come in that are in the opposite direction of your trade. I highly recommend using this feature as it helps you control your emotions much better during trading.
TRADE MODE
The trade mode settings let you choose between Scalp Mode, Swing Mode and Long Swing mode. They all use the same price calculations, but each mode has its own filters to hold through ranging price action in a slightly different way. You can also adjust the candle trailing length to make it hold positions even longer. The candle trailing length will not let a signal come in until there is a higher high or lower low than the previous X number of candles from this setting.
Scalp mode will get you in and out of positions the earliest. Swing mode will hold signals longer by filtering out ranging price action. Long swing mode uses even more filtering to hold positions even longer than swing mode and let price range more without calling out every move. Each one of these modes will also be affected by the candle trailing length.
It should be noted that using swing mode and long swing mode or increasing the candle trailing length will make the signals not perform as well when price action is whipsawing up and down and also will not have as early of entries and exits as scalp mode due to the range breaks that are needed for a signal to be given. That being said, it will hold positions much longer when markets are trending and still have great entries and exits, so use the longer settings when markets are trending and then switch to scalp mode when the market is chopping around and moving sideways for best results.
Scalp Mode
Swing Mode
Long Swing Mode
STOPLOSS
There is an automatic stoploss feature as well. It calculates the average candle height and adds/subtracts that from the highest high or lowest low of the past X number of candles according to your Stoploss Candle Trail Length. Use a lower number for a tight trailing stoploss and increase the number for a more loose stoploss. You can also customize the color of the stoploss line and label or turn it off if you prefer. The stoploss will update on every candle for proper trailing but it will not switch to an opposing signal until the candle closes with a new signal.
TAKE PROFIT
There is an automatic take profit level generator as well that also uses the average candle height for its calculations. There are 3 settings that let you set the average candle size multiplier for each take profit level. The default settings are evenly spaced at 3, 6 and 9 times the average candle height from where the most recent signal locked in at candle close. Adjust these numbers to suit your preference. You can also customize the color of the take profit lines and label or turn it off if you prefer. The take profit levels will not change to an opposing signal until the opposing signal is confirmed on the candle close.
Auto Stoploss & Take Profit
SIGNALS
The default signals are green and red arrows. The color can be adjusted in the settings or you can turn the bull or bear signals on or off if you only want entry signals for the direction of the trend.
VOLUME SPIKE SUPPORT & RESISTANCE
There are volume based auto support & resistance levels that are off by default, but can be turned on in the settings. It calculates the average volume over multiple periods and gets the average of that and then looks for volume spikes that were greater than the average, multiplied by the volume spike multiplier in the settings. If set to 3, then the volume spike will need to be 3 times or higher than the average volume bar for a level to show up. Increase or decrease this number to get more or less levels.
VOLUME WARNING
If volume is very low compared to normal, then a volume warning label will appear at the top of the chart letting you know that volume is very low and to trade with caution. I recommend not trading during those times though as price can whipsaw very easily.
ALERTS
There are also alerts that can be triggered for buy signals as well as sell signals. They are set to only send signals when the bar is confirmed so you won’t get alerts for signals that repaint while the candle is still open. You can use these alerts to send signals to your own trading bot if you choose to.
MARKETS
This buy sell indicator can be used on any market with price data such as stocks, crypto, forex and futures.
TIMEFRAMES
This buy sell indicator can be used on any timeframe.
PAIRINGS
We recommend pairing this Buy Sell Indicator with our Buy Sell Signal Scanner so you can check other timeframes and trade with the trend or use the scanner to look at other markets that move together or opposite of the ticker you are trading for extra confirmation of direction.

Signal ViewerThe "Signal Viewer" script is a debugging tool that can be used for the signal of a Signal Indicator script like the "Two MA Signal Indicator" or the "Template Signal Indicator". This script will visualize the signal based on the convention that was defined in the settings. Also, alerts will be produced based on this convention. It's useful to be used before you connect the signal indicator script to a template strategy like the "Template Trailing Strategy" script. You can cross-validate the correctness of the signal that the indicators emit and make sure it is aligned with the expected behavior after the decomposition of the signal using the convention described in the settings. Please make sure that the connection in the "Signal Viewer" script matches the convention used by the template strategy script.

Strength Index I2-SIIdea:
Enhance the Stoch RSI with DMI to get the visualization of the strength movement.
Concept:
(Note that we take the close to get the closing price).
-Combination of 2 Stoch RSI (using value K): 1 is UP, 1 is DOWN (these settings have been customized).
-Every time they cross, it calculates the direction of 3 nearly previous crossings to get the color of the current line.
-The value has been re-calculated with the processed value from ADX and DI- (That's why it can be more than 100 or -100 in some cases).
-RSI Overbuy and oversell are removed because the value could be beyond it.
How it works:
1. The line is show as the strength index of bars
- Green means the up strength is strong.
- Red means the down strength is strong.
- Gray means the previous strength is getting week.
2. This one can be used to find divergence.
3. This indicator provides a warning signal when the color of the line changes:
- Change color:
+Turn red: "Down Red"
+Turn green: "Up Green"
+Turn gray: "Down Gray"/"Up Gray"
Suitable time frames:
15m, 4h, 1D, 1W
* Please note that this logic does not attempt to predict future prices or 100% accurate signal.
(INVITE ONLY indicator. Please direct message or visit website if you want to try it out)
Hope you guys enjoy!
Examples:
BTCUSD 1D
XAUUSD 4H
EURUSD 1H
SPX 15m

Daily Number/Trend Reversal IndicatorIndicator identifies potential price trend exhaustion.
Compares this period against the 4th prior period for the condition.
9 periods (or more) with the same condition is an indicator that the trend is ending soon.
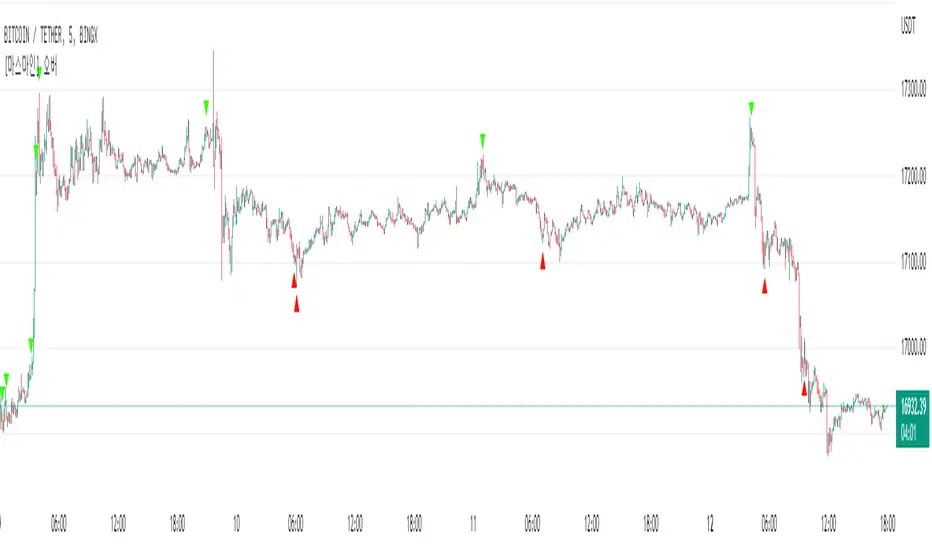
MarsMine_OverThis indicator marks the area where the overbought/oversold section of the Stochastic RSI and the overbought/oversold section of the RSI overlap with arrows.
If an upward arrow appears on the indicator, it can be recognized that both StoRSI and RSI have entered the oversold zone.
When a down arrow appears, both the StoRSI and RSI can be considered to have entered the overbought zone.
This is a good signal to identify the direction of the future trend.
이 지표는 Stochastic RSI의 과매수/과매도 구간과 RSI의 과매수/과매도 구간이 겹치는 구간을 화살표로 표기 해주는 지표 입니다.
해당 지표에서 상승 화살표가 출현할 경우에는 StoRSI와 RSI 모두 과매도 구간에 진입했다고 인식할 수 있으며,
하락 화살표가 출현할 경우에는 StoRSI와 RSI 모두 과매수 구간에 진입했다고 인식할 수 있습니다.
이는 추후 추세의 방향성을 파악할 수 있는 좋은 시그널 입니다.
Band of Filtered RS by Mustafa ÖZVERBand of Filtered RS by Mustafa ÖZVER
This code shows a range (max-min values) price may get if we get strong movements. These values is based on RSI (Relative Strange Index). And also these are calculated using RSI, if we get trades to make rsi is equal to 25 (or rsi down limit) or 75 (rsi up limit) or any value you set, how much will price value get? This code calculate these and shows these to you on graph.
This price are between these band limits because we expect cross reaction to hard movements on price.
For scalping, we can use these values as
long signal when price under down limit,
short signal when price over up limit,
But only these values can not guarantee good results for trading. BE CAREFUL
