EMA Trend Dashboard
Trend Indicator using 3 custom EMA lines. Displays a table with 5 rows(position configurable)
-First line shows relative position of EMA lines to each other and outputs Bull, Weak Bull, Flat, Weak Bear, or Bear. EMA line1 should be less than EMA line2 and EMA line 2 should be less than EMA line3. Default is 9,21,50.
-Second through fourth line shows the slant of each EMA line. Up, Down, or Flat. Threshold for what is considered a slant is configurable. Also added a "steep" threshold configuration for steep slants.
-Fifth line shows exhaustion and is a simple, configurable calculation of the distance between EMA line1 and EMA line2.
--Lines one and five change depending on its value but ALL other colors are able to be changed.
--Default is somewhat set to work well with Micro E-mini Futures but this indicator can be changed to work on anything. I created it to help get a quick overview of short-term trend on futures. I used ChatGPT to help but I am still not sure if it actually took longer because of it.
Emacross

Smoothed EMA LinesThe "Smoothed EMA Lines" script is a technical analysis tool designed to help traders identify trends and potential support/resistance levels in financial markets. The script plots exponential moving averages (EMAs) of the closing price for five commonly used time periods: 8, 13, 21, 55, and 200.
Key features of the script include:
Overlay: The EMAs are plotted directly on the price chart, making it easy to analyze the relationship between the moving averages and price action.
Smoothing: The script applies an additional smoothing function to each EMA, using a simple moving average (SMA) of a user-defined length. This helps to reduce noise and provide a clearer picture of the trend.
Customizable lengths: Users can easily adjust the length of each EMA and the smoothing period through the script's input parameters.
Color-coded plots: Each EMA is assigned a unique color (8: blue, 13: green, 21: orange, 55: red, 200: purple) for easy identification on the chart.
Traders can use the "Smoothed EMA Lines" script to:
Identify the overall trend direction (bullish, bearish, or neutral) based on the arrangement of the EMAs.
Spot potential support and resistance levels where the price may interact with the EMAs.
Look for crossovers between EMAs as potential entry or exit signals.
Combine the EMA analysis with other technical indicators and price action patterns for a more comprehensive trading strategy.
The "Smoothed EMA Lines" script provides a clear, customizable, and easy-to-interpret visualization of key exponential moving averages, helping traders make informed decisions based on trend analysis.

Market Trend Levels Detector [BigBeluga]Market Trend Levels Detector is an trend-following tool that utilizes moving average crossovers to identify key market trend levels. By detecting local highs and lows after EMA crossovers, the indicator helps traders track significant price zones and trend strength.
🔵 Key Features:
EMA Crossover-Based Trend Levels Detection:
Uses a fast and slow EMA to detect market flow shifts.
When the fast EMA crosses under the slow EMA, the indicator searches for the most recent local top and marks it with a label and horizontal level.
When the fast EMA crosses over the slow EMA, it searches for the most recent local low and marks it accordingly.
Dynamic Zone Levels:
Each detected high or low is plotted as a horizontal level, highlighting important price zones.
Traders can extend these levels to observe how price interacts with them over time.
If price crosses a level, its extension stops. Uncrossed levels continue expanding.
Gradient Trend Band Visualization:
The trend band is formed by shading the area between the two EMAs.
Color intensity varies based on volatility and trend strength.
Strong trends and high volatility areas appear with more intense colors, making trend shifts visually distinct.
🔵 Usage:
Trend Identification: Use EMA crossovers and trend bands to confirm bullish or bearish momentum.
Key Zone Mapping: Observe local high/low levels to track historical reaction points.
Breakout & Rejection Signals: Monitor price interactions with extended levels to assess potential breakouts or reversals.
Volatility Strength Analysis: Use color intensity in the trend band to gauge trend power and possible exhaustion points.
Scalping & Swing Trading: Ideal for both short-term scalping strategies and larger swing trade setups.
Market Trend Levels Detector is a must-have tool for traders looking to track market flow, key price levels, and trend momentum with dynamic visual cues. It provides a comprehensive approach to identifying high-probability trade setups using EMA-based flow detection and trend analysis.

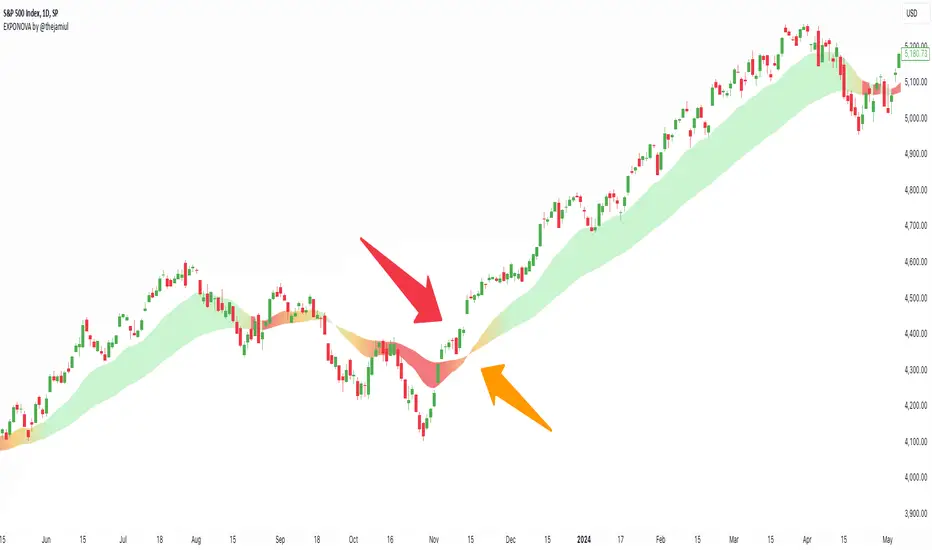
EXPONOVA by @thejamiulEXPONOVA is an advanced EMA-based indicator designed to provide a visually intuitive and actionable representation of market trends. It combines two EMAs (Exponential Moving Averages) with a custom gradient fill to help traders identify trend reversals, strength, and the potential duration of trends.
This indicator uses a gradient color fill between two EMAs—one short-term (20-period) and one longer-term (55-period). The gradient dynamically adjusts based on the proximity and relationship of the closing price to the EMAs, giving traders a unique visual insight into trend momentum and potential exhaustion points.
Key Features:
Dynamic Gradient Fill:
The fill color between the EMAs changes based on the bar's position relative to the longer-term EMA.
A fading gradient visually conveys the strength and duration of the trend. The closer the closing price is to crossing the EMA, the stronger the gradient, making trends easy to spot.
Precision EMA Calculations:
The indicator plots two EMAs (20 and 55) without cluttering the chart, ensuring traders have a clean and informative display.
Ease of Use:
Designed for both novice and advanced traders, this tool is effective in identifying trend reversals and entry/exit points.
Trend Reversal Detection:
Built-in logic identifies bars since the last EMA cross, dynamically adjusting the gradient to signal potential trend changes.
How It Works:
This indicator calculates two EMAs:
EMA 20 (Fast EMA): Tracks short-term price movements, providing early signals of potential trend changes.
EMA 55 (Slow EMA): Captures broader trends and smoothens noise for a clearer directional bias.
The area between the two EMAs is filled with a dynamic color gradient, which evolves based on how far the price has moved above or below EMA 55. The gradient acts as a visual cue to the strength and duration of the current trend:
Bright green shades indicate bullish momentum building over time.
Red tones highlight bearish momentum.
The fading effect in the gradient provides traders with an intuitive representation of trend strength, helping them gauge whether the trend is accelerating, weakening, or reversing.
Gradient-Filled Region: Unique visualization to simplify trend analysis without cluttering the chart.
Dynamic Trend Strength Indication: The gradient dynamically adjusts based on the price's proximity to EMA 55, giving traders insight into momentum changes.
Minimalist Design: The EMAs themselves are not displayed by default to maintain a clean chart while still benefiting from their analysis.
Customizable Lengths: Pre-configured with EMA lengths of 20 and 55, but easily modifiable for different trading styles or instruments.
How to Use This Indicator
Trend Detection: Look at the gradient fill for visual confirmation of trend direction and strength.
Trade Entries:
Enter long positions when the price crosses above EMA 55, with the gradient transitioning to green.
Enter short positions when the price crosses below EMA 55, with the gradient transitioning to red.
Trend Strength Monitoring:
A brighter gradient suggests a sustained and stronger trend.
A fading gradient may indicate weakening momentum and a potential reversal.
Important Notes
This indicator uses a unique method of color visualization to enhance decision-making but does not generate buy or sell signals directly.
Always combine this indicator with other tools or methods for comprehensive analysis.
Past performance is not indicative of future results; please practice risk management while trading.
How to Use:
Trend Following:
Use the gradient fill to identify the trend direction.
A consistently bright gradient indicates a strong trend, while fading colors suggest weakening momentum.
Reversal Signals:
Watch for gradient changes near the EMA crossover points.
These can signal potential trend reversals or consolidation phases.
Confirmation Tool:
Combine EXPONOVA with other indicators or candlestick patterns for enhanced confirmation of trade setups.
Supertrend + BB + Consecutive Candles + QQE + EMA [Pineify]Overview
This indicator, developed by Pineify, is a comprehensive tool designed to assist traders in making informed decisions by combining multiple technical analysis methods. It integrates Supertrend, Bollinger Bands (BB), Consecutive Candles, Quantitative Qualitative Estimation (QQE), and Exponential Moving Averages (EMA) into a single, cohesive script. This multi-faceted approach allows traders to analyze market trends, volatility, and potential buy/sell signals with greater accuracy.
Key Features
1. Supertrend: Utilizes the Supertrend indicator to identify the prevailing market trend. It provides clear buy and sell signals based on the direction of the trend.
2. Bollinger Bands (BB): Measures market volatility and identifies overbought or oversold conditions. The script calculates the middle, upper, and lower bands, along with the Bollinger Band Width (BBW) and Bollinger Band %B (BBR).
3. Consecutive Candles: Detects sequences of consecutive bullish or bearish candles, providing signals when a specified number of consecutive candles are detected.
4. Quantitative Qualitative Estimation (QQE): Combines the Relative Strength Index (RSI) with a smoothing factor to generate buy and sell signals based on the QQE methodology.
5. Exponential Moving Averages (EMA): Includes both fast and slow EMAs to identify potential crossovers, which are used as buy and sell signals.
How It Works
- Supertrend: The Supertrend indicator is calculated using a factor and ATR length. It plots the trend direction and generates buy/sell signals when the trend changes.
- Bollinger Bands: The BB indicator calculates the middle band as a Simple Moving Average (SMA) of the closing prices. The upper and lower bands are derived by adding and subtracting a multiple of the standard deviation from the middle band.
- Consecutive Candles: This feature counts the number of consecutive candles that close higher or lower than the previous candle. When the count reaches a specified threshold, it generates a buy or sell signal.
- QQE: The QQE indicator smooths the RSI values and calculates the QQE Fast and QQE Slow lines. Buy and sell signals are generated based on the crossover of these lines.
- EMA: The script calculates fast and slow EMAs and generates buy/sell signals based on their crossovers.
How to Use
1. Inputs: Customize the indicator settings through the input parameters:
- Supertrend Factor and ATR Length
- BB Length
- Consecutive Candles Counting
- QQE RSI Length
- Fast and Slow EMA Lengths
- Enable/Disable Alerts for various signals
2. Alerts: Set up alerts for Supertrend, Consecutive Candles, and EMA crossovers. Alerts can be enabled or disabled based on user preference.
3. Visualization: The indicator plots the Supertrend, Bollinger Bands, and EMA lines on the chart. It also marks buy and sell signals with arrows and labels for easy identification.
Concepts Underlying Calculations
- Supertrend: Based on the Average True Range (ATR) to determine the trend direction and potential reversal points.
- Bollinger Bands: Utilizes standard deviation to measure market volatility and identify overbought/oversold conditions.
- Consecutive Candles: A method to detect momentum by counting consecutive bullish or bearish candles.
- QQE: Enhances the traditional RSI by smoothing it and using a dynamic threshold to generate signals.
- EMA: A widely used moving average that gives more weight to recent prices, making it responsive to market changes.
This indicator is a powerful tool for traders looking to combine multiple technical analysis methods into a single, easy-to-use script. By integrating these diverse techniques, it provides a comprehensive view of market conditions and potential trading opportunities.

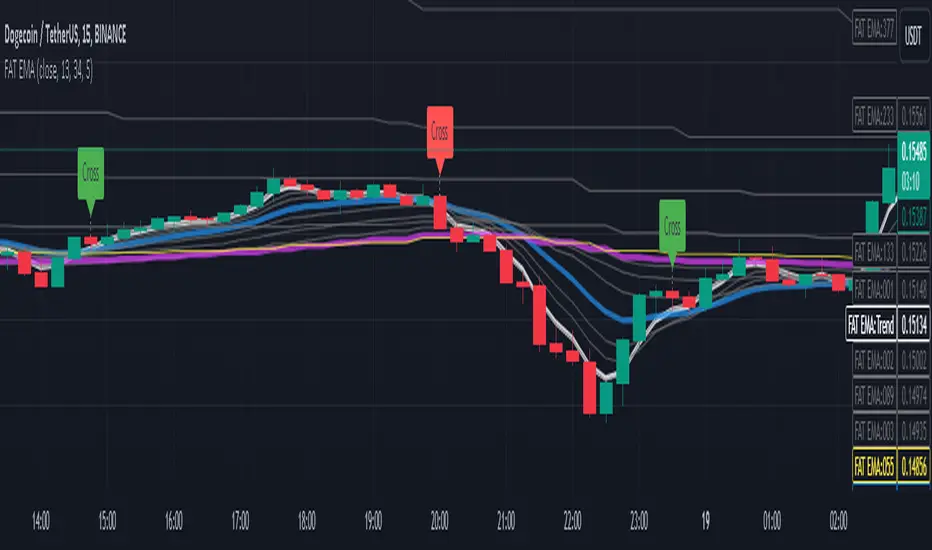
Fibonacci Adaptive Timeframe EMA (FAT EMA)The "Fibonacci Adaptive Timeframe EMA" is a sophisticated trading indicator designed for the TradingView platform, leveraging the power of Exponential Moving Averages (EMAs) determined by Fibonacci sequence lengths to provide traders with dynamic market insights. This indicator overlays directly on the price chart, offering a unique blend of trend analysis, smoothing techniques, and timeframe adaptability, making it an invaluable tool for traders looking to enhance their technical analysis strategy.
Key Features
1. Fibonacci-Based EMA Lengths: Utilizes the Fibonacci sequence to select EMA lengths, incorporating natural mathematical ratios believed to be significant in financial markets. The available lengths range from 1 to 987, allowing for detailed trend analysis over various periods.
2. Multiple Smoothing Methods: Offers the choice between several smoothing techniques, including Simple Moving Average (SMA), Exponential Moving Average (EMA), Smoothed Moving Average (SMMA or RMA), Weighted Moving Average (WMA), and Volume Weighted Moving Average (VWMA). This versatility ensures that users can tailor the indicator to suit their analytical preferences.
3. Timeframe Adaptability: Features the ability to fetch and calculate EMAs from different timeframes, providing a multi-timeframe analysis within a single chart view. This adaptability gives traders a broader perspective on market trends, enabling more informed decision-making.
4. Dynamic Visualization Options: Traders can customize the display to suit their analysis needs, including toggling the visibility of Fibonacci EMA lines, EMA prices, and smoothed EMA lines. Additionally, forecast lines can be projected into the future, offering speculative insights based on current trends.
5. Ema Tail Visualization: An innovative feature allowing for the visualization of the 'tail' or the continuation of EMA lines, which can be particularly useful for identifying trend persistence or reversal points.
6. User-friendly Customization: Through a series of input options, traders can easily adjust the source data, Fibonacci lengths, smoothing method, and visual aspects such as line colors and transparency, ensuring a seamless integration into any trading strategy.
Application and Use Cases
The "Fibonacci Adaptive Timeframe EMA" indicator is designed for traders who appreciate the significance of Fibonacci numbers in market analysis and seek a flexible tool to analyze trends across different timeframes. Whether it's for scalping, day trading, or long-term investing, this indicator can provide valuable insights into price dynamics, trend strengths, and potential reversal points. Its adaptability makes it suitable for various asset classes, including stocks, forex, commodities, and cryptocurrencies.
EMA Cross Dashboard | Flux Charts💎 GENERAL OVERVIEW
Introducing our new Exponential Moving Average (EMA) Cross Dashboard! This dashboard let's you select a source for the calculation of the EMA of it, then let's you enter 2 lengths for up to 5 timeframes, plotting their crosses in the chart.
Features of the new EMA Cross Dashboard :
Shows EMA Crosses Across Up To 5 Different Timeframes.
Select Any Source, Including Other Indicators.
Customizable Dashboard.
📌 HOW DOES IT WORK ?
EMA is a widely used indicator within trading community, it is similar to a Simple Moving Average (SMA) but places more weight on recent prices, making it more reactive to current trends. Crosses of EMA lines can be helpful to determine strong bullish & bearish movements of an asset. This indicator shows finds crosses across 5 different timeframes in a dashboard and plots them in your chart for ease of use.
🚩UNIQUENESS
This dashboard cuts through the hassle of manual EMA cross calculations and plotting. It offers flexibility by allowing various data sources (even custom indicators) and customization through enabling / disabling individual timeframes. The clear visualization lets you see EMA crosses efficiently.
⚙️SETTINGS
1. Timeframes
You can set up to 5 timeframes & 2 lenghts to detect crosses for each timeframe here. You can also enable / disable them.
2. General Configuration
EMA Source -> You can select the source for the calculation of the EMA here. You can select sources from other indicators as well as more general sources like close, high and low price.

Long EMA Strategy with Advanced Exit OptionsThis strategy is designed for traders seeking a trend-following system with a focus on precision and adaptability.
**Core Strategy Concept**
The essence of this strategy lies in use of Exponential Moving Averages (EMAs) to identify potential long (buy) positions based on the relative positions of short-term, medium-term, and long-term EMAs. The use of EMAs is a classic yet powerful approach to trend detection, as these indicators smooth out price data over time, emphasizing the direction of recent price movements and potentially signaling the beginning of new trends.
**Customizable Parameters**
- **EMA Periods**: Users can define the periods for three EMAs - long-term, medium-term, and short-term - allowing for a tailored approach to capture trends based on individual trading styles and market conditions.
- **Volatility Filter**: An optional Average True Range (ATR)-based volatility filter can be toggled on or off. When activated, it ensures that trades are only entered when market volatility exceeds a user-defined threshold, aiming to filter out entries during low-volatility periods which are often characterized by indecisive market movements.
- **Trailing Stop Loss**: A trailing stop loss mechanism, expressed as a percentage of the highest price achieved since entry, provides a dynamic way to manage risk by allowing profits to run while cutting losses.
- **EMA Exit Condition**: This advanced exit option enables closing positions when the short-term EMA crosses below the medium-term EMA, serving as a signal that the immediate trend may be reversing.
- **Close Below EMA Exit**: An additional exit condition, which is disabled by default, allows positions to be closed if the price closes below a user-selected EMA. This provides an extra layer of flexibility and risk management, catering to traders who prefer to exit positions based on specific EMA thresholds.
**Operational Mechanics**
Upon activation, the strategy evaluates the current price in relation to the set EMAs. A long position is considered when the current price is above the long-term EMA, and the short-term EMA is above the medium-term EMA. This setup aims to identify moments where the price momentum is strong and likely to continue.
The strategy's versatility is further enhanced by its optional settings:
- The **Volatility Filter** adjusts the sensitivity of the strategy to market movements, potentially improving the quality of the entries during volatile market conditions.
The Average True Range (ATR) is a key component of this filter, providing a measure of market volatility by calculating the average range between the high and low prices over a specified number of periods. Here's how you can adjust the volatility filter settings for various market conditions, focusing on filtering out low-volatility markets:
Setting Examples for Volatility Filter
1. High Volatility Markets (e.g., Cryptocurrencies, Certain Forex Pairs):
ATR Periods: 14 (default)
ATR Multiplier: Setting the multiplier to a lower value, such as 1.0 or 1.2, can be beneficial in high-volatility markets. This sensitivity allows the strategy to react to volatility changes more quickly, ensuring that you're entering trades during periods of significant movement.
2. Medium Volatility Markets (e.g., Major Equity Indices, Medium-Volatility Forex Pairs):
ATR Periods: 14 (default)
ATR Multiplier: A multiplier of 1.5 (default) is often suitable for medium volatility markets. It provides a balanced approach, ensuring that the strategy filters out low-volatility conditions without being overly restrictive.
3. Low Volatility Markets (e.g., Some Commodities, Low-Volatility Forex Pairs):
ATR Periods: Increasing the ATR period to 20 or 25 can smooth out the volatility measure, making it less sensitive to short-term fluctuations. This adjustment helps in focusing on more significant trends in inherently stable markets.
ATR Multiplier: Raising the multiplier to 2.0 or even 2.5 increases the threshold for volatility, effectively filtering out low-volatility conditions. This setting ensures that the strategy only triggers trades during periods of relatively higher volatility, which are more likely to result in significant price movements.
How to Use the Volatility Filter for Low-Volatility Markets
For traders specifically interested in filtering out low-volatility markets, the key is to adjust the ATR Multiplier to a higher level. This adjustment increases the threshold required for the market to be considered sufficiently volatile for trade entries. Here's a step-by-step guide:
Adjust the ATR Multiplier: Increase the ATR Multiplier to create a higher volatility threshold. A multiplier of 2.0 to 2.5 is a good starting point for very low-volatility markets.
Fine-Tune the ATR Periods: Consider lengthening the ATR calculation period if you find that the strategy is still entering trades in undesirable low-volatility conditions. A longer period provides a more averaged-out measure of volatility, which might better suit your needs.
Monitor and Adjust: Volatility is not static, and market conditions can change. Regularly review the performance of your strategy in the context of current market volatility and adjust the settings as necessary.
Backtest in Different Conditions: Before applying the strategy live, backtest it across different market conditions with your adjusted settings. This process helps ensure that your approach to filtering low-volatility conditions aligns with your trading objectives and risk tolerance.
By fine-tuning the volatility filter settings according to the specific characteristics of the market you're trading in, you can enhance the performance of this strategy
- The **Trailing Stop Loss** and **EMA Exit Conditions** provide two layers of exit strategies, focusing on capital preservation and profit maximization.
**Visualizations**
For clarity and ease of use, the strategy plots the three EMAs and, if enabled, the ATR threshold on the chart. These visual cues not only aid in decision-making but also help in understanding the market's current trend and volatility state.
**How to Use**
Traders can customize the EMA periods to fit their trading horizon, be it short, medium, or long-term trading. The volatility filter and exit options allow for further customization, making the strategy adaptable to different market conditions and personal risk tolerance levels.
By offering a blend of trend-following principles with advanced risk management features, this strategy aims to cater to a wide range of trading styles, from cautious to aggressive. Its strength lies in its flexibility, allowing traders to fine-tune settings to their specific needs, making it a potentially valuable tool in the arsenal of any trader looking for a disciplined approach to navigating the markets.

Dee EMA 5.0
1. Indicator Features:
- The indicator can plot four different sets of EMA on a chart.
- The EMA values can be displayed on the chart with their respective names (e.g., ema9, ema20, etc.).
- The indicator allows customization of the EMA values.
2. Purpose of Dee_EMA 5.0:
- Dee_EMA 5.0 is a unique EMA indicator specially designed for traders to provide better insights and aid in trading decisions.
- The primary reason for building this indicator is to address the challenge of managing multiple time frames while using normal EMA tables.
- Traditional EMA tables might not show all EMA values across different time frames simultaneously, leading to time-consuming processes like shifting time frames and refreshing charts.
- Dee_EMA 5.0 solves this issue by displaying EMA values for different time frames in one table, allowing traders to make quick judgments without repeatedly changing time frames and refreshing charts.
3. Importance of Different Time Frame EMA Values:
- Different time frames EMA values are crucial in trading because they provide valuable insights into the market dynamics at various levels.
- When using shorter time frames (e.g., 1-minute), EMA values can help identify short-term trends, support, and resistance levels.
- On the other hand, using larger time frames (e.g., 5-minute or 15-minute) provides more data and increases the accuracy of EMA-based analysis, enabling traders to identify longer-term trends and potential price movements.
4. EMA Crossover Table:
- Traders often prefer a clutter-free chart without too many lines, but they still need access to EMA values for analysis.
- The EMA table and EMA crossover table serve this purpose by providing EMA values and EMA crossover information in a structured table format.
- With the EMA crossover table, traders can quickly check EMA values and crossovers across different time frames without having to switch time frames repeatedly, saving time and facilitating faster decision-making during trading.
In summary, Dee_EMA 5.0 is an EMA indicator designed to help traders efficiently analyze EMA values across different time frames, allowing for faster and more informed trading decisions. The EMA crossover table provides additional convenience by presenting EMA crossovers without cluttering the chart.

All in One EMA indicator with Average EMA Calculations The Indicator displays multiple exponential moving averages (EMAs) on the chart. The six available options will let you adjust and set ]exponential moving averages ( EMAS) as per your choice. Additionally I have added an Average ema which will calculate the average of all the emas that you have selected. This average ema works very strong and greatly to find potential zone of dynamic supports and resistance as well as to gauge the overall trend .. The average ema will also allow you to keep your chart clean and you wont have to add too many emas together.
The average of the selected EMAs are displayed as a single line. This helps identify trends and potential reversals in the market. i hope this indicator will help you with trading...
Plz use the chart BINANCE:LINKBTC as reference, for back testing and educational purposes only.
Thumbs up if you liked the script.
Happy trading..

3 Fib EMAs To Scalp Them AllThe "3 Fib EMAs To Scalp Them All" was made in order to clear up when we should look for shorts, longs, or walk away. Also it can alert you when a trend starts, or when there is a possible reversal. I use it for scalping/day trading in 5m-1h timeframes.
1. EMAs: By default, the indicator uses Fibonacci numbers (21, 55, 233), but you can change them.
2. Color Changes: The color of the Micro EMA line changes depending on its relation to the Mid and Macro EMAs.
When Micro EMA < Mid < Macro EMA, it turns red, indicating a potential bearish trend - that's when you should look for shorts
When Micro EMA > Mid > Macro EMA, it turns green, indicating a potential bullish trend - that's when you should look for longs
A white Micro EMA is when you need to take some rest, enjoy your coffee, and avoid overtrading.
3. Signals: The indicator provides visual signals in the form of diamonds and crosses and corresponding alert signals.
A red diamond above the bar signals a potential beginning of a downtrend
A red cross above the bar signals the end of the downtrend and can be used as a signal for a possible reversal up/breakout.
A green diamond below the bar signals a potential beginning of a downtrend,
A green cross below the bar signals the end of the uptrend and can be used as a signal for a possible reversal down/breakout.
4. Alerts: For algo traders and people who prefer to stay away from the monitor... there are alerts for every signal.
Friendly note: Don't blindly follow the signals for your long and short entries. The signals only pop up when the EMA cross value gets a confirmation. A smart move would be to wait for a retracement to the EMA line and use momentum indicators like market cipher B to pinpoint those ideal entry points.

[@btc_charlie] Trader XO Macro Trend ScannerWhat is this script?
This script has two main functions focusing on EMAs (Exponential Moving Average) and Stochastic RSI.
EMAs
EMAs are typically used to give a view of bullish / bearish momentum. When the shorter EMA (calculated off more recent price action) crosses, or is above, the slower moving EMA (calculated off a longer period of price action), it suggests that the market is in an uptrend. This can be an indication to either go long on said asset, or that it is more preferable to take long setups over short setups. Invalidation on long setups is usually found via price action (e.g. previous lows) or simply waiting for an EMA cross in the opposite direction (i.e. shorter EMA crosses under longer term EMA).
This is not a perfect system for trade entry or exit, but it does give a good indication of market trends. The settings for the EMAs can be changed based on user inputs, and by default the candles are coloured based on the crosses to make it more visual. The default settings are based on “Trader XO’s” settings who is an exceptional swing trader.
RSI
Stochastic RSI is a separate indicator that has been added to this script. RSI measures Relative Strength (RSI = Relative Strength Index). When RSI is <20 it is considered oversold, and when >80 it is overbought. These conditions suggests that momentum is very strong in the direction of the trend.
If there is a divergence between the price (e.g. price is creating higher highs, and stoch RSI is creating lower highs) it suggests the strength of the trend is weakening. Whilst this script does not highlight divergences, what it does highlight is when the shorter term RSI (K) crosses over D (the average of last 3 periods). This can give an indication that the trend is losing strength.
Combination
The EMAs indicate when trend shifts (bullish or bearish).
The RSI indicates when the trend is losing momentum.
The combination of the two can be used to suggest when to prefer a directional bias, and subsequently shift in anticipation of a trend reversal.
Note that no signal is 100% accurate and an interpretation of market conditions and price action will need to be overlayed to
Why is it different to others?
I have not found other scripts that are available in this way visually including alerts when Stoch RSI crosses over/under the extremes; or the mid points.
Whilst these indicators are default, the combination of them and how they are presented is not and makes use of the TradingView colouring functionalities.
What are the features?
Customise the variables (averages) used in the script.
Display as one EMA or two EMAs (the crossing ones).
Alerts on EMA crosses.
Alerts on Stoch RSI crosses - slow/fast, upper, lower areas.
- Currently set on the chart to show alerts when Stoch RSI is above 80, then falls below 80 (and colours it red).
Customisable colours.
What are the best conditions for this?
It is designed for high timeframe charts and analysis in crypto, since crypto tends to trend.
It can however be used for lower timeframes.
Disclaimer/Notes:
I have noticed several videos appearing suggesting that this is a "100% win rate indicator" .
NO indicator has 100% win rate.
An indicator is an *indicator* that is all.
Please use responsibly and let me know if there are any mods or updates you would like to see.

OB EmaCross + BBThis is my setup and the way I like to trade.
It is based in an EMA cross ( 9 x 21) and the Bollinger Bands without the central Moving Average.
I prefer to use the EMA cross in the middle of the bands.
It is also possible to activate "Colored Bars" to paint the candles according to the EMA cross: green if the candles are above both EMAs, white when at least one of them are in between EMAs and red if they are both below EMAs.
My operational works like this:
- Buy when price is above EMAs
- Sell when price is belos EMAs
Of course, I use BB to give me the direction of the trend and I only enter in a trade when the price is in the same trend of the BB.
I avoid trades when the bands are getting narrowed.
I hope you enjoy my indicator and let me know if you have any suggestion! ;)

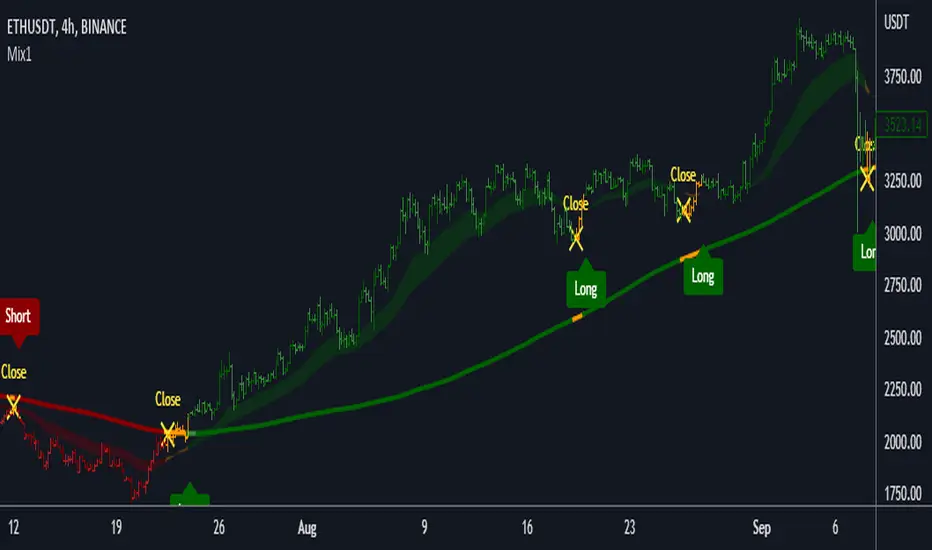
Mix1 : Ema Cross + Trend Channel [Gu5] - BacktestBacktest of the indicator "Mix1: Ema Cross + Trend Channel "
Trend indicator, by the crossing of moving averages
SMA200 with a channel as a filter confirms the trend.
The crossing of two moving averages, give alert only in trend.

KAMIKAMI EMA RIBBONGood evening plebians, This IS Cryptofilio, Your dark knight in the Crypto lightness.... Introducing yet another nebulous indicator... It's the KAMI, KAMI (GODS in Japanese) EMA ribbon.....
This indicator uses 3 primary lengths of EMA labeled as Short, Medium, and Long. They change colors in relation to each other and in relation to the current price of the security.
This indicator is more sophisticated than a simple MA cross strategy as you can use a wider variety of signals for entering earlier and exiting earlier, thus getting into a trade early in the run-up and getting out before the run-down. The EMA is identifiable by the color, lighter green and red representing lower lookbacks. When the OHLC4 crosses the ema it changes color. Thus if all colors are red, then the security is trading below all EMA's - a strong sell or short signal.
GREEN inside of RED indicates an uptrend within a larger downtrend... and of course, the inverse is also true.
The triangles which indicate a cross, are color-coded according to their significance by transparency - the less transparent the more important or significant the cross.
In addition, there are bull and bear bounce indicators (the arrows) that predict a bounce up or down from the security meeting a point along the EMA line and reacting.
VARIATIONS: To use this for scalping I suggest 5,8,13

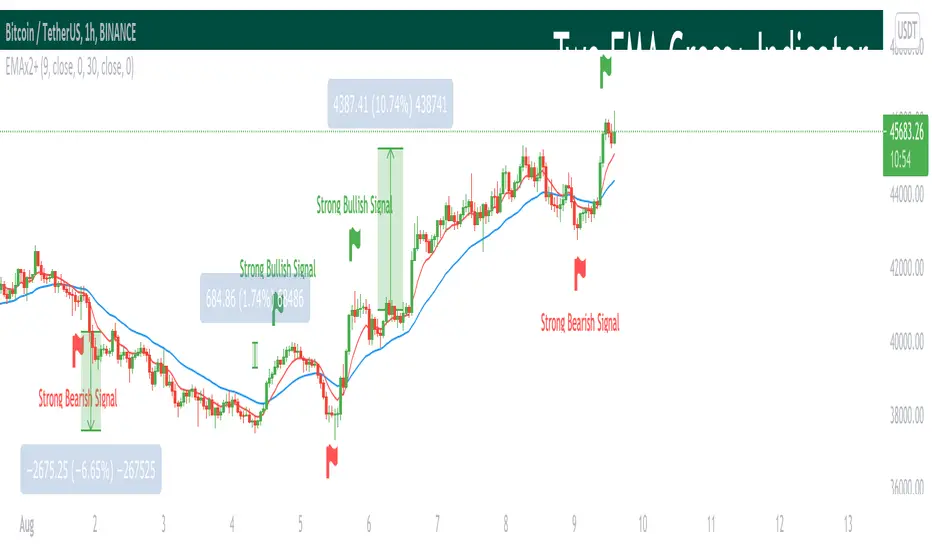
Two EMA Cross+ IndicatorHello traders!
Today we gonna demonstrate out heuristic of classical EMA Indicator. We decided to simplify your trading staff and add some meta data. So, let’s look at it from the very beginning and initially speak about what EMA is and then I’ll tell you why our indicator is extremely convenient and useful.
So, what is EMA? An exponential moving average ( EMA ) is a type of moving average (MA) that places a greater weight and significance on the most recent data points. The exponential moving average is also referred to as the exponentially weighted moving average . An exponentially weighted moving average reacts more significantly to recent price changes than a simple moving average ( SMA ), which applies an equal weight to all observations in the period.
Key takeaways:
-The EMA is a moving average that places a greater weight and significance on the most recent data points.
-Like all moving averages, this technical indicator is used to produce buy and sell signals based on crossovers and divergences from the historical average.
As you know, EMA Cross is one of basic and most popular Entry Indicators. It’s kinda easy to understand and even easier to use. This indicator consists of two EMAs - fast (red line) and slow (blue line). Fast EMA is EMA of less length that the fast EMA (default parameter is 9). Thus, it reacts the price change more actively than the slow. We can say that it takes into consideration the most actual price movements. Speaking about slow EMA (default parameter is 30) it’s more inert and it’s more difficult to change its action vastly. We can say that the EMA «looks» at the historical data more accurate, but doesn’t forget about actual price movements.
But how it works? Trivial. When the fast EMA crosses the slow bellow, it provides bearish signal, whereas when it crosses it above, it’s bullish signal. Even more, we added some «confirmation» factor. As you know, when the price is above the slow EMA, the slow EMA plays the role of support line for price and means that the price is in uptrend. Thus, when we see the cross above and it takes place under the price, we called it «strong Bullish Signal». When the price is bellow the slow EMA, slow EMA is resistance. Thus, when we see the cross bellow and it’s under the slow EMA, we called it «strong Bearish Signal».
To make your trading process easier, we plotted the places of crosses on the chart and added the descriptions of the crosses. The flags mean the place of cross. The default parameters have nice backtest on 1H chart. However, you can also change them depending on your goals and the time period. The places of cross looks like flags (red flag is «bearish» cross, green - «bullish»). As you can see, it’s really convenient.
I hope you’ll enjoy our heuristic of classical EMA Cross. We are sure that the meta data that we are taking into consideration makes the signals more accurate and the deals more profitable. The SkyRock Team with support of Trading View try to make your trading process more successful and profitable. Every day we works in conjunction to boost both your skills and trading balance. We hope, it’s really useful for you, dear traders!
Double EMA CROSS
Double EMA CROSS (DEC)
Useful for identifying and receiving alerts about uptrends and downtrends.
This script uses two Exponential Moving Averages (EMAs) to find price uptrends and downtrends.
An Exponential Moving Average ( EMA ) is a type of moving average that places a greater weight and significance on the most recent data points.
The script produces uptrend and downtrend signals based on crossovers and divergences between the two EMAs,
the user will be able to spot a trend change (when the EMAs crossover) and to determine the strength of the current trend (when the EMAs diverge).
It is also posible to get alerts for uptrends and downtrends on the web and mobile app with sound and pop-ups as well as via email.
The optimal time to enter and exit the market can be concluded from this trend changes.
The user can set their own EMAs, by default they are set to 25 and 75 periods for medium and long term respectively.
When the medium term EMA crosses below the long term EMA the asset is in a downtrend and the price will decline, and when the
medium term EMA crosses above the long term EMA the asset is in an uptrend and price will increase.
This scripts plots the following indicators and signals on the chart to help the user to identify trends:
1.- Medium and long term EMAs as lines overlaid on the price chart.
2.- Up green triangles above bars when the price is on an uptrend and down red triangles below bars when the price is on a downtrend.
3.- Arrows with text to indicate the start of an uptrend or downtrend.
The user can enable and disable the indicators and signals as well as set colors and shapes to their liking.
This script also lets the user create alerts for uptrends and downtrends. To create a new alert using this script follow this instructions:
1.- Once you added this script to your chart, go to the alerts panel (right on web or bottom tool bar on the mobile app) and add a new alert (alarm clock icon with a plus sign).
2.- A modal window will open. On the “Condition” dropdown menu select “DEC”.
3.- On the next dropdown menu (right below the “Condition” one) you can select.
4.- Lastly you can set all the normal alert options and create the alert.


EMAsCross_byAJSThis custom indicator can help you to see whether a stock is following or losing it's currently tendency, as also a buying/selling signal.

BUY and SELL - Backtest single EMA cross By che_traderHi, I hope you're well!
At the request of my friend @jansrbtc I'm going to publish a simple emas crossing strategy.
We will do long or short at the cross of the two ema.
Good strategy for when an asset is in trend.
Warm: In choppy periods this indicator can be very affected by large drawdowns.
Enjoy!

Mix1 : Ema Cross + Trend Channel [Gu5]Based on Trend Channel
Ema-crossover is added
Crossing alerts, only on trend
Basado en mi anterior indicador, Trend Channel
Se agrega Cruce de Medias Moviles (Ema-crossover)
Las alertas solo son en favor a la tendencia
El valor de SMA Range es arbitrario (No Backtesting). Cambia la amplitud de canal que determina cuando es rango (barras amarillas por estar muy cerca del SMA200, sin tendencia definida)
Range Multiplier adapta el indicador a distintos mercados
//Setting recommended for SMA Range
//BTCUSD = 100
//EURUSD = 1000
//SPX = 100
//ETHUSD = 10
Si te fue útil este indicador, puedes comprarme una cerveza ;)
EMA Bot Trigger - 14,26,55Work In Progress - Currently will send Long/Short triggers when EMA 14 Crosses EMA 26 - whether the cross is above the EMA 55 determines whether to Long or Short.
Pullback Trading [Fhenry0331]The indicator is taken from Alexander Elders "Triple Screen System," minus using the Weekly MACD as a filter/trend. I believe waiting for the force index and the weekly MACD histogram to line-up is uber conservative and a trader will miss too many signals (In my opinion).
The indicator is for a pullback trader. A trader that waits for a trend to develop then enters on a pullback.
The indicator defines an uptrend start: as the 13 ema crossing above the 26 ema. It defines a downtrend start: as the 13 ema crossing below the 26 ema.
The pullback in an uptrend: 13 ema is above the 26 ema. Elders-Force-Index is below the zero line. Price low has crossed below the 13 ema (one can also say price closes below the 13 ema if they so wish).
The pullback in a downtrend: 13 ema is below the 26 ema. Elders-Force-Index is above the zero line. Price high has also crossed above the 13 ema.
Please note that the pullback signals do not necessitate an automatic buy or sell (the instrument can be still pulling back deeper and not ready to resume it's trend.) One should place orders above (long) or below (short) bars with the pullback signals. Do so on signals until orders are filled.
Although the indicator is meant for pullbacks one can make an aggressive entry at the onset of a crossover of ema's.
For clarity background colors has been added to the indicator.
works well on daily time frame. Also look at intraday (5) minute time frame on trending stocks (news, earnings, volume, etc.)
Keep It Simple.
Enjoy!
