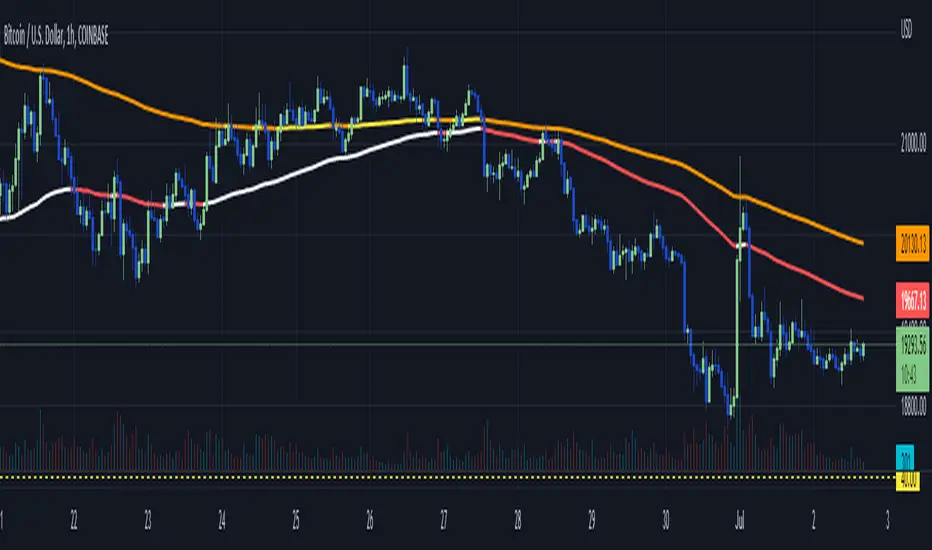
WhiteFang 100 / 200 EMA ColorFlipThis script combines the 100 and 200 EMA and exhibits colour changes ("colour flip") at price action crosses.
The intention here is to create an "at a glance trend indicator" to allow quick and accurate stock, forex and crypto screening prior to selecting targets for entry.
For example I find it prudent to select long when the PA is above both the White (100EMA) and Yellow (200EMA) - conversely selecting short when below Red (100EMA) and Orange (200EAM).
Other attributes:
- Multi timeframe compatible
- Easily to spot:
- golden cross = (white crossing over yellow), and
- Death cross ( red crossing below orange)
EMAS
Rramires->5_EMAs 9, 21, 50, 100, 200The five EMA averages I use in my analysis in a single indicator.

Multi-timeframe EMAThe Multi-timeframe exponential moving average (EMA) indicator visualizes EMAs from 1 minute to 1 quarter on a single chart using the request.security function. Standard and Fibonacci timeframes are available as well as the ability to hide high-timeframe EMAs to keep the chart clean. Cross-overs and arrangement of the EMAs indicate sentiment.
Much love to DumpCap! The script is presented sans secret sauce.
((Bullish)) Candle below EMA Hello People of the Trading World...
Todays script is a basic concept of using Moving Averages and Candle Closes - this works best on Higher Timeframes and only in Bullish Conditions
"When the market is trending to the upside - we tend to see price overextend from the moving average and price revert back to the mean (Mean Reversion)"
You may ask why would you want this candle - this presents good opportunities in a trending market (NOT AN ENTRY CANDLE). This can be useful to get into existing trends which you may have missed
This candle will display when the candle close is below one of the below EMAS
9EMA
50EMA
100EMA
You can choose which one to show ie if the 21ema wasnt important but the 100ema was... turn off the 21ema and 50ema and this will display candle below the 100ema
This candle can be alerted in the settings so if price does close you wont miss it.
EXMAPLES:
If you find this script useful please leave a comment and a thumbs up :)

MTF EMASMulti time frame EMA
This script will plot the configured EMAS on the current time frame (CTF) and also the same EMAS on a higher time frame (HTF).
Hard coded according:
* 5m EMAS will be plotted on TF bellow 5m
* Daily EMA will be plotted on TF above 5m and bellow 1D
* Weekly EMA will be plotted on daily TF
* Monthly EMA will be plotted on weekly TF
This configuration give us the opportunity to watch EMA support/resistance from HTF on the CTF

Multi EMA with labels (Any timeframe)This script lets you add up to 8 EMAs (Exponential Moving Averages) that can be set to any timeframe and length. The difference between this and other EMA indicators is that it has a simple label attached to each EMA showing which timeframe it belongs to and what length it is, so you can get that information at a glance while trading without having to remember the specific settings for each EMA.
I was personally looking for something like this because I like clarity on my chart and these labels really help. The existing EMA indicators I found with labels don't support multiple timesframes or if they do, they don't include the timeframe itself in the label, so that's why I created this simple script and shared it in case somebody else is looking for the same. Enjoy.

Booz StrategyBooz Backtesting : Booz Backtesting is a method for analyzing the performance of your current trading strategy . Booz Backtesting aims to help you generate results and evaluate risk and return without risking real capital.
The Booz Backtesting is the Booz Super Swing Indicator equivalent but gives you the ability to backtest data on different charts.
This is an Indicator created for the purpose of identifying trends in Multiple Markets, it is based on Moving Average Crossover and extra features.
Swing Trading: This function allows you to navigate the entire trend until it is not strong enough, so you can compare it with fixed parameters such as Take Profit and Stop Loss.
Take Profit and Stop Loss function: With this function you will be able to choose the most optimal parameters and see in real time the results in order to choose the best combination of parameters.
Leverage : We have this function for the futures markets where you can check which is the most appropriate leverage for your operation.
Trend Filter: allows you to take multiple entries in the same direction of the market.
If the market crosses below the 200 moving average, it will take only short entries.
If the market crosses above the 200 moving average, it will take only long entries.
Timeframes
Charting from 1 Hour, 4 Hour, Daily, Weekly, Weekly
Markets :Booz Backtesting can be tested in Cryptocurrency, Stocks and Futures markets.
Background Color : at a glance, you can see what cycle the market is in.
Green background : Shows that the market is in a bullish cycle.
Red background: Shows that the market is in a bearish cycle.

Market Makers MoveV1,V2, & V3: New indicator release!! In this fantastic new indicator, you can do the following:
- Specify a particular EMA crossing combination (between a fast and a slow ema line)
- Specify the timeframe (can be independent or based on current chart timeframe, by default)
- Select one of four possible potential profiles (ETFs Only, Crypto, and more!) OR input manually any of 40 possible tickers AND
- Assess whether entry for calls or puts is appropriate based on price action on realtime view between 2 tickers, one which will be the highest (strongest) trend up and the other going the lowest (weakest) trend possible, all at the same time!
This indicator is by no means financial advice!! So by all means, use according to proper assessment and risk management! There are various tooltips instilled to each field and table of the indicator, all to better guide you for better end results!
Cheers! and good luck in you!!

Stacked EMAsStacked Daily & Weekly EMAs + Labels
Pretty much self-explanatory indicator that shows the current momentum based on the key exponential moving averages.
Three stages of the EMAs:
1. Stacked Positively (Bullish) - EMAs are stacked on top of each other which represents a healthy bullish uptrend (green Label).
2. Stacked Negatively (Bearish) - EMAs are stacked below each other meaning the trend is bearish (red label).
3. Stacked Neutral (Neutral) - EMAs are crossing each other without any clear direction = chop (yellow label).
Hope it helps.

LNL Keltner ExhaustionLNL Keltner Exhaustion resolves the constant issue of Bands vs. EMAs
With the keltner exhaustion wedges, you can easily see the keltner channel extremes witout using the actual bands. That way, you will know whether the price is outside of the keltner channels + you can use other indicators (such as EMAs) on chart without the bands so the chart does not look messy & hard to read.
Two Types of Wedges:
1. Green/Red Wedge - Price action is extended outside the regular band. More of a "profit taking" zone rather than "entry taking" (default set to 3.0 ATR factor).
2. Purple Wedge - Price action is extended outside of the extreme band. Chances are price will revert to mean soon (default set to 4.0 ATR factor).
Works great as a target tool with the squeeze setup or as an overall extension gauge.
Hope it helps.

Dogaressa Helper (Emas)This indicator displays the levels at which the moving averages of the higher time frames are found
Cross 2 Emas + Pullbackhello
it's not financial advice and It's your responsibility to win and lose with this strategy.
also, there is no benefit for publisher at all if you win or lose a trade.
and this strategy is working only in 4h timeframe, and I didn't test or check for other timeframes!
.........
this strategy is based on two EMAS crossing each other and waiting for the price to pull back on fast ema(ema with lower length).
so basically , when EMA 50 crosses up with the EMA 100 , we are looking for a long and waiting for the price to touch the EMA 50.
.........
the Strategy is based on 100% equity because personally I use small budget for each ROBOT(like 100$)
the initial capital = 100$
order size = 100% of equity
commission = 0.1%
trade start time = 2021.1.1
.........
settings
1.Stop loss ATR = (your number * ATR ) + stoploss
2.RR = Risk / Reward
3.ATR length = ATR setting (7,9,14)
4.Emas setting = you can choose the EMA length
for exp : if you want EMA 25 and 75 , fill the fast ema length with 25 and 75 for slow ema length
5.Time : you can tell the strategy to trade from which time to which time
exp : 2021.1.1 to 2022.1.1 or 2019.1.1 to 2021.1.1
6.long or shot : if you deactivate the long , it will trade only short.(same thing for short)(strategy trade both sides by default)
7. you can remove the labels and Table from menu as well
.........
cross
when EMAS cross each other , you will see Dimond shape (as you know you can change the shape and color)
........
Table
when we are in a position , we can see a table like this which shows us the percent and value of the Stop loss and target price.
short
long
........
E/SL/TP
E = Entry Line
SL = Stoploss line
TP = Target Price
(you can also remove labels in setting)
......
my goal is to upgrade this strategy with your ideas.
not financial advice !
please , share your ideas with me to improve the strategy
I would like to see what do you think about this strategy <3
have a great day.

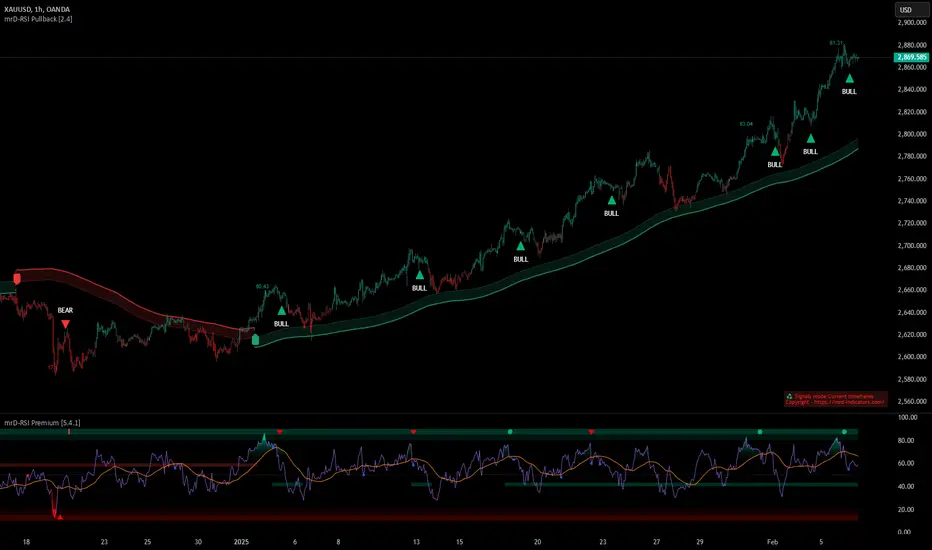
mrDAlgo PremiumBUY / LONG when the Trend Catcher Trend Line cuts upwards and the candle will be green, and the cut candle is above the blue clouds.
SELL / SHORT when the Trend Catcher Trend Line crosses downwards and then the candle cluster will be red, and the prices are below the red clouds.
Moving averages help assess the main trend:
- The price is completely below the moving averages, showing that the downtrend is happening.
- The price is completely above the moving averages indicating an ongoing uptrend.
- The price completely crosses the moving averages showing a sideways trend.
Setting:
A sensitivity setting is recommended for trend confirmation signals.
Show/hide trend catcher
Show/Hide Moving Averages
Alerts: Warn when the signals confirm the trend.
Candle color mode:
Green candle: Strong buy.
Red candle: Strong selling is active.
Purple Candle: Normal buy or sell signal is active.
EQ Cloud: When enabled, a simple "cloud"-like indicator will be displayed on your chart.
The EQ Cloud has a similar effect to the Ichimoku Cloud and can identify the current trend and act as to subsequent support and resistance.
This toolkit is made up of different tools all in one indicator to create your own unique trading strategies.
General disclaimer:
Trading stocks, futures, forex, options, ETFs, cryptocurrency, or any other financial instrument has huge potential rewards but also huge risks.
You must be aware of the risks and willing to accept them to invest in stocks, futures, forex, options, ETFs, or cryptocurrencies.
Don't trade with money you can't afford to lose.
This is not an offer or an offer to Buy/Sell stocks, futures, Forex, options, ETFs, cryptocurrencies, or any other financial instrument.
Do not represent that any account will or is likely to achieve profit or loss of any kind.
Past performance of any trading system or method is not necessarily indicative of future results.
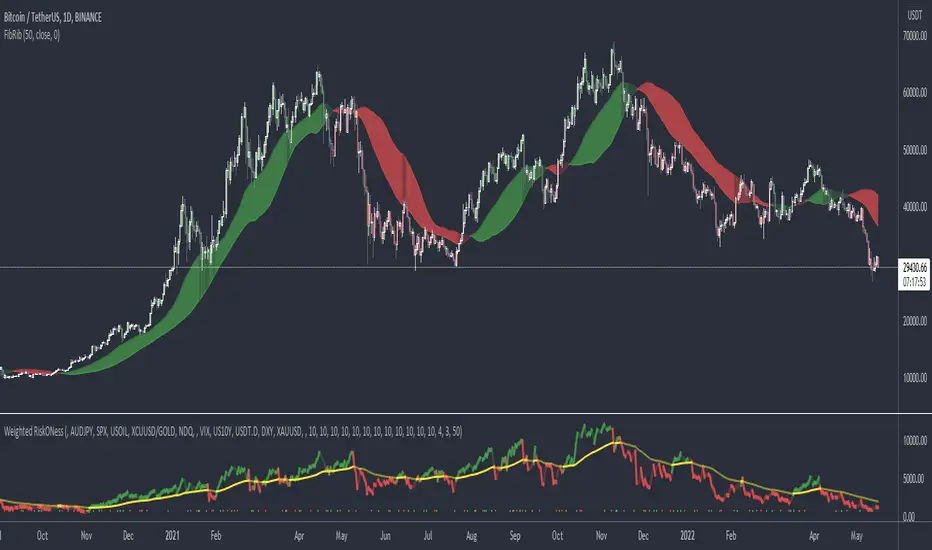
Fibonacci RibbonThe Fibonacci Ribbon (FibRib) creates two Fibonacci moving averages: essentially a Fibonacci WMA and a Fibonacci EMA.
The ribbon colors based on which is higher and where PA is relative to the ribbon.
Optional colored candles shades candles the same color as the ribbon.
OpenCipher AOpenCipher A is an open-source and free to use Overlay.
Features:
EMA Ribbons (Lengths: 5, 11, 15, 18, 21, 25, 29, 33)
Symbols ("Be careful" and "attention required" signals)
EMA Ribbons
The EMA RIbbons are a set of exponential moving averages. Blue and white ribbons = uptrend, gray ribbons = downtrend. The ribbons can act as support in uptrends and as resistance in downtrends.
Lengths and source of the ribbons are customizable.
Symbols
Green Dots: The green dot is a bullish symbol that appears whenever the EMA 11 crosses over EMA 33.
Red Cross: The red cross is a bearish symbol that appears whenever the EMA 5 crosses under EMA 11.
Blue Triangle: The blue triangle marks a possible trend reversal that appears whenever the EMA 5 crosses over EMA 25 while EMA 29 is below EMA 33.
Red Diamond: The red diamond is a bearish symbol that marks a potential local top whenever a bearish wavecross occurs (fast wave crosses under slow wave).
Yellow X: The yellow X is a warning signal that appears whenever a bearish wavecross occurs while the slow wave of the wavetrend is below -40 and the moneyflow is in the red (below zero).
Blood Diamond: The blood diamond is a bearish symbol that highlights whenever the red diamond and the red cross appear on the same candle.
Usage
Treat the symbols as signs that your attention might be required and don't trade based on them.

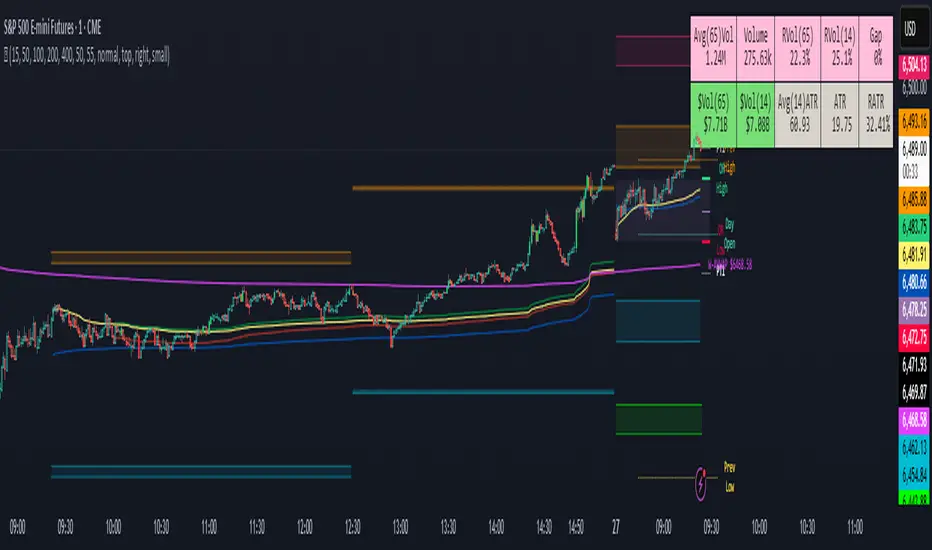
Three Legged GooseThree Legged Goose
Three-Legged Goose is an all-in-one intraday trading system.
It features a sleek and customizable Opening range overlay with infinitely generating price targets, Average Daily Range Zones, Curated Anchored VWAPs, Total Volume and ATR analysis, as well as our state of the art Market Momentum Trend detection.
Three-Legged Goose also has important Daily levels, including the Previous Day's High and Low and the Current Days Open, three fully customizable Exponential Moving Averages, a customizable ema cloud, and a toggleable standard vwap.
Using this indicator allows you to get rid of any unnecessary indicators that are taking up those valuable slots in TradingView.
AVWAP + ORBS:
The Opening Range Breakout system builds off of our recommended 15min opening range and does all of your price target calculations based on the width of the opening range. These targets are fully customizable within the settings,
to allow fine-tuning from ticker to ticker. We have programmed three Anchored vwaps at different time intervals to act as a dynamic trend-finding instrument. These, along with the opening range breakout system, can help you quickly spot the day's trend and dynamic support and resistance long before your standard moving averages have caught up with price intraday.
Average Daily Range Zones:
We believe these zones to be essential to trading, especially with our system. These zones tend to act as areas of major support and resistance as well as give an idea of the projected volatility of the underlying.
Market Momentum Trend Detection:
We paint our momentum analysis directly on your candles. By taking the overall Market Internals + the underlying's Price movement, we can determine areas where we feel comfortable adding risk on or taking risk off.
This will help those that struggle at identifying trends and valid reversals.
All of the default settings are our recommended settings.
Please check the Author Instructions Below for how to gain access to our indicators.
Waddah Attar Explosion V3 [NHK] -Bollinger - MACDWaddah Attar Explosion Version3 indicator to work in Forex and Crypto, This indicator oscillates above and below zero and the Bollinger band is plotted over the MACD Histogram to take quick decisions, Colors are changed for enhanced look. dead zone is plotted in a background area and option is provided to hide dead zone. One can easily detect sideways market movement using Bollinger band and volume. when volume is in between Bollinger band no trades are to be taken as volume is low and market moving in sideways
credits to: @shayankm and @LazyBear
Read the main description below...
- - - - - - - - - - - - - - - - - - - - - - - - - - - - - - - - - - - - - - -
This is a port of a famous MT4 indicator. This indicator uses MACD /BB to track trend direction and strength. Author suggests using this indicator on 30mins.
Explanation from the indicator developer:
"Various components of the indicator are:
Dead Zone Line: Works as a filter for weak signals. Do not trade when the up or down histogram is in between Dead Zone.
Histograms:
- Pink histogram shows the current down trend.
- Blue histogram shows the current up trend.
- Sienna line / Bollinger Band shows the explosion in price up or down.
Signal for ENTER_BUY: All the following conditions must be met.
- Blue histogram is raising.
- Blue histogram above Explosion line.
- Explosion line raising.
- Both Blue histogram and Explosion line above DeadZone line.
Signal for EXIT_BUY: Exit when Blue histogram crosses below Explosion line / Bollinger Band.
Signal for ENTER_SELL: All the following conditions must be met.
- Pink histogram is raising.
- Pink histogram above Explosion line.
- Explosion line raising.
- Both Pink histogram and Explosion line above DeadZone line.
Signal for EXIT_SELL: Exit when Pink histogram crosses below Explosion line.
All of the parameters are configurable via options page. You may have to tune it for your instrument.

2 EMA + Stochastic RSI with ATR TrailingHello, one of my first public scripts!
This strategy uses:
1. 2 EMA's
2. Stochastic RSI
3. ATR
Very simple, yet effective strategy.
The strategy will go long when stochastic crosses under the oversold area and and price has pulled back to the fast EMA - while price is above the long term EMA. Vice versa for shorts.
The stop loss and take trofit are both based on the ATR. There is a trailing ATR function as well.
Happy Trading!

Multiple Indicator 50EMA Cross AlertsHere’s a screener including Symbol, Price, TSI, and 50 ema cross in a table output.
The 50 Exponential Moving Average is a trend indicator
You can find bullish momentum when the 50 ema crossed over or a bearish momentum when the 50 ema crossed under we are looking to take advantage by trading the reversion of these trends.
True strength index (TSI) is a trend momentum indicator
Readings are bullish when the True Strength Index shows positive values
Readings are bearish when the indicator displays negative values.
When a value is above 20, we look for selling overbought opportunity and when the value is under 20, we look for buying oversold opportunity.
You can select the pair of your choice in the settings.
Make sure to create an alert and choose any alerts then an alert will trigger when a price cross under or cross over the 50 ema for every pair separately.
This allow the user to verify if there is a trade set up or not.
Disclaimer
This post and the script don’t provide any financial advice.

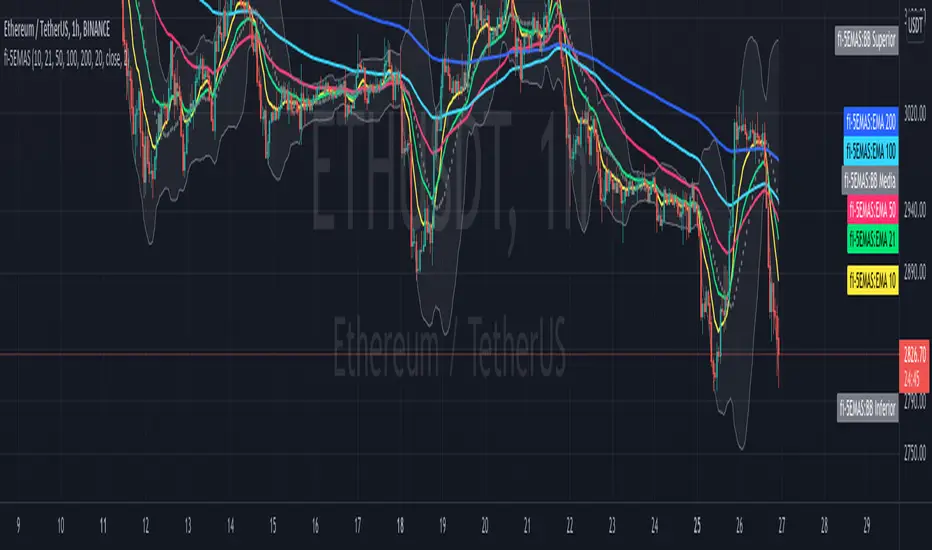
fi - 5EMA + BB - 5 emas en un mismo indicador junto con las bandas de bollinguer.
- Opcion de timeframe
- Actualizado a version 5
//Indicador adaptado a medida sobre "4EMA lines EMA Cross @Philacone + Bollinger Bands by Alessiof"
//Todos los méritos para Alessiof, muchas gracias!!!
CCI + EMA with RSI Cross StrategyThis strategy uses the CCI + 2 RSIs + 2 EMAs to generate trade signals. Trades are only taken during the normal trading session and all open trades are closed 15 min before the close of the current session. A trailing stop loss is used and is customizable.
Not trading advice, use at your own risk.

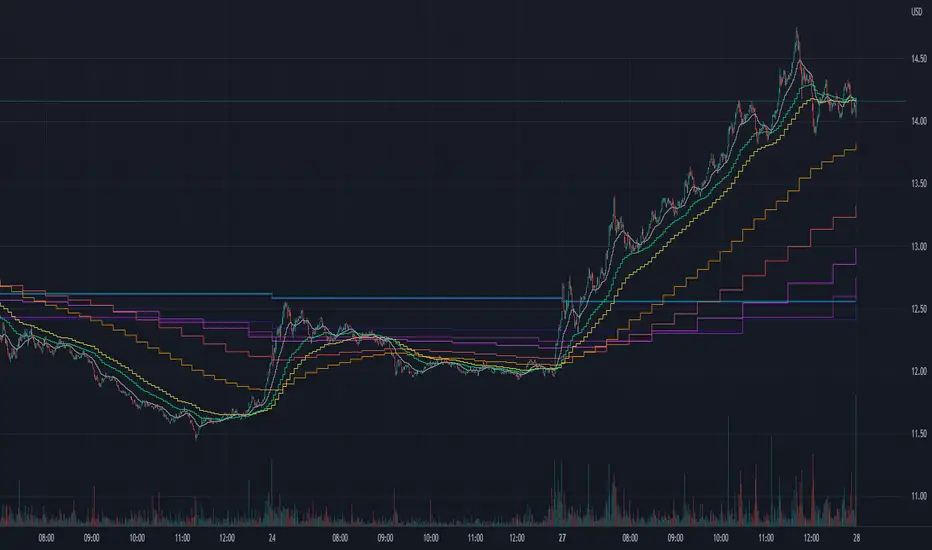
Sentimental Cycles with CrossingsThis indicator provides the following options, where you can choose to display:
DEMA TEMA cycles, filtered by default with sentiment.
Sentiment cloud, based on the 200ema area between the 1 minute and 1 hour lines.
One or both ema crossings with their respective timeframes (independent from current chart timeframe) and optional line display.
One or two tickers and their respective crossings based on selected timeframes.
Additional EMA lines supplied with their very own timeframe.
This indicator is intended to be used any way suitable to the user, nearly every aspect is customizable, and the defaults are just enough to get you started on deciding whether it's time to enter calls or puts.
TIPS for optimal results:
- Try using 2 charts: the 1 minute and the 1 hour per symbol. Under the 1 minute chart, use the 3 minute and 5 minute timeframe for crossings.
- Try to start a position when a sentimental DEMA TEMA cloud is beginning to form. The first bar usually pays thicc.
- Tickers SPY and VXX can be of good reference for market direction. If all crossings coincide, it's because there's a strong momentum in a certain direction for the market.

Heikin-Ashi Trend AlertThis script:
Adds a Heikin-Ashi line to the chart (EMA-based).
Provides alerts triggered when the color goes from green to red and vice versa.
Just add the indicator to the chart, create an alert and select " Heikin-Ashi Trend Alert " from the dropdown. Profit.
