Zays emaHey, as the creator of “zays ema” I’m proud to have coded such an indicator with much potential ,this indicator, unlike many, references a moving average on a lower time frame, and when applied to a chart you’ll see that when price is either above or below this moving average it will always return back to base to acquire equity, I use that term in full to the fact that, when price is on this moving average it will either consolidate for a period of time or react violently to the upside or downside. This is to be used as a conformation indicator For any other implemented strategy. thank you for your time, have fun :).
Ekuiti

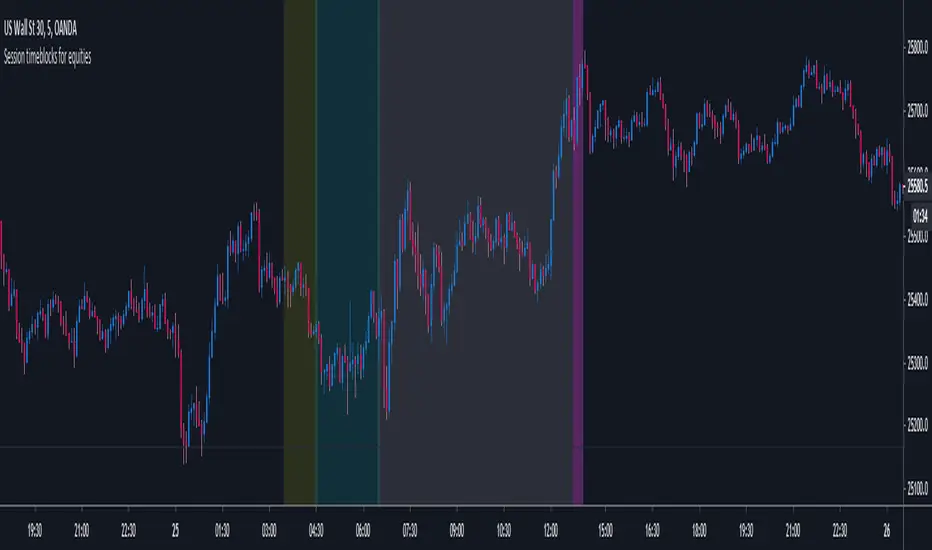
MightyFine Time blocks - EquitiesThis is a session timing indicator designed to show you certain times that the NYSE trades in. The bands represent:
Pre-Market Queue
NYSE Early Trading
NYSE Core Trading Session
Closing Auction Imbalance Freeze period
(optional) NYSE Afterhours until Asian session open
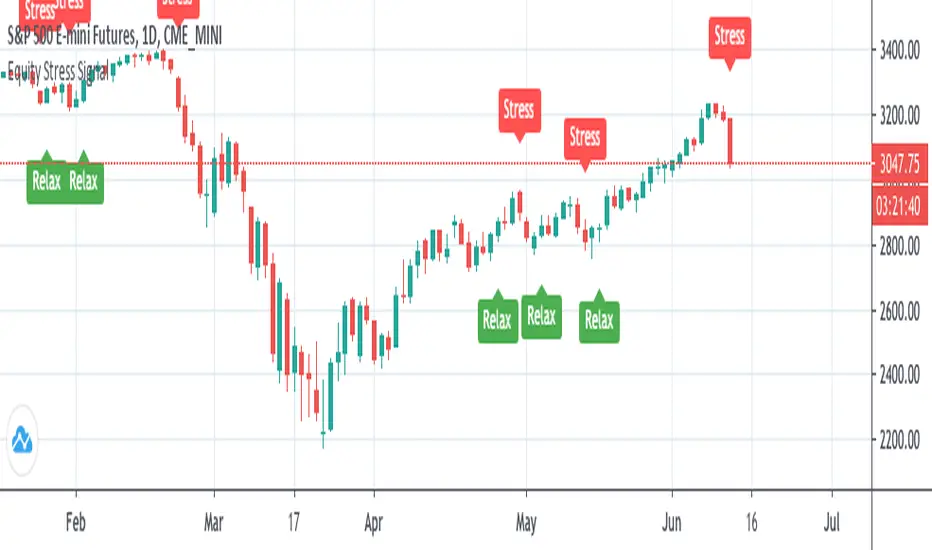
Equity Stress SignalEquity broad market stress signal based on market volatility gauges.
Used with daily candles.
To form trading strategies, use it along with other indicators of your choice.
Funamental and financialsEarnings and Quarterly reporting and fundamental data at a glance.
A study of the financial data available by the "financial" functions in pinescript/tradingview
As far as I know, this script is unique. I found very few public examples of scripts using the fundamental data. and none that attempt to make the data available in a useful form
as an indicator / chart data. The only fitting category when publishing would be "trend analysis" We are going to look at the trend of the quarterly reports.
The intent is to create an indicator that instantly show the financial health of a company, and the trends in debt, cash and earnings
Normal settings displays all information on a per share basis, and should be viewed on a Daily chart
Percentage of market valuation can be used to compare fundamentals to current share price.
And actual to show the full numbers for verification with quarterly reporting and debuggging (actual is divided by 1.000.000 to keep numbers readable)
Credits to research study by Alex Orekhov (everget) for the Symbol Info Helper script
without it this would still be an unpublished mess, the use of textboxes allow me to remove many squiggly plot lines of fundamental data
Known problems and annoyances
1. Takes a long time to load. probably the amount of financial calls is the culprit. AFAIK not something i can to anything about in the script.
2. Textboxes crowd each other. dirty fix with hardcoded offsets. perhaps a few label offset options in the settings would do?
3. Only a faint idea of how to put text boxes on every quarter. Need time... (pun intended)
Have fun, and if you make significant improvements on this, please publish, or atleast leave a comment or message so I can consider adding it to this script.
© sjakk 2020-june-08

Volume, Simple Relative Volume HighlightThis script plots volume bars and highlight bars that have an unusual activity, compare to the average (Standard: Simple Moving Average, 50 periods).
The script is useful for checking daily volume levels on equities. Where there is high volume, there is likely volatility, wich is good for day trading and swing trading entries.

McMillan Volatility Bands w/ Buy & Sell Signals [optstrategist]BACKGROUND
McMillan Volatility Bands are an alternative approach to John Bollinger's "Bollinger Band" study and developed by world-renowned options trader and author Lawrence G. McMillan. Given his background in options trading, it was natural for Lawrence to approach any volatility-based study in the same manner options are priced --using Black-Scholes model. This model of pricing assumes a financial asset's volatility should be measured in percentage change rather than absolute value change.
OVERVIEW
The McMillan Volatility Bands indicator for TradingView will plot the 3 and 4-standard deviation bands around a 20-day moving average. This is how Larry has always used this system. The user can, however, change the standard deviation value as well as the moving average length to their preferred setting. This indicator can be used on any asset and on any timeframe.
Furthermore, the indicator will plot buy and sell signals based on a trading system used by Larry in his flagship newsletter publication The Daily Strategist. The system gives a signal when price closes outside the 4-sigma band and then closes back within the 3-sigma band. That 'signal bar' will be colored red or green for a sell or buy signal setup, respectively.
Finally, an arrow will be plotted on the chart where the system would actually enter the trade. This is determined when price trades a little beyond the extreme of the 'signal bar'. The level by which price has to go beyond the 'signal bar' is an input parameter and can be adjusted by the user. We've chosen the default value of 0.34. This means, the indicator will not give a buy or sell entry until the price moves: 1/3 x beyond the extreme signal bar. This is to prevent getting whipsawed by some setups that never really move in your favor. We've found it successfully removes the less-valuable trade setups.
PARAMETERS
ma_length => length of the moving average that the volatility bands work off of
outside_sigma => standard deviation of outer volatility band
inside_sigma => standard deviation of inner volatility band
entry_trigger_cushion => this refers to the percentage of the signal bar's range. The default value is 0.34. This means price will need to move 1/3 (~34%) of the signal bar's range beyond the high (for a buy) or low (for a sell) of the signal bar to trigger a buy/sell entry. This entry plots the arrow on the chart. We have found requiring this extra move in price eliminates many of the less-desirable signals at the expense of entering the better signals a little later.
WANT TO PURCHASE OR NEED MORE INFORMATION ON McMILLAN VOLATILITY BANDS?
Visit the link below to see purchasing options as well as screenshots of the indicator and how we trade it at McMillan Analysis Corp.

SBER's Trend Jinni (Real/False Trend Detector)Trend Jinni - Your trading time friend that helps you take right decisions
Trend Jinni indicator can be used for scalping, day trade, swing trades, short term or for investment analysis of equities, indices, currencies, and commodities. It provides easy to visualize multiple pieces of critical information:
1) Finds opportunity with major trade change information
2) Fake moves / Fake / False or fading trends
2) Support/resistance level
4) When not to be in the trade
5) Stop loss information
Why Trend Jinni? It analyzes information and presents it much before other lagging indicators and adapts to the changes in securities
How to read Trend Jinni?
Jinni line color:
Red = Sell side trade
Green = Buy side trade
Black = No trade zone
Best entry point is the one which is closest to the Jinni price line.
Trade is recommended to be closed when price is below Jinni line (in case of buy side trade) or it is above Jinni line (in case of sell side trade)
What time frame should I use?
1 min = Very aggressive traders / Scalpers
5 min = Aggressive day traders
15 min = Patient day traders
60 min = Swing traders/Short term traders
1 day = Long term traders/Short term traders

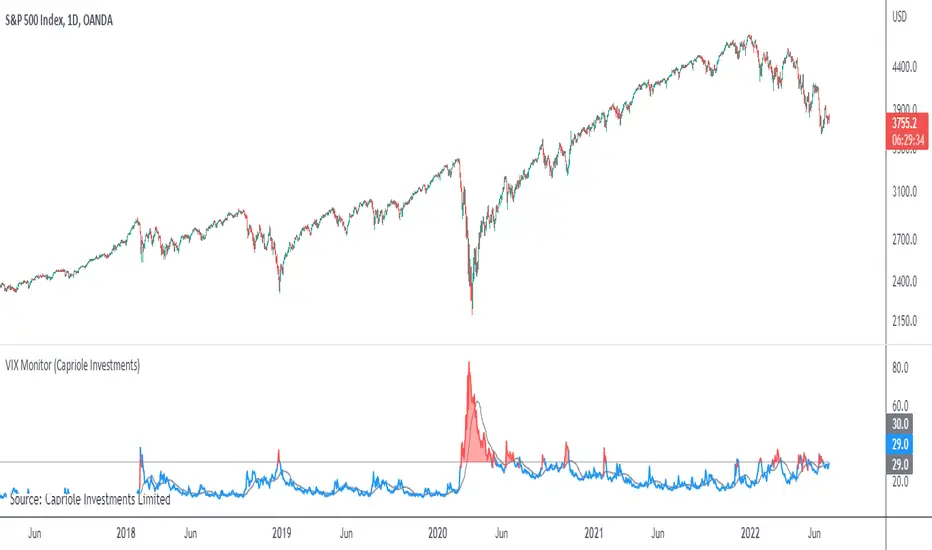
VIX MonitorSimple VIX Monitor to track spikes.
Spikes in VIX are often followed by big moves up in stocks.
Useful when paired with "Correlation & Beta" Indicator.
For Bitcoin Traders: when Bitcoin is highly correlated to Stocks (such as now) it could be a good opportunity for a short-term long trade.
Gold-Stocks RatioA historic risk-off flag.
When the Gold-Stocks Ratio is above the 200 week moving average, investors may fair better holding gold and avoiding equities, as was the case for the last 20 years.

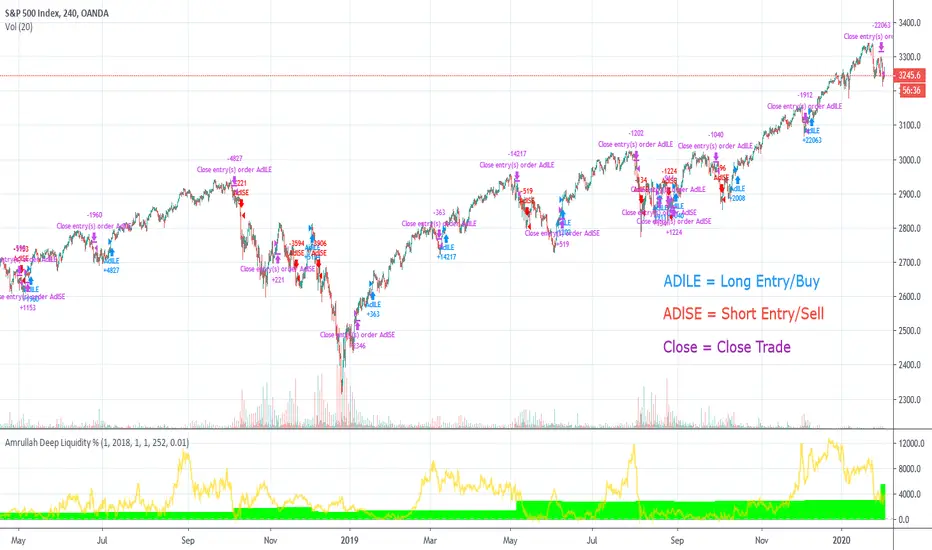
Amrullah Deep Liquidity for S&P 500Amrullah Deep Liquidity (ADL)
Amrullah Deep Liquidity (ADL) is a high profit factor strategy based on models designed by Muhd Amrullah.
Choosing your trading pair that you are planning to backtest
Check that you have been given access to Amrullah Deep Liquidity (ADL). Select SPX500USD with the default 4H time frame. Once done, open Indicators > Invite-Only Scripts > Amrullah Deep Liquidity %.
Choosing your initial capital that you want to begin backtesting
Go to Settings > Properties > Initial Capital and type in the amount of capital you're starting with. For the SPX500USD trading pair, the initial capital is denominated in USD.
Adjusting your equity at risk until the trades match your risk profile and comfort level
Go to Inputs > Equity Risk and adjust the value you are comfortable with. To analyse performance, you also want to choose the Start Year, Start Month and Start Date. Select lower equity risk for trades that you intend to take without the use of leverage. You can select an equity risk from 0.001 to 0.05 or all the way to 1.
Finding the time frame with the highest profit factor
Profit factor is defined as the gross profit a strategy makes across a defined period of time divided by its gross loss. You may choose to scroll through other time frames to find better models. You can select a different time frame from 1 min to 1H or all the way to 1M. Once you find the model you desire, you are encouraged to check that the model has a backtested profit factor of >3.5. You can then begin looking through the Performance Summary to find other detailed statistics.
Analysing the equity curve from the Amrullah Deep Liquidity (ADL) strategy
A green equity curve indicates that the trades are accumulating profits. A red equity curve indicates that the trades are accumulating losses. A healthy equity curve is one that is green and grows steadily to the right and upward direction.
Analysing the display arrows on the chart
Amrullah Deep Liquidity (ADL) tells you when to take a trade and how much to put in a trade. ADL can do this as the model identifies inventory risk in traders and market makers in the chosen market. On your Tradingview chart, ADL will display an arrow that tells you when to enter a trade. You can also see the amount to trade beside the arrow.
Opting for a trial
Yes you may opt for a trial which has limited availability.
The author's background and experience
My career in software and deep learning development spans across more than 5 years. At work, I lead a team to solve core computer vision tasks for large companies. I continually read all kinds of computer science books and papers, and follows progress on tools used in financial markets.
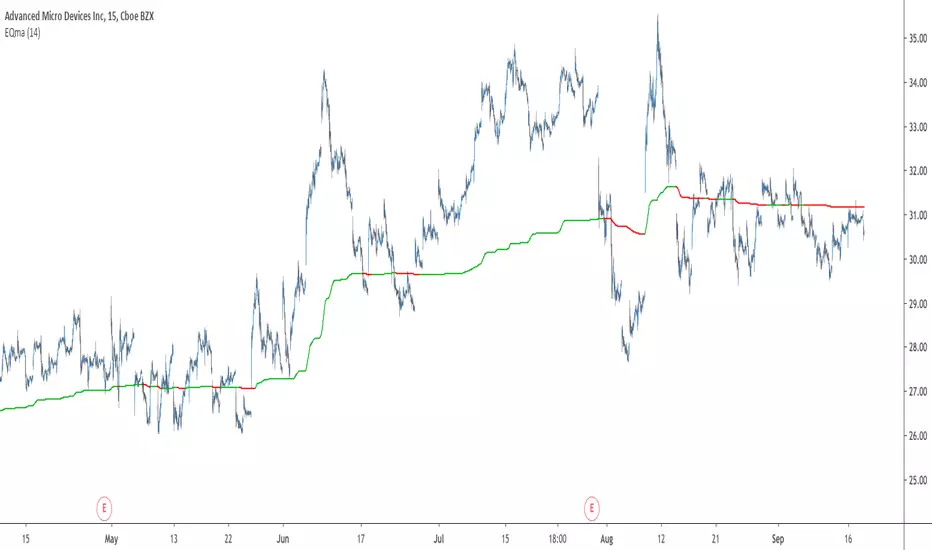
EQma - Adaptive Smoothing Based On Optimal Markets DetectionIntroduction
"You don’t put sunscreen when there is no sun, you don’t use an umbrella when there is no rain, you don’t use a kite when there is no wind, so why would you use a trend following strategy when there is no trend ?"
This is how i start my 4th paper "A New Technical Indicator For Optimal Markets Detection" where i present two new technical indicators. We talked about the first one, running equity, which aim to detect the best moment to enter trades, based on this new metric i made an adaptive moving average.
You can see the full paper here figshare.com
The Indicator
The moving average is based on exponential averaging and use a smoothing variable alpha based on the running equity metric, in order to calculate alpha the running equity is divided by the optimal equity which show the best returns possible for the conditions used. Basically the indicator work as follow :
When the running equity is close to the optimal equity it means that the price need no/little filtering since it does not contain information that need to be filtered, therefore alpha is high, however when the running equity is far from the optimal equity this mean that the price posses malign information that need to be removed.
This is why the indicator will be closer to the price when length is high :
See the full paper for an explanation on how this work.
I added various options for the indicator, one will reduce the lag by squaring alpha, thus giving for length = 14 :
The efficient option will make use of recursion to provide a more efficient indicator :
In green the efficient version, note how this option can allow a better fit with the price.
Conclusion
This is an indicator but at its core its rather a framework, if you have read the paper you'll see that the conditions are just 1 and -1 that changes with time, basically its like making a strategy with :
Condition = if buy then 1 else if sell then -1 else Precedent value of condition.
So those two indicators allow to give useful and usable information about your strategy. I hope it can be of use for anyone here, if so don't hesitate to send me what you made using the proposed indicator (and with all my indicators in general). If you are writing a paper and you think this indicator could fit in your work then let me know so i can be aware of it :)
Thanks for reading !
Acknowledgement
My papers are quite ridiculous but they still manage to get some views, some researchers don't even reach those number in so little time which is quite unfortunate but also really motivating for me, so thanks to those who take time to read them and give me some feedback :)
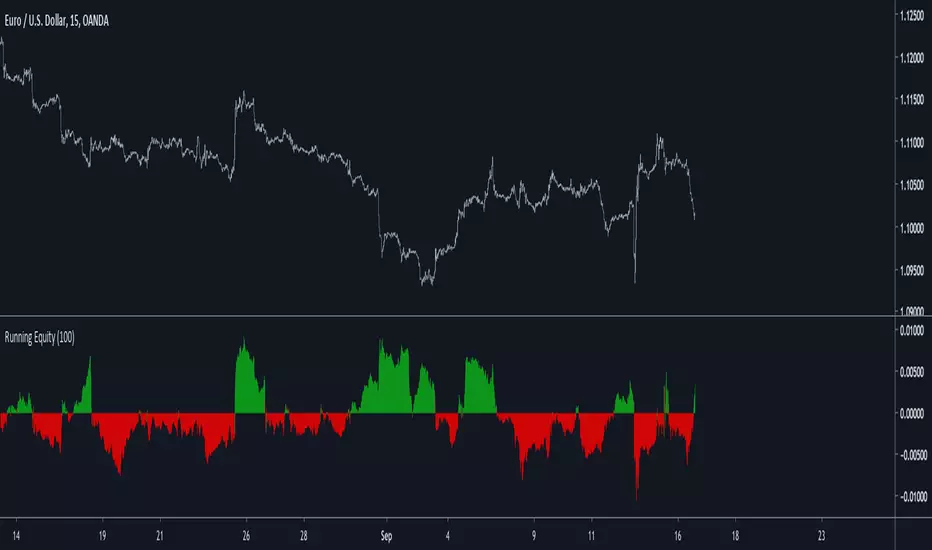
Running Equity - A New Indicator For Optimal Markets DetectionIntroduction
Winning trades and gaining profits in trading is not impossible, however having gross profits superior to gross losses is what make trading challenging, it is logical to think that it is better to open a position when the probability of winning the trade is high, such probability can’t be measured with accuracy but a lot of metrics have been proposed in order to help determining when to open positions, technical analysis support the fact that a trending market is the best market condition for opening a position, which is logical when using a trend following strategy, therefore a long-term positive auto-correlated market is optimal for trading, this is why this paper present a new method for detecting optimal markets conditions in order to open a position.
The Indicator
The proposed indicator is based on the assumption that positive returns using a trend following strategy are a strong indication of trend strength, the proposed indicator is built from the conditions of a simple SMA cross trend following strategy, which are to go long when price > SMA and to go short when price < SMA. Then the equity from those conditions is built, in order to provide a more flexible indicator, length control the period of the sum.
When the indicator is positive it means that the market allow for potential returns, it can thus be considered being trending. Else a negative value of the indicator indicate a ranging market that won't allow for returns.
Filtering Bad Trades
The indicator can be used to filter bad trades entries, in this example a Bollinger band breakout strategy is used, without any changes the strategy return the following equity on EURUSD
The proposed indicator is then applied with the following conditions : buy and sell only if Req > 0
With an indicator period = 100 we filtered unprofitable trades.
Conclusion
I presented a new indicator for the detection of optimal markets based on a running equity. I hope both indicators may find applications in technical analysis and help investors get pertinent outputs from them.
it would mean a lot if you could read the original paper : figshare.com
Oasis Trend StrategyThis is a simple script developed to give a quick visual of trend on any given time frame.
This is a script that gives signals of trend switches. Can be used to for buying and selling signals.
On larger time Frames we use the Aqua and Fuchsia Clouds to express the larger time frame trends.
This can be used for long term swing trades especially useful with the 4hr, 6 hr, and daily chart to cancel out all the noise within the larger trends. The smaller Blue/Red Clouds can be used within trend if you are a skillful trader.
On smaller time frames (Intraday), we used the Blue and Red intraday price action. Is meant to be used
alongside with the Aqua/Fuchsia to create short term trades decisions within the short term trends indicated by the Aqua and Fuchsia.
The 9 ema is used to keep a close eye on short term directional changes.
You would want to see if price stays above or below this level along with its price action.
This should give you initial signs of strength or weakness.
The 55 ema (Black) is used to determine larger trend directional changes and for confirmation of trend shifts.
If interested, you can learn a lot just by watching the price react to these levels and can really visualize the price action that encompasses these averages.
We recommend that all traders study Technical patterns, Price action, Financial risk management, and other pre-trade planning strategies to minimize drawdown risk.
Please give us a like and a follow if you like this indicator. Its simple and very easy to use.
We are not financial advisors. We do not give financial advise. Please use this indicator at your free will.
We are not responsible for any financial losses or claims.
If you find this indicator very useful as I have, we do appreciate any amount of tips.
This will fund us to create more indicators to be made for your use.
BTC - 3PmVmmsnuLedg7umzVkLnarKRo43g6P5Tp
ETH - 0x9a1Ba8809687D8d9A1D32Ed1602abEef48060aF1
LTC - MAgqbC6Kev1x3L2GvNwzhZacyBRxCKJ8Mi
ZCash - t1UYRLzQxeaHCNYfA9cLChfBX5mbcNqworA
0x - 0x2B07D8BFB20b6eDb9A498113764082211cdFA2cE
Many free Tradingview users can benefit from our indicators as we employ many many useful indicators that can be toggled in each script to surpass the indicator limits.

Short-Term Trend MasterThis is a short-term trend-following trading strategy.
Buy when there is a moving average crossover and green background signal.
Sell when there is a moving average crossover and red background signal.
Try different timeframes to find the best one.
Cheers!

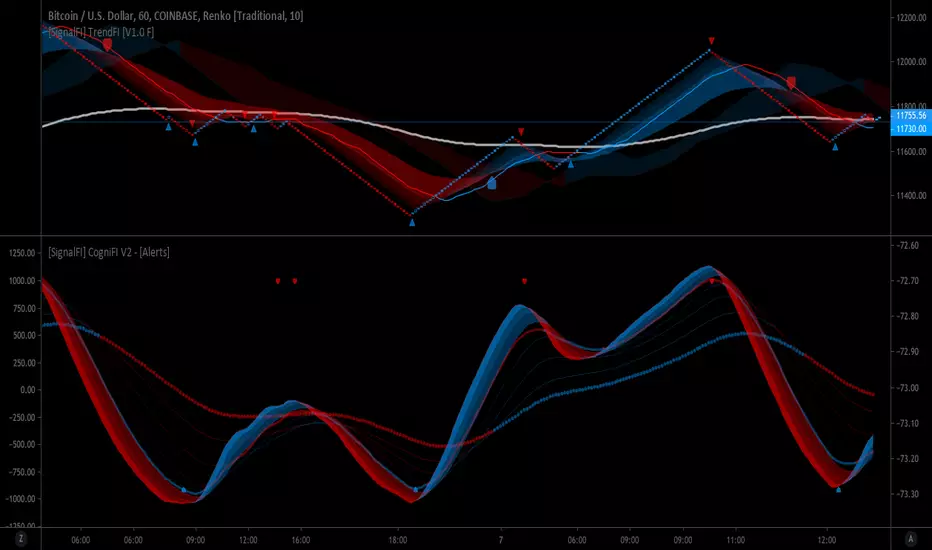
[SignalFI] CogniFI V1 - [Alerts]CogniFI uses 8 independent Fibonacci based inputs to calculate a unified Center Of Gravity (COG) and RMA or RSI based moving average created by J. Welles Wilder.
FIBONACCI BASED TREND AND MOMENTUM DISCOVERY
RSI BASED MOVING AVERAGES COMBINED WITH CENTER OF GRAVITY (COG)
COLOR BASED TREND SMOOTHING FOR INDICATOR SIGNAL
SignalFI was created to help traders and investors to effectively analyze the market based on the Golden Mean Ratio (Fibonacci numbers), plan a trade and ultimately execute it. To help inform and educate market decisions we developed a set of Trading Indicators which are available on TradingView , the most advanced and yet easy to use charting platform available on the web.
SignalFI indicators are just that, indicators. Our indicators are generally configured to use completely historical data (negating repaint), and we advise all alerts created with SignalFI indicators to be fired upon "close" of the current candle. Our indicators can provide valuable context and visualization support when performing market analysis and executing buy and sell decisions. However. we are not financial experts, and all information presented on this site or our other media outlets are for educational purposes only.
For subscription information, visit www.signalfi.net and follow us on twitter: @signalfi_
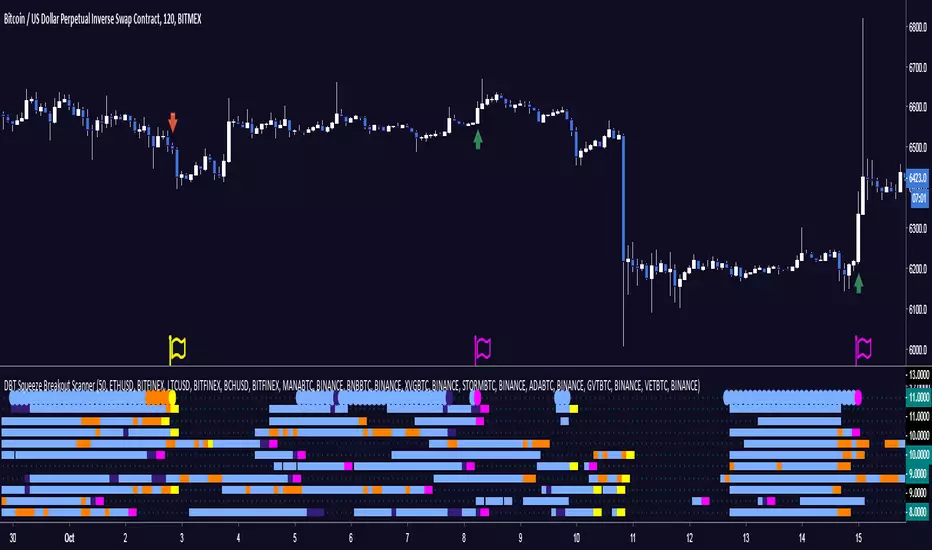
DBT Squeeze Breakout ScannerThe DBT Squeeze Scanner helps you keep an eye on 10 instruments at the same time. It uses a modified version of the DBT Squeeze strategy and scans this strategy against 10 instruments at the same time.
The scanner looks for areas of low volatility signified by a Bollinger Band squeeze and a light blue coloring on the scanner. Once it is squeezing it looks for potential breakout or breakdown opportunities
The scanner has warning signals for both long and short (sell for non margin exchanges) signals, these warning signals are shown as follows:
Light Blue = Bollinger Band Squeeze
Purple = Get ready for a Breakout
Pink = Squeeze has let go and a Breakout is Incoming
Orange = Get ready for a Breakdown
Yellow = Squeeze has let go and a Breakdown is Incoming
All of these signals have their own TradingView alerts. Alerts can be set for anyone of the 10 chosen instruments. Over 10 different kinds of alerts can be setup all at the same time.
This indicator is designed specifically for trending markets, and can be used in many different markets including: Equities, Futures, Commodities, Forex, and Cryptocurrencies. it will give significantly different signals in ranging markets. This indicator is also designed to be 100% preference, PLEASE make sure to choose which 10 instruments you want to watch, the defaults are just some of the major Cryptocurrencies.
Use at your own risk. This is not financial advise and this indicator is not guaranteed to make you profits. Please message me if you have any questions or feedback. Enjoy.
MADE BY GYROMATICAL
Understanding order sizestype: properties manipulation, no programming needed
time required: 15minutes, at least
level: medium (need to know contracts, trading pairs)
A strategy can "appear" to work or be broken depending on the pile of cash that is working on. This amount is defined in the strat properties, under "order size".
For noobs (like me) this is very confusing at first :)
A strat opens/closes positions using units, a generic measure for the chart being operated on. Thes "units" can be a fixed amount of cash, a fixed amount of contracts, or a floating amount based on the last profits made. I recommend checking my previous strat to figure the case of contracts .
So, any trading price is the amount of "things" you get for some "cash". The things are the first unit, the "cash" is the second. Some examples:
XAU/USD - 1 xau oz is worth x dollars
BTC/USD - 1 bitcoin is worth x dollars
GBP/EUR - 1 pound is worth x euros
To add to confusion, a lot of markets the "unit size" is different from what the strat thinks it is. An options contract is 100 shares(the unit), 1 xau contract is 10 oz(units), 1 eur/usd contract is 100k euros and so on... so, after figuring out how the sizes work in a strat, then the sizes must be adapted for the specific market in question.
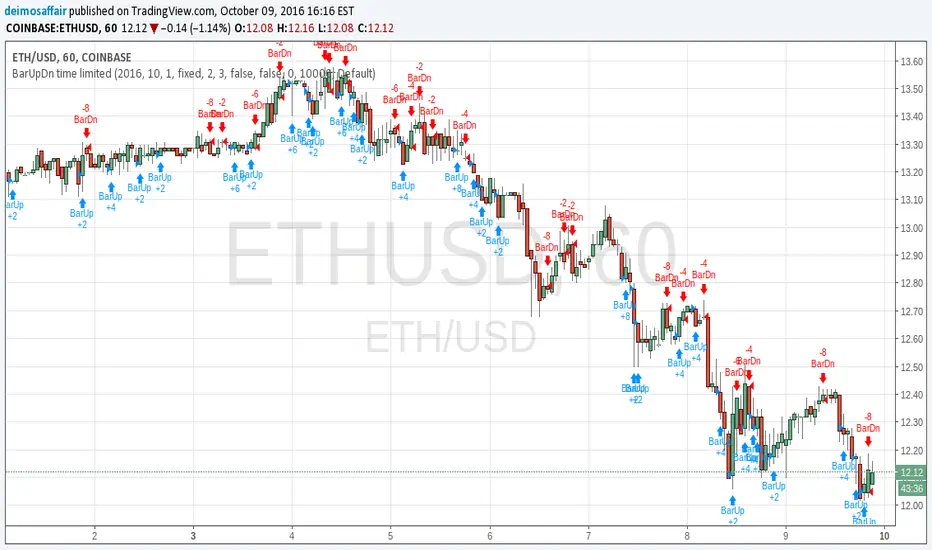
The choice os using the ETHUSD pair is because:
1 - you can buy 1eth, unlike a gold contract for example, so 1 "unit" = 1 eth, easier to get
2 - ETH is around 12 bucks, wich gives round numbers on the math, easier to wrap the brains around :)
3- is an unusual pair, so the regular contract sizes don't apply, and the brain is not conditioned to work inside the box ;)
You will have to access the script properties, to change the values. As these values are changed you will see exactly the differences in the values of the strat.
Text is too long, check the comments for all the cases
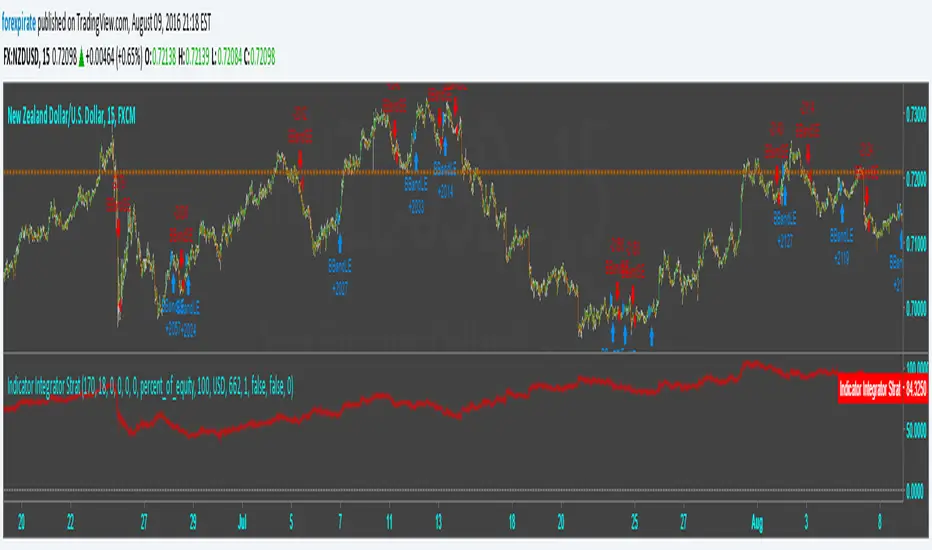
Indicator Integrator Strat <<<<<< UPDATED with CorrectionFound an error in the orders. Script was making double orders at times. I fixed it. It is tuned as such:
NZDUSD
15 min chart
starting $USD to show 1000 contracts for minicontract with FXCM (start date 3-18 $633 with 1:50 leverage)
Indicator plots ==> Starting equity - (trade gain and loses) - (number of trades) * (spread) = true balance estimate